Managing Finance (FINA6000): Case Analysis Report on Two Companies
VerifiedAdded on 2022/09/15
|17
|2392
|16
Report
AI Summary
This report presents a comprehensive financial analysis of National Australia Bank (NAB) and Nib Holdings Limited (NHF) for the period of 2014-2018, fulfilling the requirements of a FINA6000 assignment. The analysis includes a comparative evaluation of the companies' financial performance, focusing on profitability, liquidity, and investment ratios. The report delves into the capital structure of each company, assessing debt-to-equity ratios and the weighted average cost of capital (WACC). Furthermore, the report employs the dividend discount model to value the shares of both companies, offering investment recommendations based on the findings. The executive summary provides an overview of the stakeholders involved in financial analysis of the quantitative information presented in the financial statements so as to arrive at varied business decisions such as to invest in the shares of the company or not. The tools of ratio analysis, WACC, and dividend discount models have been used to compare the financial performances of the companies. The report concludes with a recommendation on which company's shares would be a better investment.

Managing Finance
Assessment 3 - Case Analysis
Assessment 3 - Case Analysis
Paraphrase This Document
Need a fresh take? Get an instant paraphrase of this document with our AI Paraphraser
FINA6000 Managing Finance 1
Executive Summary
The stakeholders engage in the financial analysis of the quantitative information
presented in the financial statements so as to arrive at varied business decisions such as to
invest in the shares of the company or not. In addition it aids in the comparative evaluation of
the performances with the industry benchmarks, along with the trend analysis. The tools of
ratio analysis, WACC, Dividend Discount Models have been used to compare the finanicl
performances of the companies National Australia Bank and Nib Holdings Limited for the
years 2041-2018. It has been assessed that the NAB has a better overall standing.
FINA6000 Managing Finance 2
Contents
Introduction...........................................................................................................................................3
Overview...........................................................................................................................................3
Purpose of the report..........................................................................................................................3
Analysis.................................................................................................................................................3
Background of the companies............................................................................................................3
Profitability, Liquidity and Investment ratios....................................................................................4
Profitability Ratios.........................................................................................................................4
Liquidity Ratios.............................................................................................................................7
Investment Ratios..........................................................................................................................7
Analysis of the capital structure.........................................................................................................8
Historical weighted average cost of capital........................................................................................9
Valuation of the shares of the companies..........................................................................................9
Recommendation and Conclusion.........................................................................................................9
⊘ This is a preview!⊘
Do you want full access?
Subscribe today to unlock all pages.
Trusted by 1+ million students worldwide
FINA6000 Managing Finance 3
Introduction
Overview
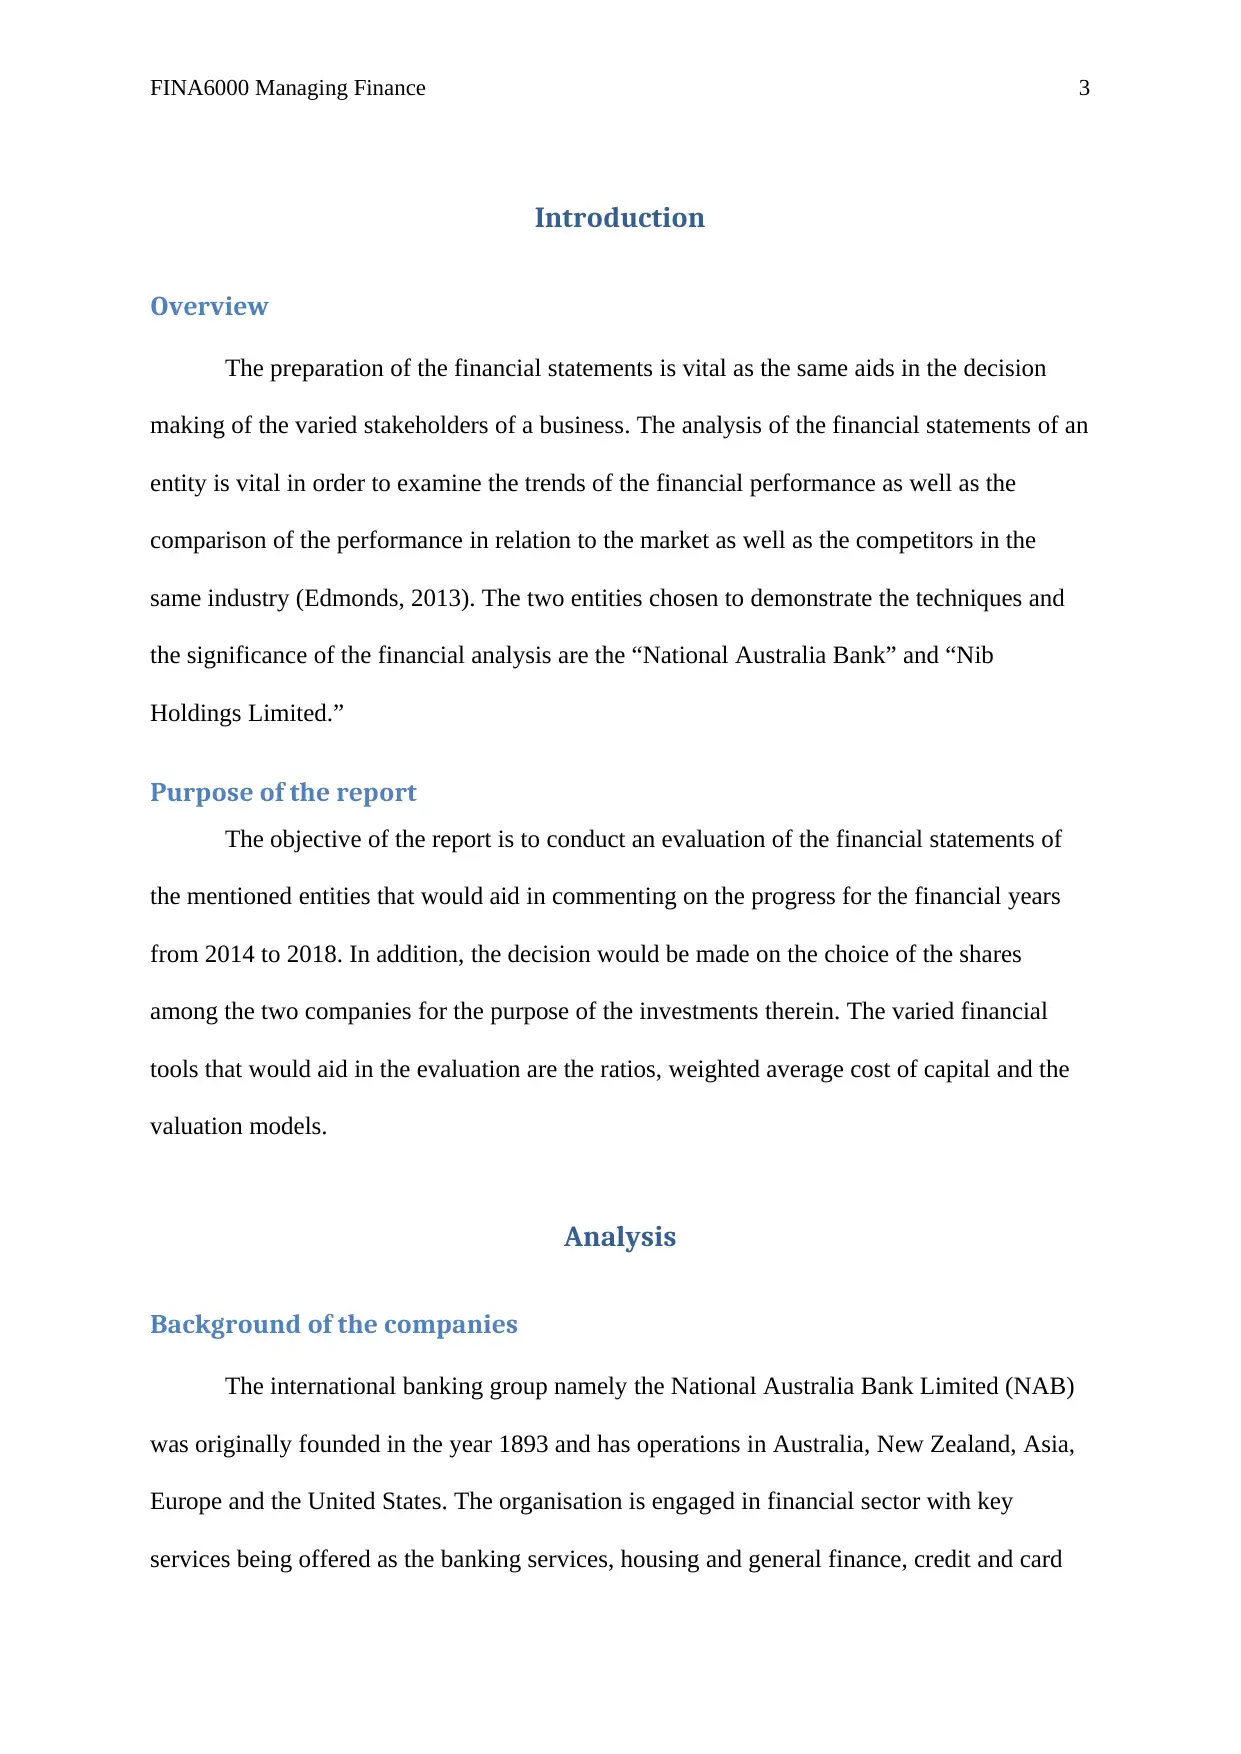
The preparation of the financial statements is vital as the same aids in the decision
making of the varied stakeholders of a business. The analysis of the financial statements of an
entity is vital in order to examine the trends of the financial performance as well as the
comparison of the performance in relation to the market as well as the competitors in the
same industry (Edmonds, 2013). The two entities chosen to demonstrate the techniques and
the significance of the financial analysis are the “National Australia Bank” and “Nib
Holdings Limited.”
Purpose of the report
The objective of the report is to conduct an evaluation of the financial statements of
the mentioned entities that would aid in commenting on the progress for the financial years
from 2014 to 2018. In addition, the decision would be made on the choice of the shares
among the two companies for the purpose of the investments therein. The varied financial
tools that would aid in the evaluation are the ratios, weighted average cost of capital and the
valuation models.
Analysis
Background of the companies
The international banking group namely the National Australia Bank Limited (NAB)
was originally founded in the year 1893 and has operations in Australia, New Zealand, Asia,
Europe and the United States. The organisation is engaged in financial sector with key
services being offered as the banking services, housing and general finance, credit and card
Introduction
Overview
The preparation of the financial statements is vital as the same aids in the decision
making of the varied stakeholders of a business. The analysis of the financial statements of an
entity is vital in order to examine the trends of the financial performance as well as the
comparison of the performance in relation to the market as well as the competitors in the
same industry (Edmonds, 2013). The two entities chosen to demonstrate the techniques and
the significance of the financial analysis are the “National Australia Bank” and “Nib
Holdings Limited.”
Purpose of the report
The objective of the report is to conduct an evaluation of the financial statements of
the mentioned entities that would aid in commenting on the progress for the financial years
from 2014 to 2018. In addition, the decision would be made on the choice of the shares
among the two companies for the purpose of the investments therein. The varied financial
tools that would aid in the evaluation are the ratios, weighted average cost of capital and the
valuation models.
Analysis
Background of the companies
The international banking group namely the National Australia Bank Limited (NAB)
was originally founded in the year 1893 and has operations in Australia, New Zealand, Asia,
Europe and the United States. The organisation is engaged in financial sector with key
services being offered as the banking services, housing and general finance, credit and card
Paraphrase This Document
Need a fresh take? Get an instant paraphrase of this document with our AI Paraphraser
FINA6000 Managing Finance 4
facilities, international and investment banking, leasing, wealth and funds management, and
others. The shares of the company are traded on the Australian Stock Exchange under the
symbol of “NAB.AU.”
The company Nibs Holdings Limited as founded in the year 2007 is health and
medical insurance company based at Australia. The Company is engaged in the operation of
private health insurance for residents of Australia, New Zealand and the students and
international visitors to Australia. The Company’s shares are listed on the Australian Stock
Exchange under the symbol, “NHF.AU.”
Profitability, Liquidity and Investment ratios
The analysis of the profitability, liquidity and the investment ratios of the companies
over the period of five years is presented as follows.
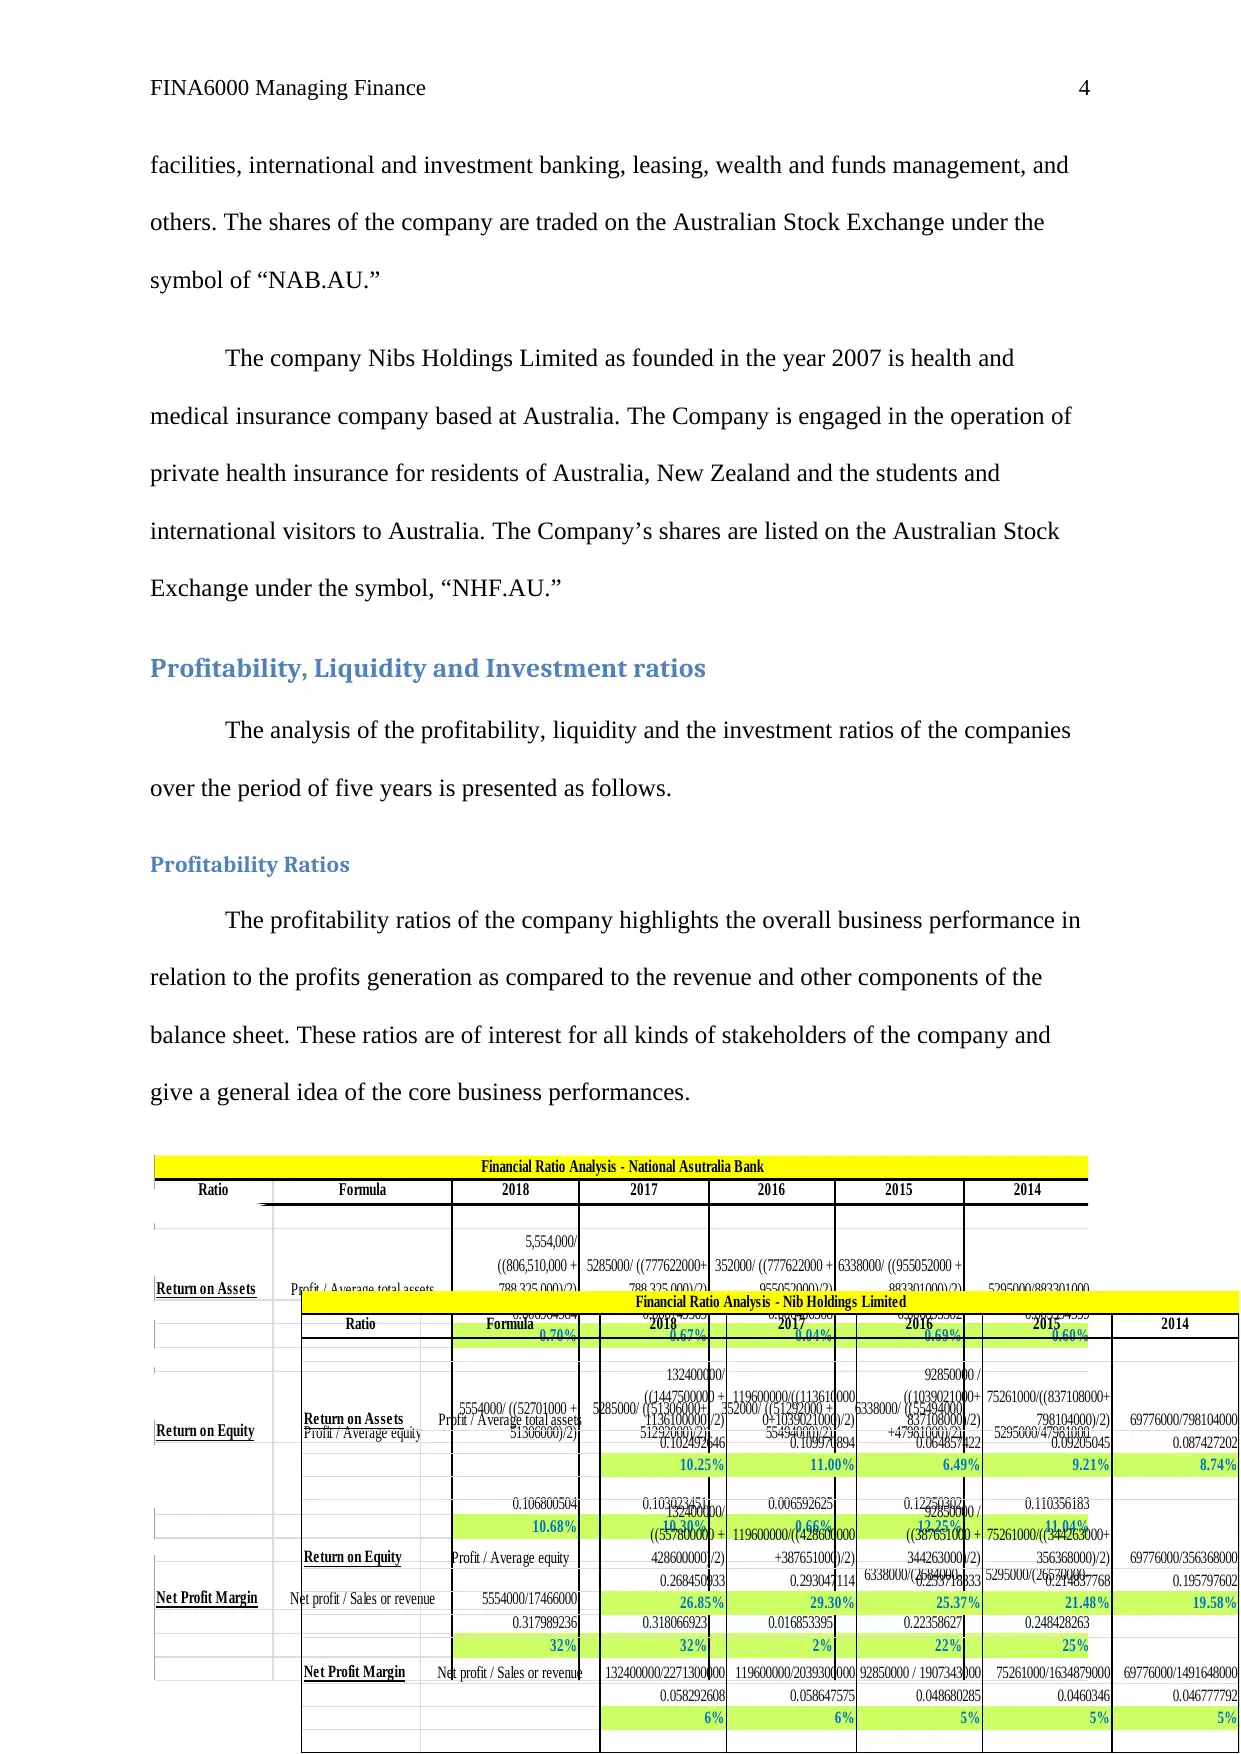
Profitability Ratios
The profitability ratios of the company highlights the overall business performance in
relation to the profits generation as compared to the revenue and other components of the
balance sheet. These ratios are of interest for all kinds of stakeholders of the company and
give a general idea of the core business performances.
Ratio Formula 2018 2017 2016 2015 2014
Return on Assets Profit / Average total assets
5,554,000/
((806,510,000 +
788,325,000)/2)
5285000/ ((777622000+
788,325,000)/2)
352000/ ((777622000 +
955052000)/2)
6338000/ ((955052000 +
883301000)/2) 5295000/883301000
0.006964984 0.006749909 0.000406308 0.006895302 0.005994559
0.70% 0.67% 0.04% 0.69% 0.60%
Return on Equity Profit / Average equity
5554000/ ((52701000 +
51306000)/2)
5285000/ ((51306000+
51292000)/2)
352000/ ((51292000 +
55494000)/2)
6338000/ ((55494000
+47981000)/2) 5295000/47981000
0.106800504 0.103023451 0.006592625 0.12250302 0.110356183
10.68% 10.30% 0.66% 12.25% 11.04%
Net Profit Margin Net profit / Sales or revenue 5554000/17466000 5285000/ 16616000 352000/ 20886000
6338000/(2684000-
5707000)
5295000/(26570000-
5256000)
0.317989236 0.318066923 0.016853395 0.22358627 0.248428263
32% 32% 2% 22% 25%
Financial Ratio Analysis - National Asutralia Bank
Ratio Formula 2018 2017 2016 2015 2014
Return on Assets Profit / Average total assets
132400000/
((1447500000 +
1136100000)/2)
119600000/((113610000
0+1039021000)/2)
92850000 /
((1039021000+
837108000)/2)
75261000/((837108000+
798104000)/2) 69776000/798104000
0.102492646 0.109970894 0.064857422 0.09205045 0.087427202
10.25% 11.00% 6.49% 9.21% 8.74%
Return on Equity Profit / Average equity
132400000/
((557800000 +
428600000)/2)
119600000/((428600000
+387651000)/2)
92850000 /
((387651000 +
344263000)/2)
75261000/((344263000+
356368000)/2) 69776000/356368000
0.268450933 0.293047114 0.253718333 0.214837768 0.195797602
26.85% 29.30% 25.37% 21.48% 19.58%
Net Profit Margin Net profit / Sales or revenue 132400000/2271300000 119600000/2039300000 92850000 / 1907343000 75261000/1634879000 69776000/1491648000
0.058292608 0.058647575 0.048680285 0.0460346 0.046777792
6% 6% 5% 5% 5%
Financial Ratio Analysis - Nib Holdings Limited
facilities, international and investment banking, leasing, wealth and funds management, and
others. The shares of the company are traded on the Australian Stock Exchange under the
symbol of “NAB.AU.”
The company Nibs Holdings Limited as founded in the year 2007 is health and
medical insurance company based at Australia. The Company is engaged in the operation of
private health insurance for residents of Australia, New Zealand and the students and
international visitors to Australia. The Company’s shares are listed on the Australian Stock
Exchange under the symbol, “NHF.AU.”
Profitability, Liquidity and Investment ratios
The analysis of the profitability, liquidity and the investment ratios of the companies
over the period of five years is presented as follows.
Profitability Ratios
The profitability ratios of the company highlights the overall business performance in
relation to the profits generation as compared to the revenue and other components of the
balance sheet. These ratios are of interest for all kinds of stakeholders of the company and
give a general idea of the core business performances.
Ratio Formula 2018 2017 2016 2015 2014
Return on Assets Profit / Average total assets
5,554,000/
((806,510,000 +
788,325,000)/2)
5285000/ ((777622000+
788,325,000)/2)
352000/ ((777622000 +
955052000)/2)
6338000/ ((955052000 +
883301000)/2) 5295000/883301000
0.006964984 0.006749909 0.000406308 0.006895302 0.005994559
0.70% 0.67% 0.04% 0.69% 0.60%
Return on Equity Profit / Average equity
5554000/ ((52701000 +
51306000)/2)
5285000/ ((51306000+
51292000)/2)
352000/ ((51292000 +
55494000)/2)
6338000/ ((55494000
+47981000)/2) 5295000/47981000
0.106800504 0.103023451 0.006592625 0.12250302 0.110356183
10.68% 10.30% 0.66% 12.25% 11.04%
Net Profit Margin Net profit / Sales or revenue 5554000/17466000 5285000/ 16616000 352000/ 20886000
6338000/(2684000-
5707000)
5295000/(26570000-
5256000)
0.317989236 0.318066923 0.016853395 0.22358627 0.248428263
32% 32% 2% 22% 25%
Financial Ratio Analysis - National Asutralia Bank
Ratio Formula 2018 2017 2016 2015 2014
Return on Assets Profit / Average total assets
132400000/
((1447500000 +
1136100000)/2)
119600000/((113610000
0+1039021000)/2)
92850000 /
((1039021000+
837108000)/2)
75261000/((837108000+
798104000)/2) 69776000/798104000
0.102492646 0.109970894 0.064857422 0.09205045 0.087427202
10.25% 11.00% 6.49% 9.21% 8.74%
Return on Equity Profit / Average equity
132400000/
((557800000 +
428600000)/2)
119600000/((428600000
+387651000)/2)
92850000 /
((387651000 +
344263000)/2)
75261000/((344263000+
356368000)/2) 69776000/356368000
0.268450933 0.293047114 0.253718333 0.214837768 0.195797602
26.85% 29.30% 25.37% 21.48% 19.58%
Net Profit Margin Net profit / Sales or revenue 132400000/2271300000 119600000/2039300000 92850000 / 1907343000 75261000/1634879000 69776000/1491648000
0.058292608 0.058647575 0.048680285 0.0460346 0.046777792
6% 6% 5% 5% 5%
Financial Ratio Analysis - Nib Holdings Limited
FINA6000 Managing Finance 5
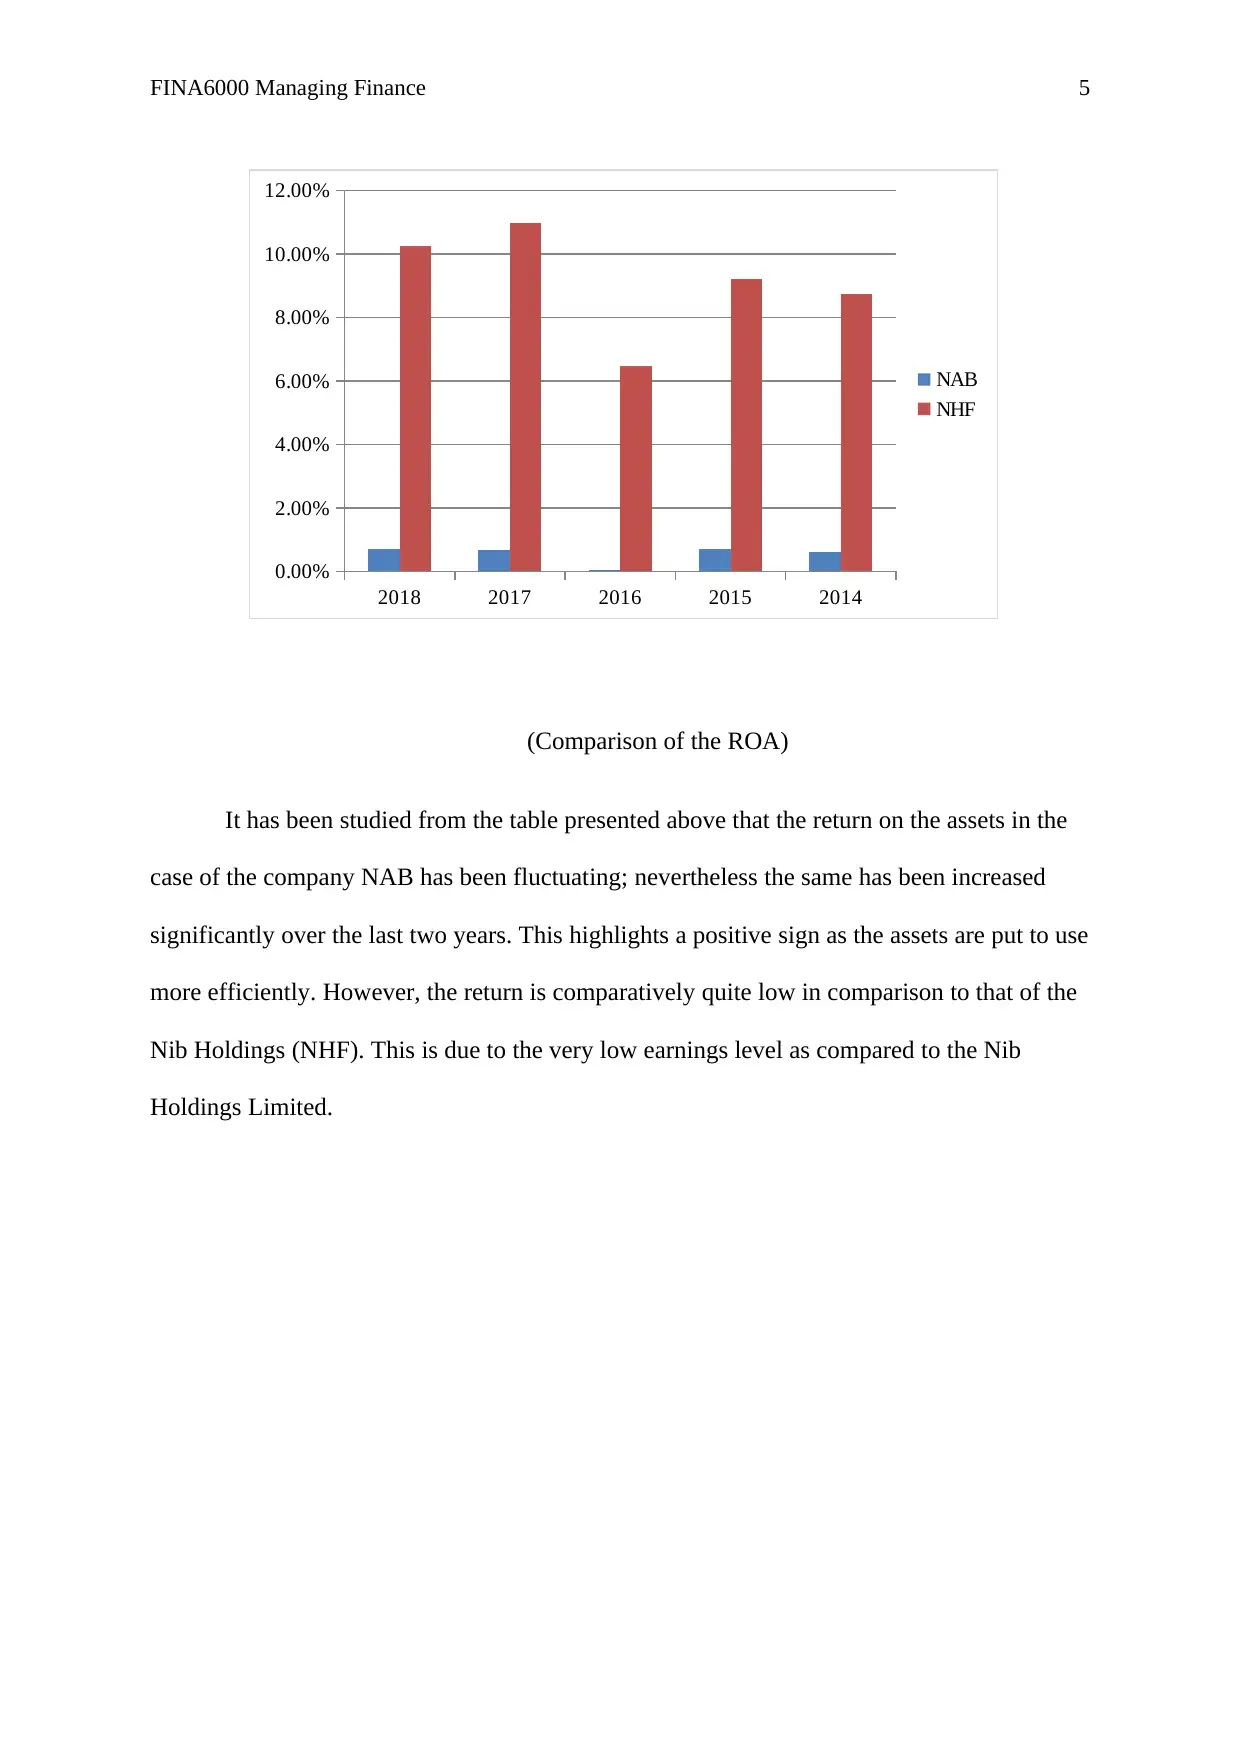
(Comparison of the ROA)
It has been studied from the table presented above that the return on the assets in the
case of the company NAB has been fluctuating; nevertheless the same has been increased
significantly over the last two years. This highlights a positive sign as the assets are put to use
more efficiently. However, the return is comparatively quite low in comparison to that of the
Nib Holdings (NHF). This is due to the very low earnings level as compared to the Nib
Holdings Limited.
2018 2017 2016 2015 2014
0.00%
2.00%
4.00%
6.00%
8.00%
10.00%
12.00%
NAB
NHF
⊘ This is a preview!⊘
Do you want full access?
Subscribe today to unlock all pages.
Trusted by 1+ million students worldwide
FINA6000 Managing Finance 6
2018 2017 2016 2015 2014
0%
5%
10%
15%
20%
25%
30%
35%
NAB
NHF
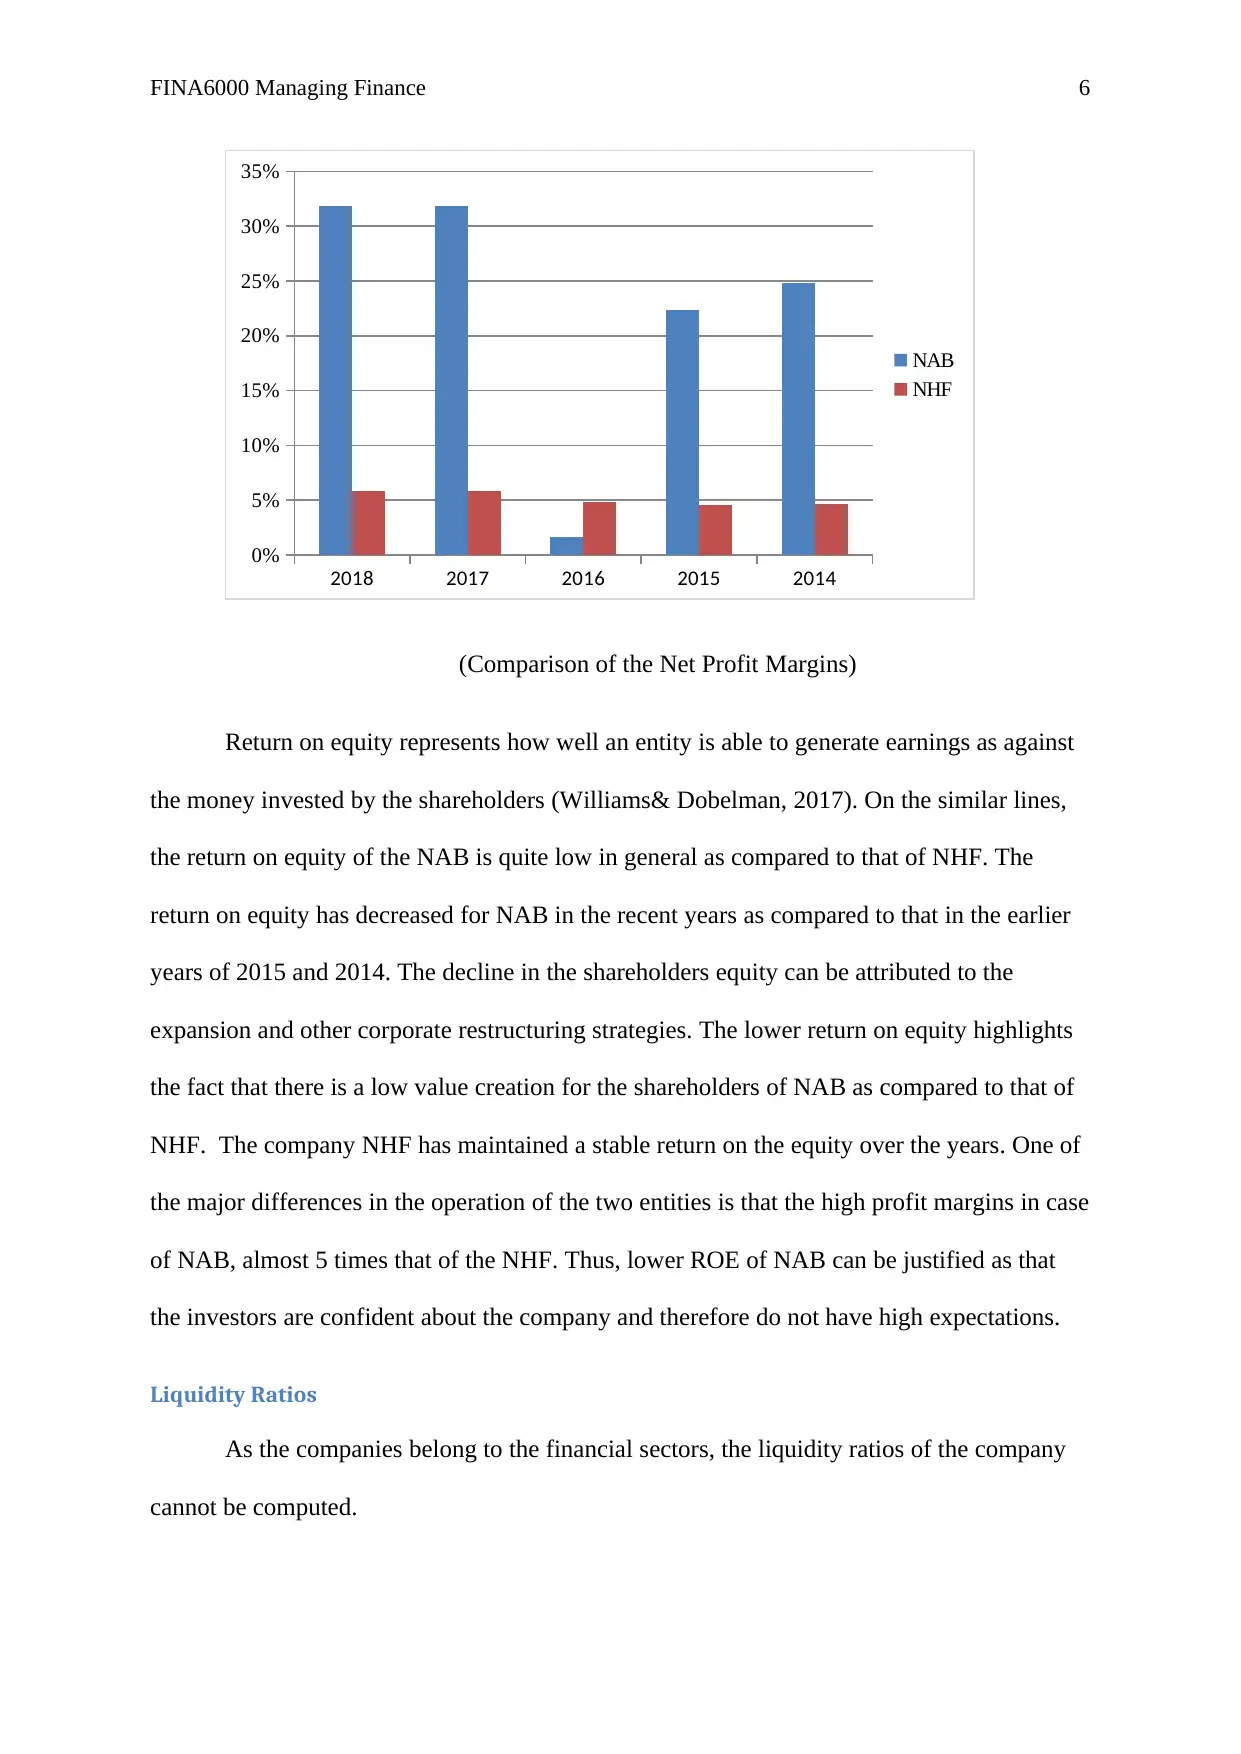
(Comparison of the Net Profit Margins)
Return on equity represents how well an entity is able to generate earnings as against
the money invested by the shareholders (Williams& Dobelman, 2017). On the similar lines,
the return on equity of the NAB is quite low in general as compared to that of NHF. The
return on equity has decreased for NAB in the recent years as compared to that in the earlier
years of 2015 and 2014. The decline in the shareholders equity can be attributed to the
expansion and other corporate restructuring strategies. The lower return on equity highlights
the fact that there is a low value creation for the shareholders of NAB as compared to that of
NHF. The company NHF has maintained a stable return on the equity over the years. One of
the major differences in the operation of the two entities is that the high profit margins in case
of NAB, almost 5 times that of the NHF. Thus, lower ROE of NAB can be justified as that
the investors are confident about the company and therefore do not have high expectations.
Liquidity Ratios
As the companies belong to the financial sectors, the liquidity ratios of the company
cannot be computed.
2018 2017 2016 2015 2014
0%
5%
10%
15%
20%
25%
30%
35%
NAB
NHF
(Comparison of the Net Profit Margins)
Return on equity represents how well an entity is able to generate earnings as against
the money invested by the shareholders (Williams& Dobelman, 2017). On the similar lines,
the return on equity of the NAB is quite low in general as compared to that of NHF. The
return on equity has decreased for NAB in the recent years as compared to that in the earlier
years of 2015 and 2014. The decline in the shareholders equity can be attributed to the
expansion and other corporate restructuring strategies. The lower return on equity highlights
the fact that there is a low value creation for the shareholders of NAB as compared to that of
NHF. The company NHF has maintained a stable return on the equity over the years. One of
the major differences in the operation of the two entities is that the high profit margins in case
of NAB, almost 5 times that of the NHF. Thus, lower ROE of NAB can be justified as that
the investors are confident about the company and therefore do not have high expectations.
Liquidity Ratios
As the companies belong to the financial sectors, the liquidity ratios of the company
cannot be computed.
Paraphrase This Document
Need a fresh take? Get an instant paraphrase of this document with our AI Paraphraser
FINA6000 Managing Finance 7
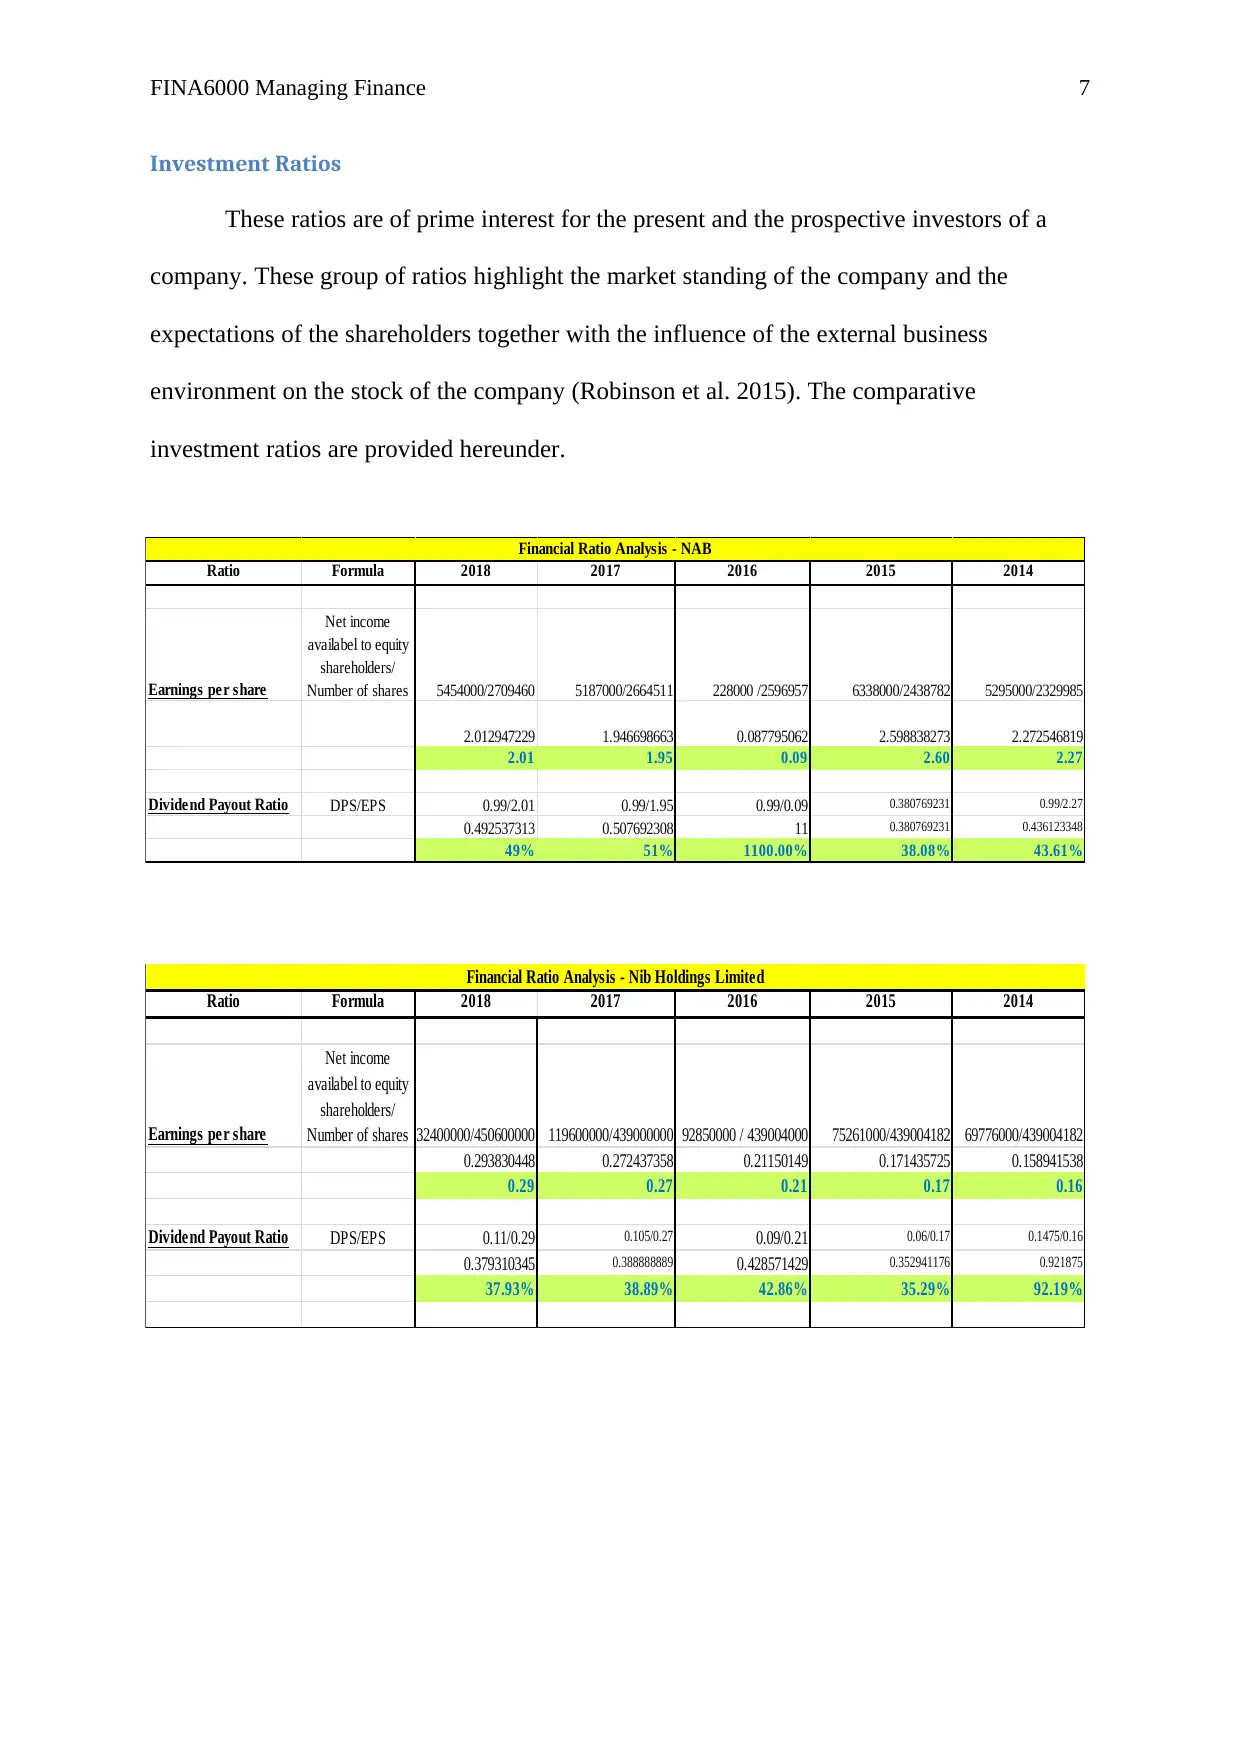
Investment Ratios
These ratios are of prime interest for the present and the prospective investors of a
company. These group of ratios highlight the market standing of the company and the
expectations of the shareholders together with the influence of the external business
environment on the stock of the company (Robinson et al. 2015). The comparative
investment ratios are provided hereunder.
Ratio Formula 2018 2017 2016 2015 2014
Earnings per share
Net income
availabel to equity
shareholders/
Number of shares 5454000/2709460 5187000/2664511 228000 /2596957 6338000/2438782 5295000/2329985
2.012947229 1.946698663 0.087795062 2.598838273 2.272546819
2.01 1.95 0.09 2.60 2.27
Dividend Payout Ratio DPS/EPS 0.99/2.01 0.99/1.95 0.99/0.09 0.380769231 0.99/2.27
0.492537313 0.507692308 11 0.380769231 0.436123348
49% 51% 1100.00% 38.08% 43.61%
Financial Ratio Analysis - NAB
Ratio Formula 2018 2017 2016 2015 2014
Earnings per share
Net income
availabel to equity
shareholders/
Number of shares132400000/450600000 119600000/439000000 92850000 / 439004000 75261000/439004182 69776000/439004182
0.293830448 0.272437358 0.21150149 0.171435725 0.158941538
0.29 0.27 0.21 0.17 0.16
Dividend Payout Ratio DPS/EPS 0.11/0.29 0.105/0.27 0.09/0.21 0.06/0.17 0.1475/0.16
0.379310345 0.388888889 0.428571429 0.352941176 0.921875
37.93% 38.89% 42.86% 35.29% 92.19%
Financial Ratio Analysis - Nib Holdings Limited
FINA6000 Managing Finance 8
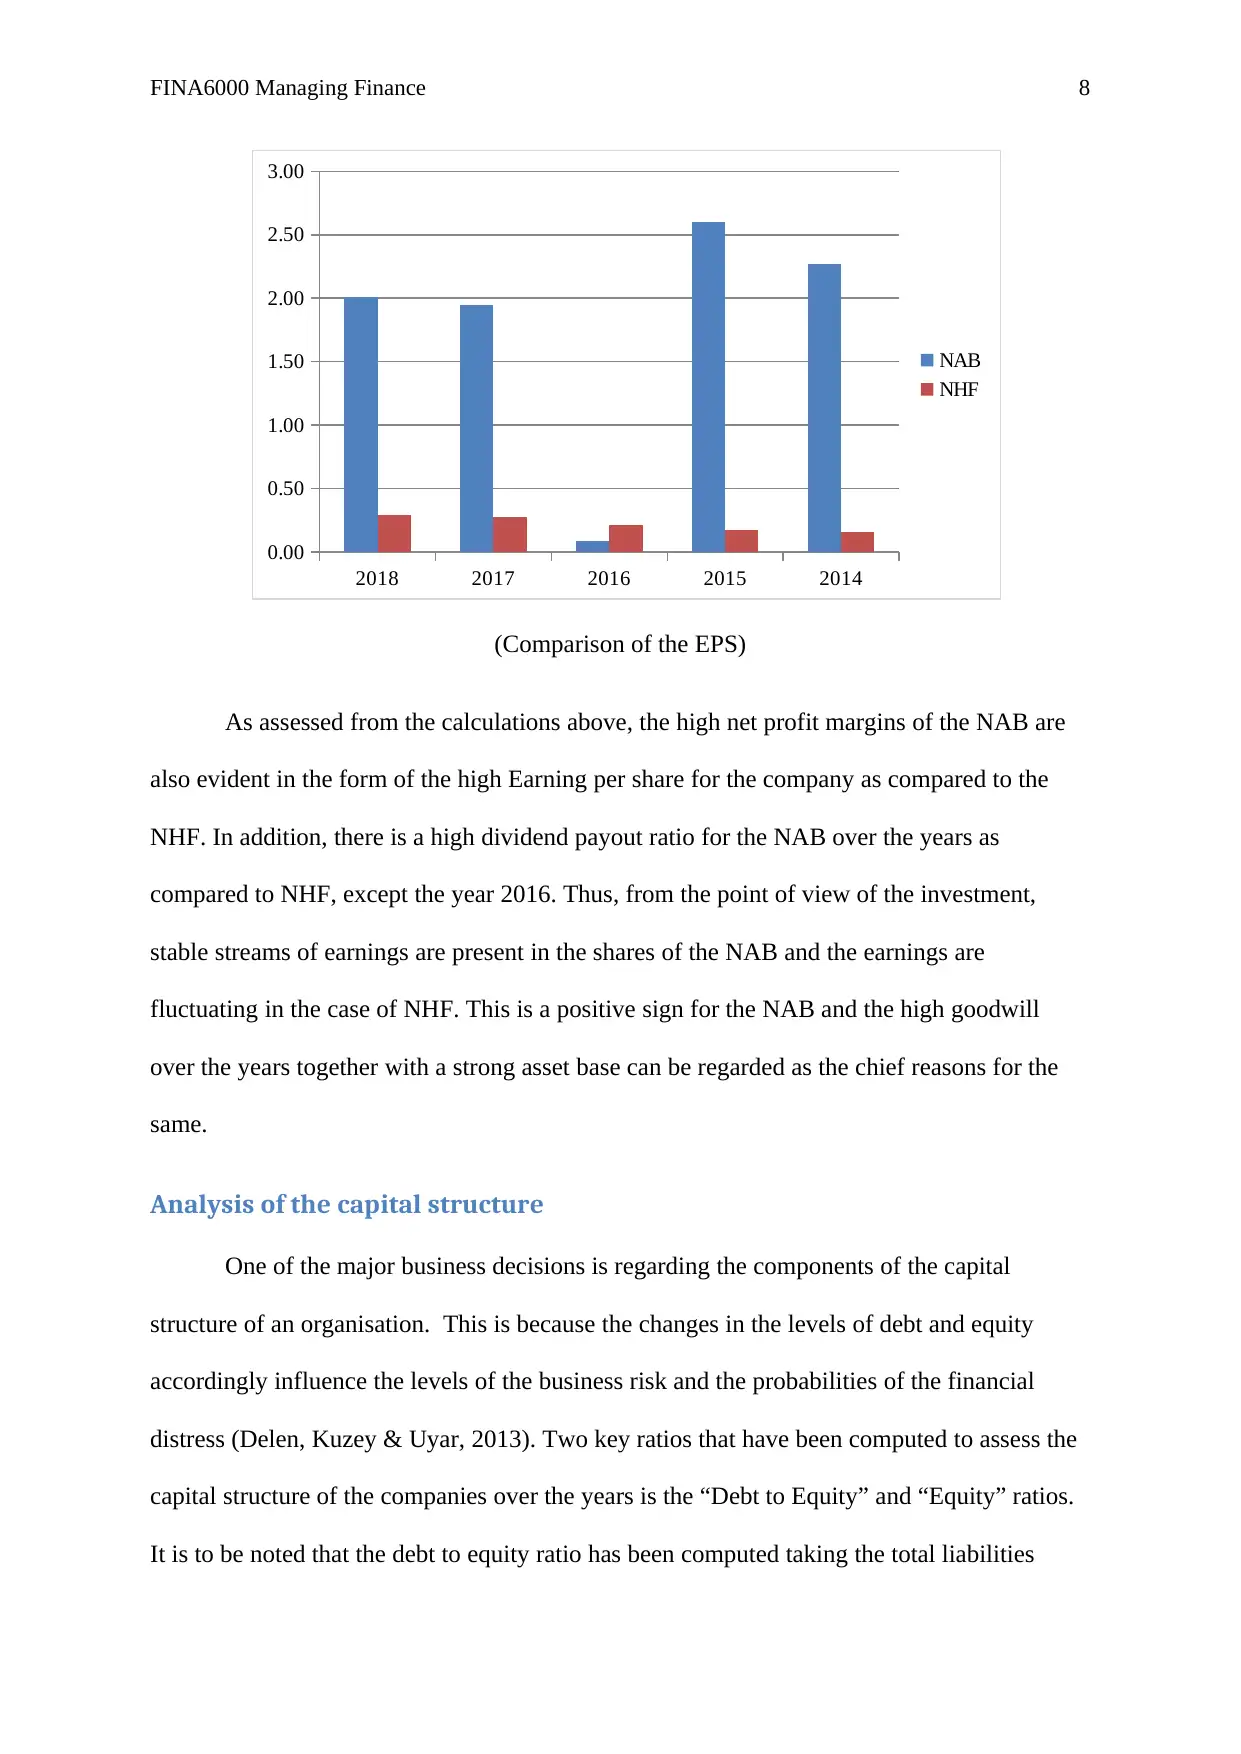
(Comparison of the EPS)
As assessed from the calculations above, the high net profit margins of the NAB are
also evident in the form of the high Earning per share for the company as compared to the
NHF. In addition, there is a high dividend payout ratio for the NAB over the years as
compared to NHF, except the year 2016. Thus, from the point of view of the investment,
stable streams of earnings are present in the shares of the NAB and the earnings are
fluctuating in the case of NHF. This is a positive sign for the NAB and the high goodwill
over the years together with a strong asset base can be regarded as the chief reasons for the
same.
Analysis of the capital structure
One of the major business decisions is regarding the components of the capital
structure of an organisation. This is because the changes in the levels of debt and equity
accordingly influence the levels of the business risk and the probabilities of the financial
distress (Delen, Kuzey & Uyar, 2013). Two key ratios that have been computed to assess the
capital structure of the companies over the years is the “Debt to Equity” and “Equity” ratios.
It is to be noted that the debt to equity ratio has been computed taking the total liabilities
2018 2017 2016 2015 2014
0.00
0.50
1.00
1.50
2.00
2.50
3.00
NAB
NHF
⊘ This is a preview!⊘
Do you want full access?
Subscribe today to unlock all pages.
Trusted by 1+ million students worldwide
FINA6000 Managing Finance 9
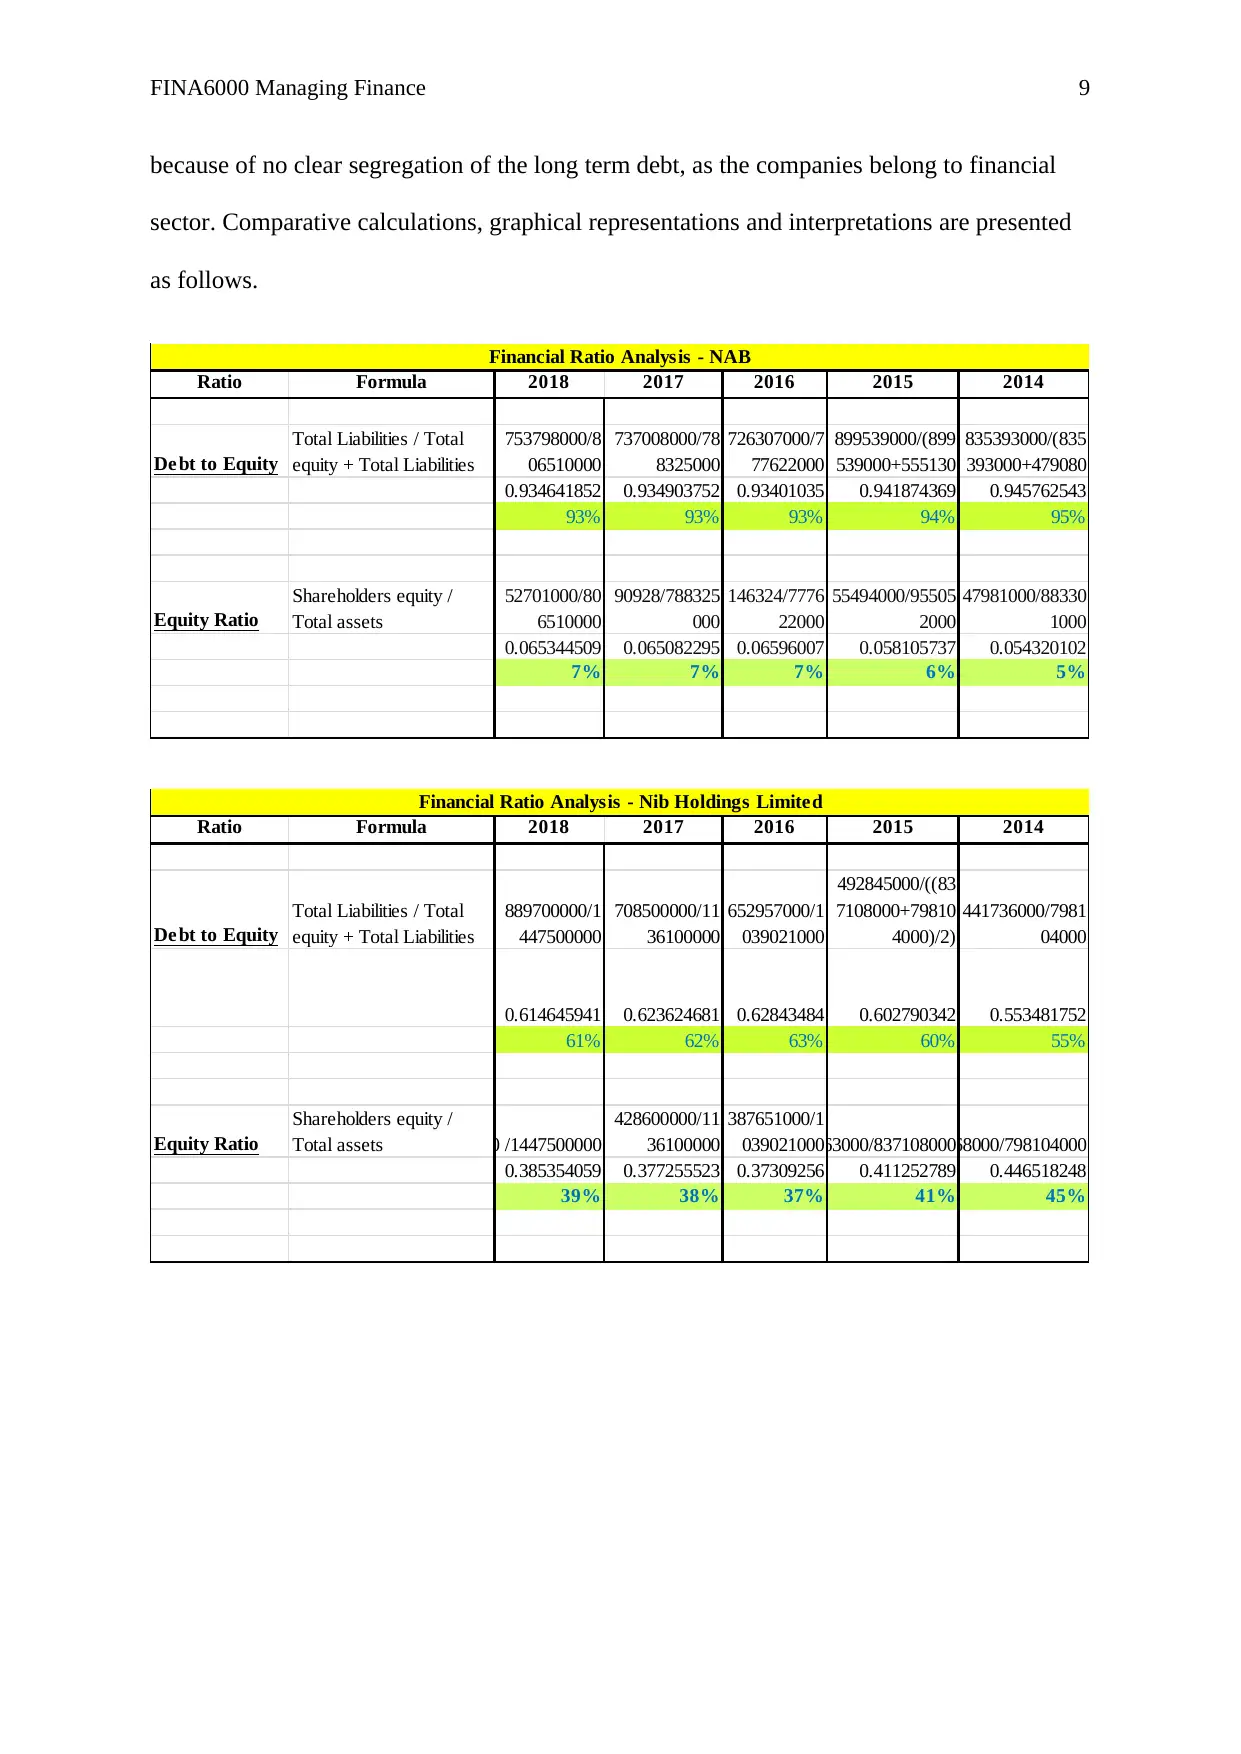
because of no clear segregation of the long term debt, as the companies belong to financial
sector. Comparative calculations, graphical representations and interpretations are presented
as follows.
Ratio Formula 2018 2017 2016 2015 2014
Debt to Equity
Total Liabilities / Total
equity + Total Liabilities
753798000/8
06510000
737008000/78
8325000
726307000/7
77622000
899539000/(899
539000+555130
835393000/(835
393000+479080
0.934641852 0.934903752 0.93401035 0.941874369 0.945762543
93% 93% 93% 94% 95%
Equity Ratio
Shareholders equity /
Total assets
52701000/80
6510000
90928/788325
000
146324/7776
22000
55494000/95505
2000
47981000/88330
1000
0.065344509 0.065082295 0.06596007 0.058105737 0.054320102
7% 7% 7% 6% 5%
Financial Ratio Analysis - NAB
Ratio Formula 2018 2017 2016 2015 2014
Debt to Equity
Total Liabilities / Total
equity + Total Liabilities
889700000/1
447500000
708500000/11
36100000
652957000/1
039021000
492845000/((83
7108000+79810
4000)/2)
441736000/7981
04000
0.614645941 0.623624681 0.62843484 0.602790342 0.553481752
61% 62% 63% 60% 55%
Equity Ratio
Shareholders equity /
Total assets 557800000 /1447500000
428600000/11
36100000
387651000/1
039021000344263000/837108000356368000/798104000
0.385354059 0.377255523 0.37309256 0.411252789 0.446518248
39% 38% 37% 41% 45%
Financial Ratio Analysis - Nib Holdings Limited
Paraphrase This Document
Need a fresh take? Get an instant paraphrase of this document with our AI Paraphraser
FINA6000 Managing Finance 10
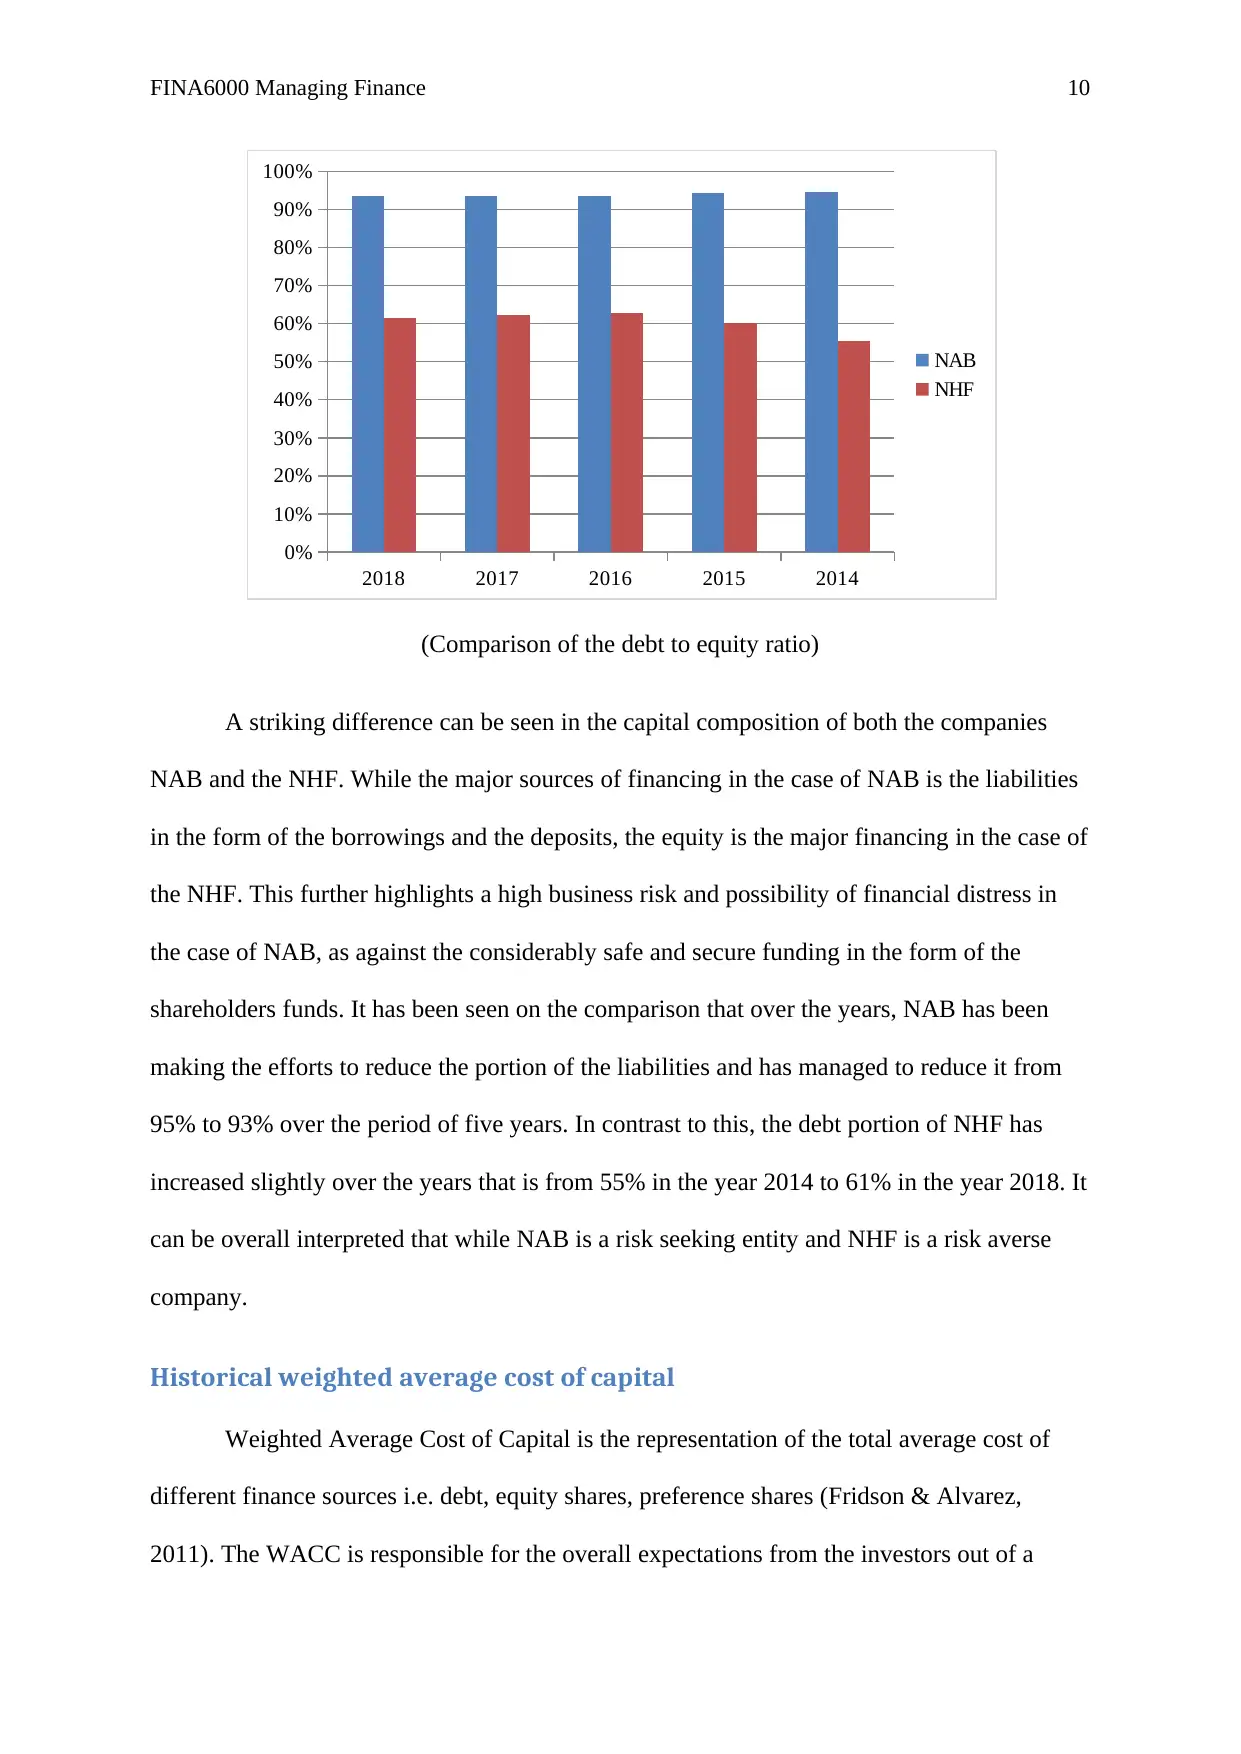
(Comparison of the debt to equity ratio)
A striking difference can be seen in the capital composition of both the companies
NAB and the NHF. While the major sources of financing in the case of NAB is the liabilities
in the form of the borrowings and the deposits, the equity is the major financing in the case of
the NHF. This further highlights a high business risk and possibility of financial distress in
the case of NAB, as against the considerably safe and secure funding in the form of the
shareholders funds. It has been seen on the comparison that over the years, NAB has been
making the efforts to reduce the portion of the liabilities and has managed to reduce it from
95% to 93% over the period of five years. In contrast to this, the debt portion of NHF has
increased slightly over the years that is from 55% in the year 2014 to 61% in the year 2018. It
can be overall interpreted that while NAB is a risk seeking entity and NHF is a risk averse
company.
Historical weighted average cost of capital
Weighted Average Cost of Capital is the representation of the total average cost of
different finance sources i.e. debt, equity shares, preference shares (Fridson & Alvarez,
2011). The WACC is responsible for the overall expectations from the investors out of a
2018 2017 2016 2015 2014
0%
10%
20%
30%
40%
50%
60%
70%
80%
90%
100%
NAB
NHF
FINA6000 Managing Finance 11
business and thus the demand and supply of the shares tend to move with the expectations
(Ross, et. al, 2014). The rate is significant in the case of the investment appraisal evaluations.
The computation is based on either the book value weights of the sources of finance or the
market value weights (Pogue, 2010). The first step calls for the determination of the effective
rate of return of every source of finance. The second step calls for the apportionment of
weights to the respective rates as determined in the first step. The formula for the same can be
expressed as follows.
K = Ke(V e / ¿+V d ) + Kd(V d / ¿+V d)
Where,
K = WACC
V e= Book value weight of equity
V d = Book value weight of debt
Ke= Cost of equity
Kd= After tax cost of debt
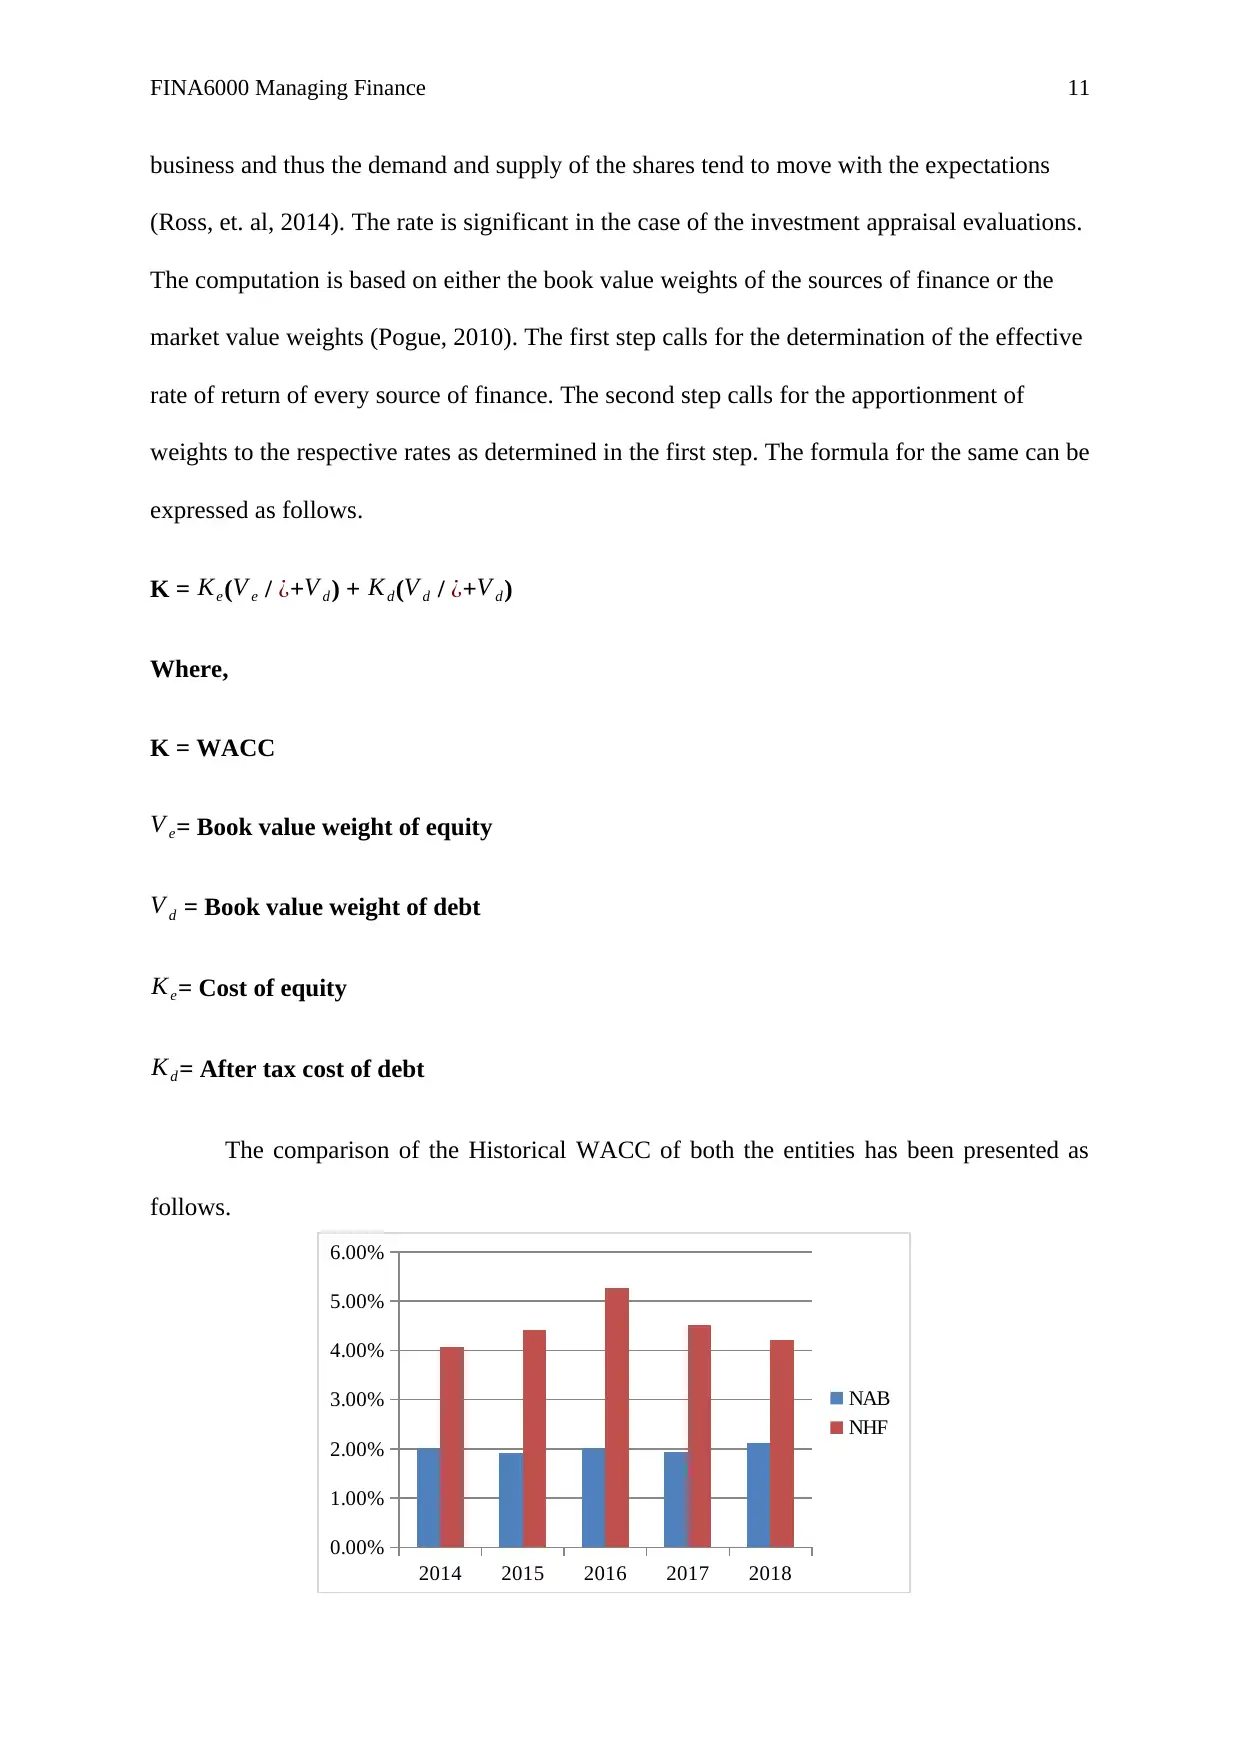
The comparison of the Historical WACC of both the entities has been presented as
follows.
2014 2015 2016 2017 2018
0.00%
1.00%
2.00%
3.00%
4.00%
5.00%
6.00%
NAB
NHF
business and thus the demand and supply of the shares tend to move with the expectations
(Ross, et. al, 2014). The rate is significant in the case of the investment appraisal evaluations.
The computation is based on either the book value weights of the sources of finance or the
market value weights (Pogue, 2010). The first step calls for the determination of the effective
rate of return of every source of finance. The second step calls for the apportionment of
weights to the respective rates as determined in the first step. The formula for the same can be
expressed as follows.
K = Ke(V e / ¿+V d ) + Kd(V d / ¿+V d)
Where,
K = WACC
V e= Book value weight of equity
V d = Book value weight of debt
Ke= Cost of equity
Kd= After tax cost of debt
The comparison of the Historical WACC of both the entities has been presented as
follows.
2014 2015 2016 2017 2018
0.00%
1.00%
2.00%
3.00%
4.00%
5.00%
6.00%
NAB
NHF
⊘ This is a preview!⊘
Do you want full access?
Subscribe today to unlock all pages.
Trusted by 1+ million students worldwide
1 out of 17
Related Documents


Your All-in-One AI-Powered Toolkit for Academic Success.
+13062052269
info@desklib.com
Available 24*7 on WhatsApp / Email
![[object Object]](/_next/static/media/star-bottom.7253800d.svg)
Unlock your academic potential
Copyright © 2020–2026 A2Z Services. All Rights Reserved. Developed and managed by ZUCOL.