Accounting and Finance: ACC System and Processes Homework Analysis
VerifiedAdded on 2021/05/31
|25
|3510
|82
Homework Assignment
AI Summary
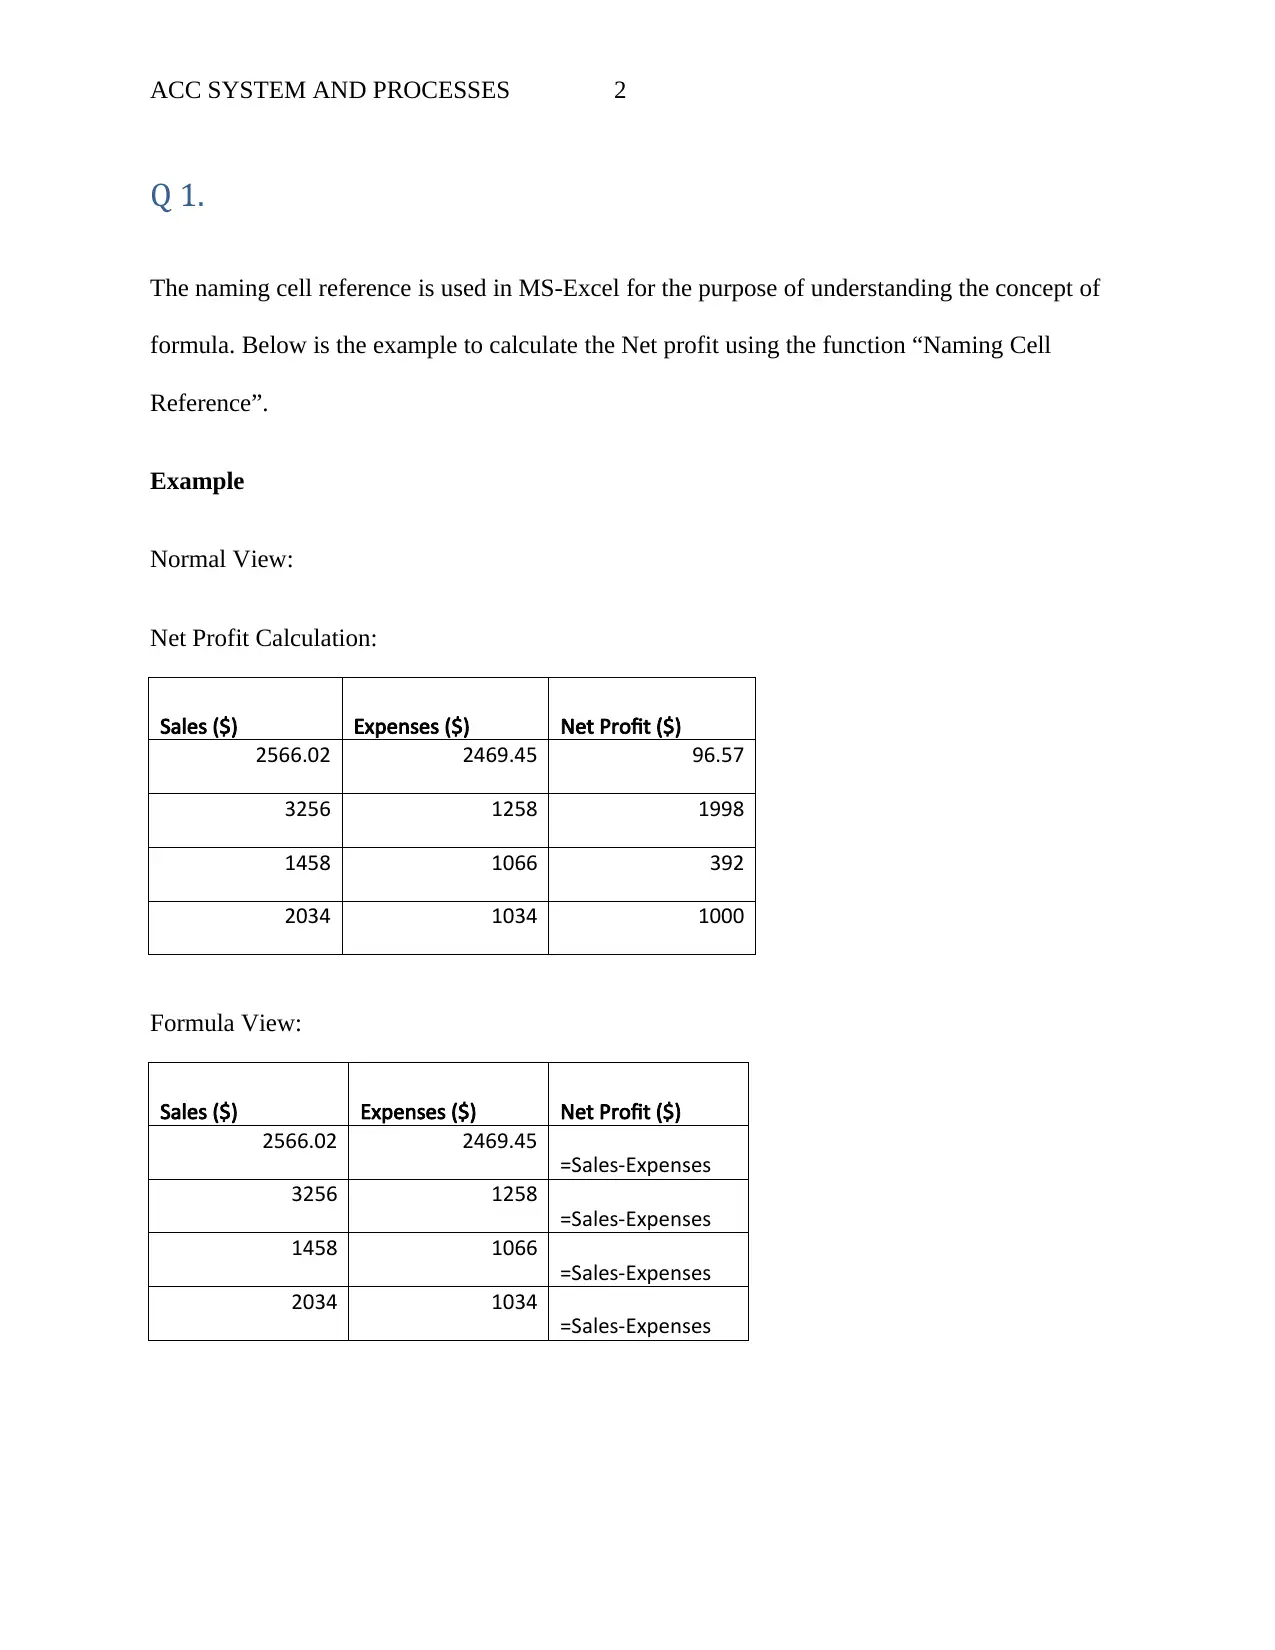
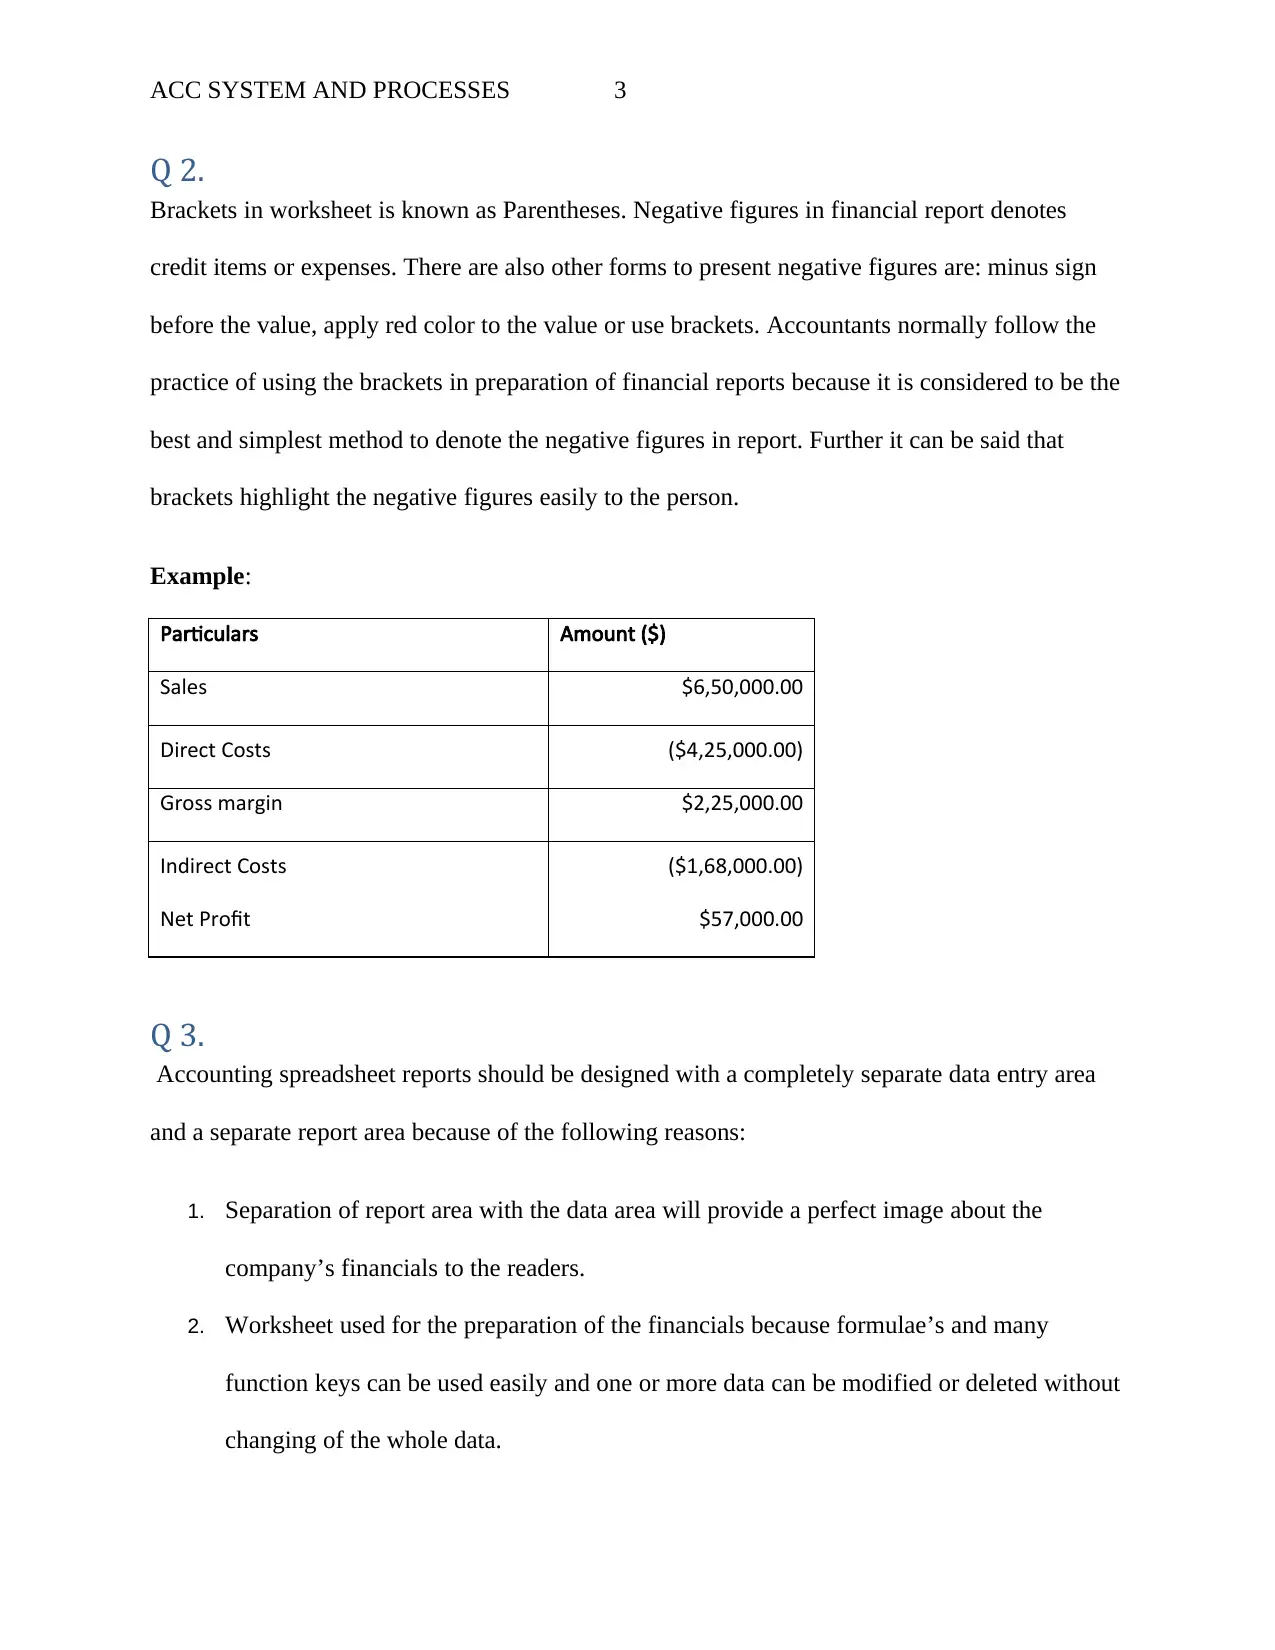
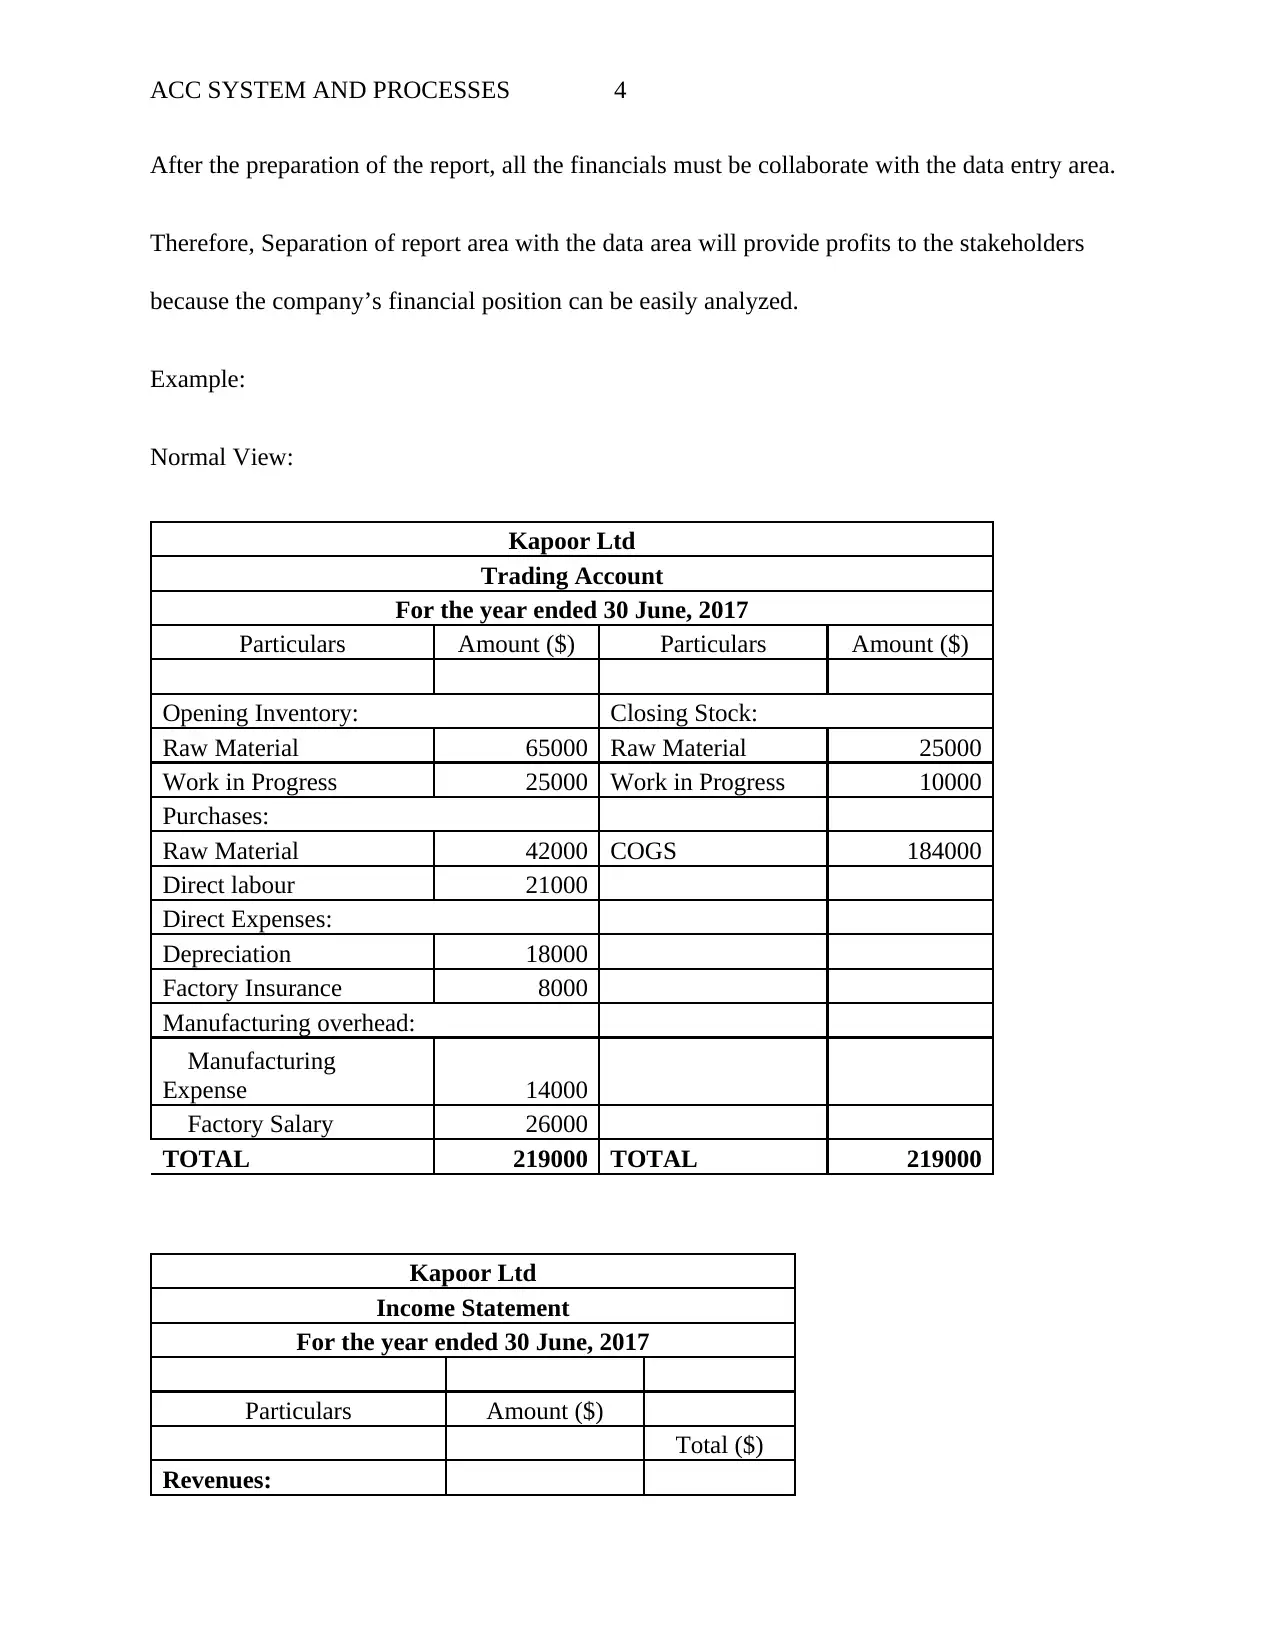
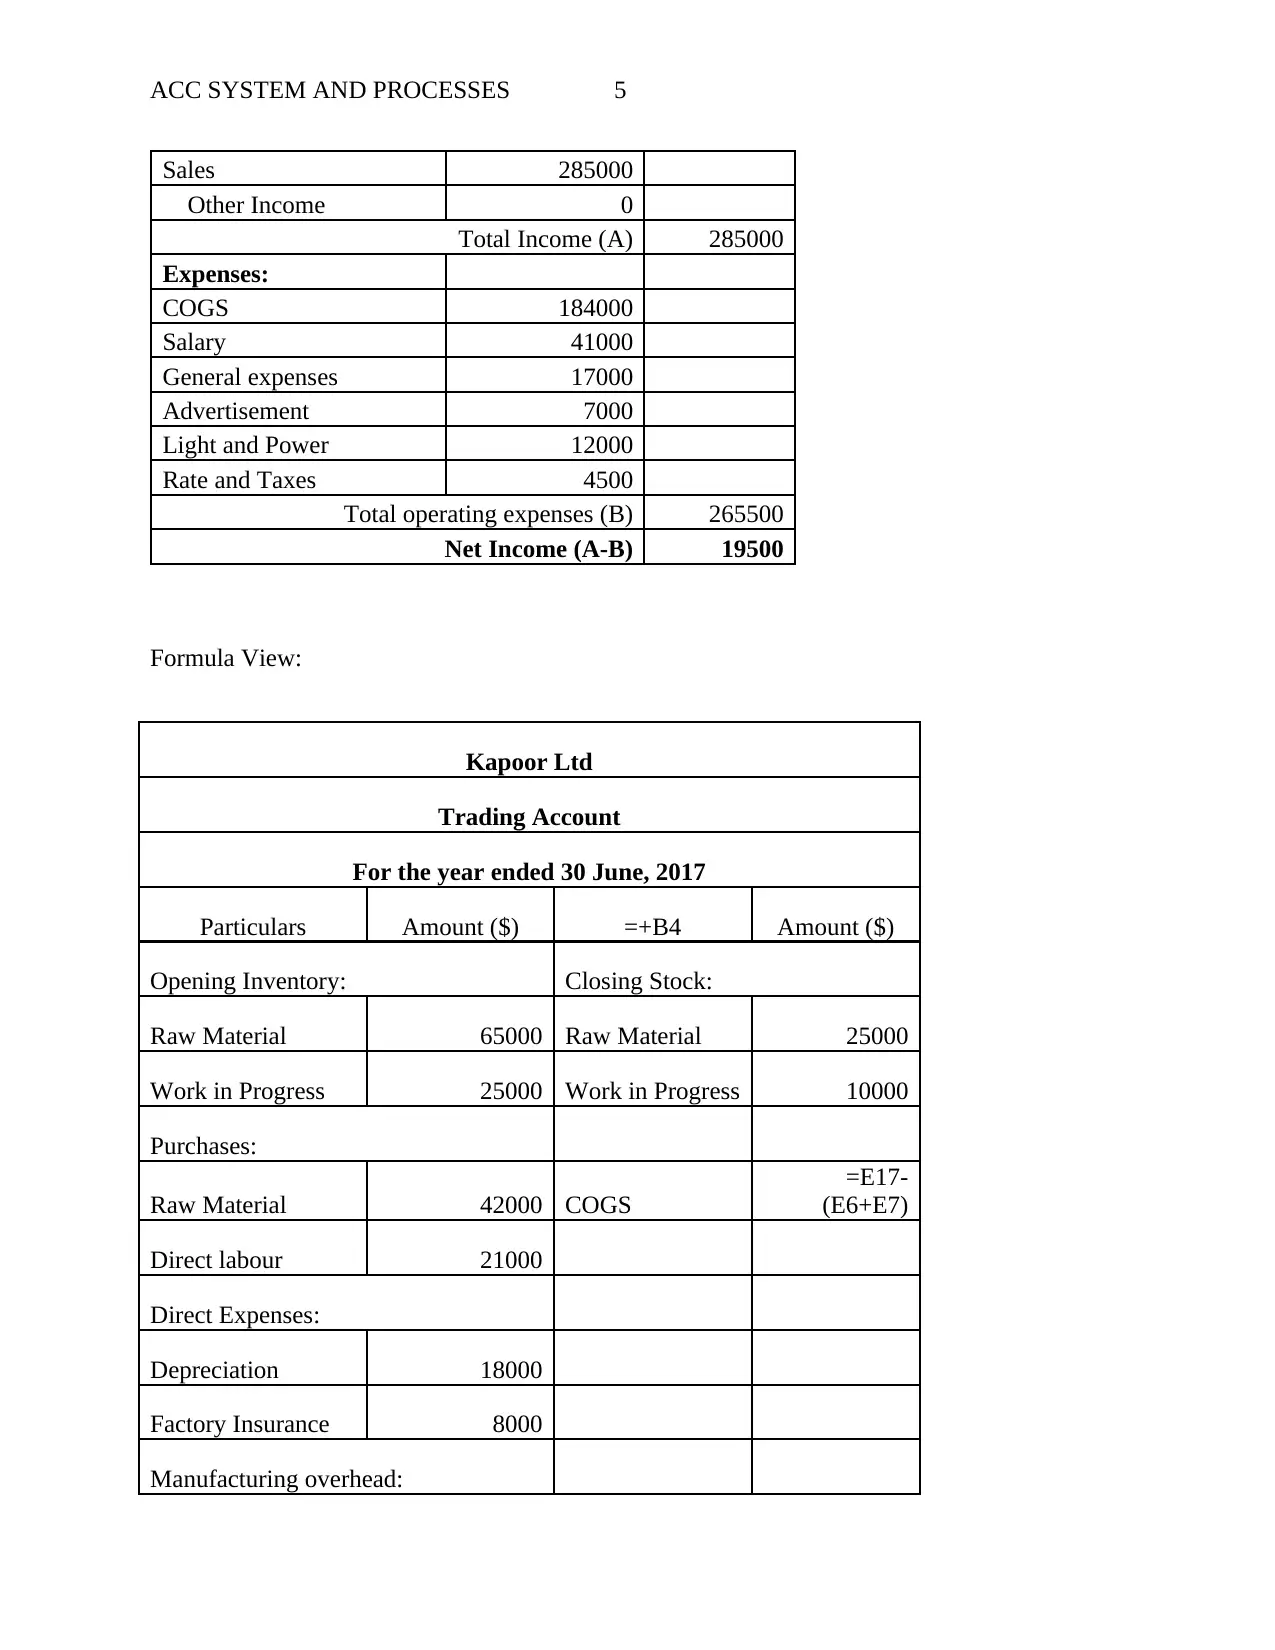
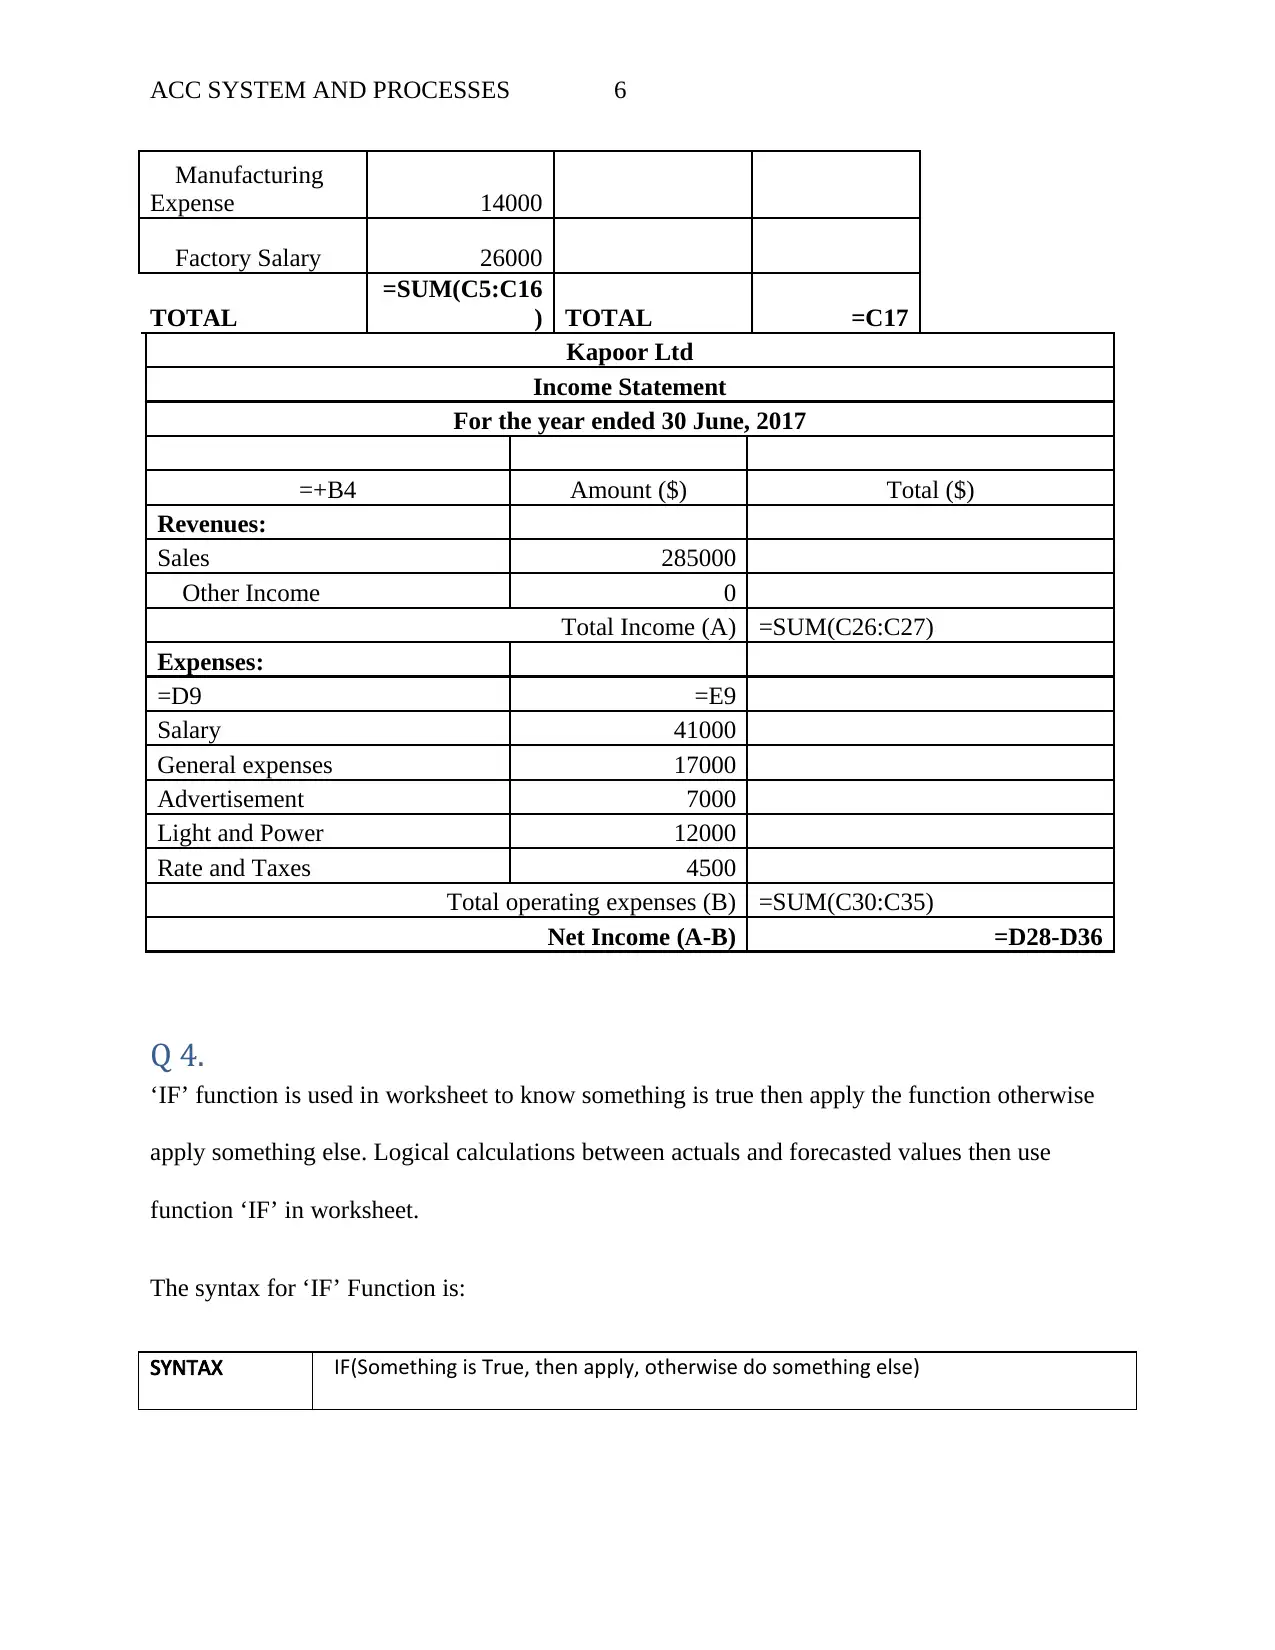
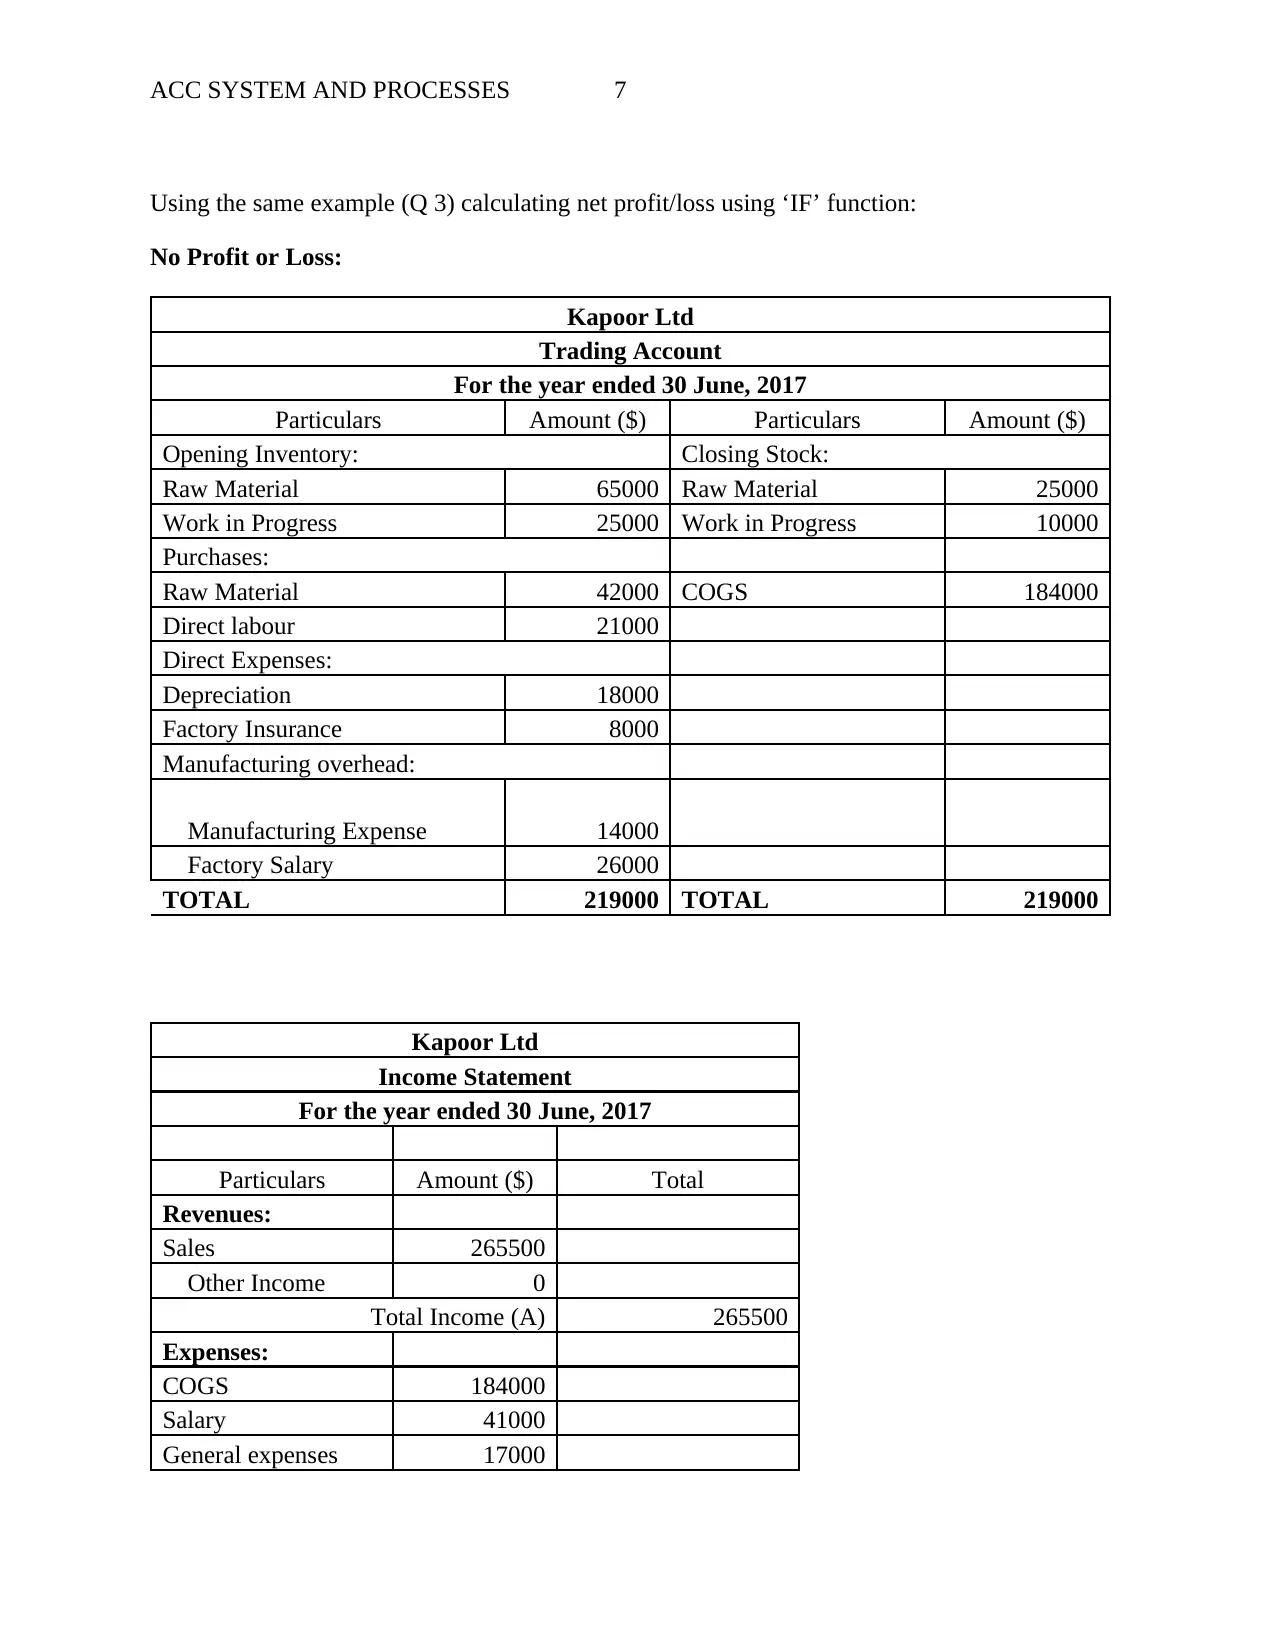
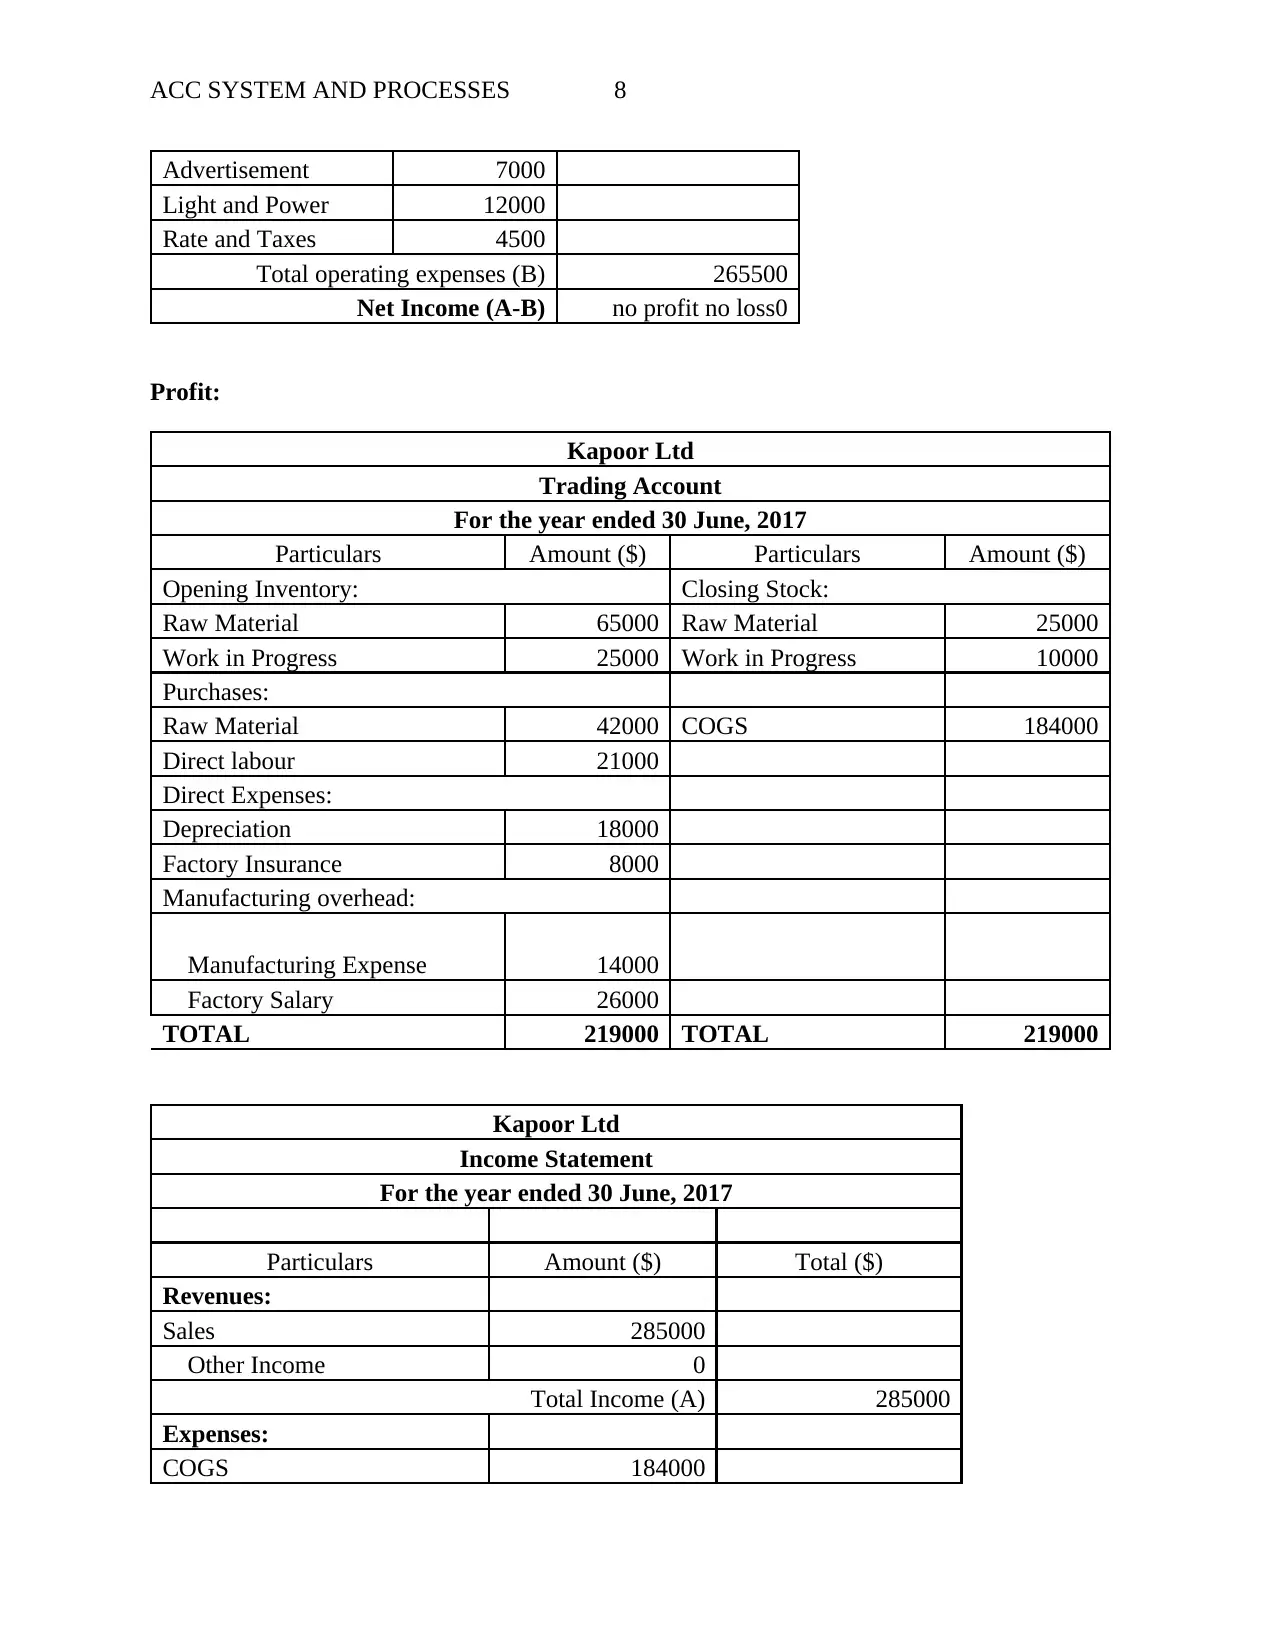
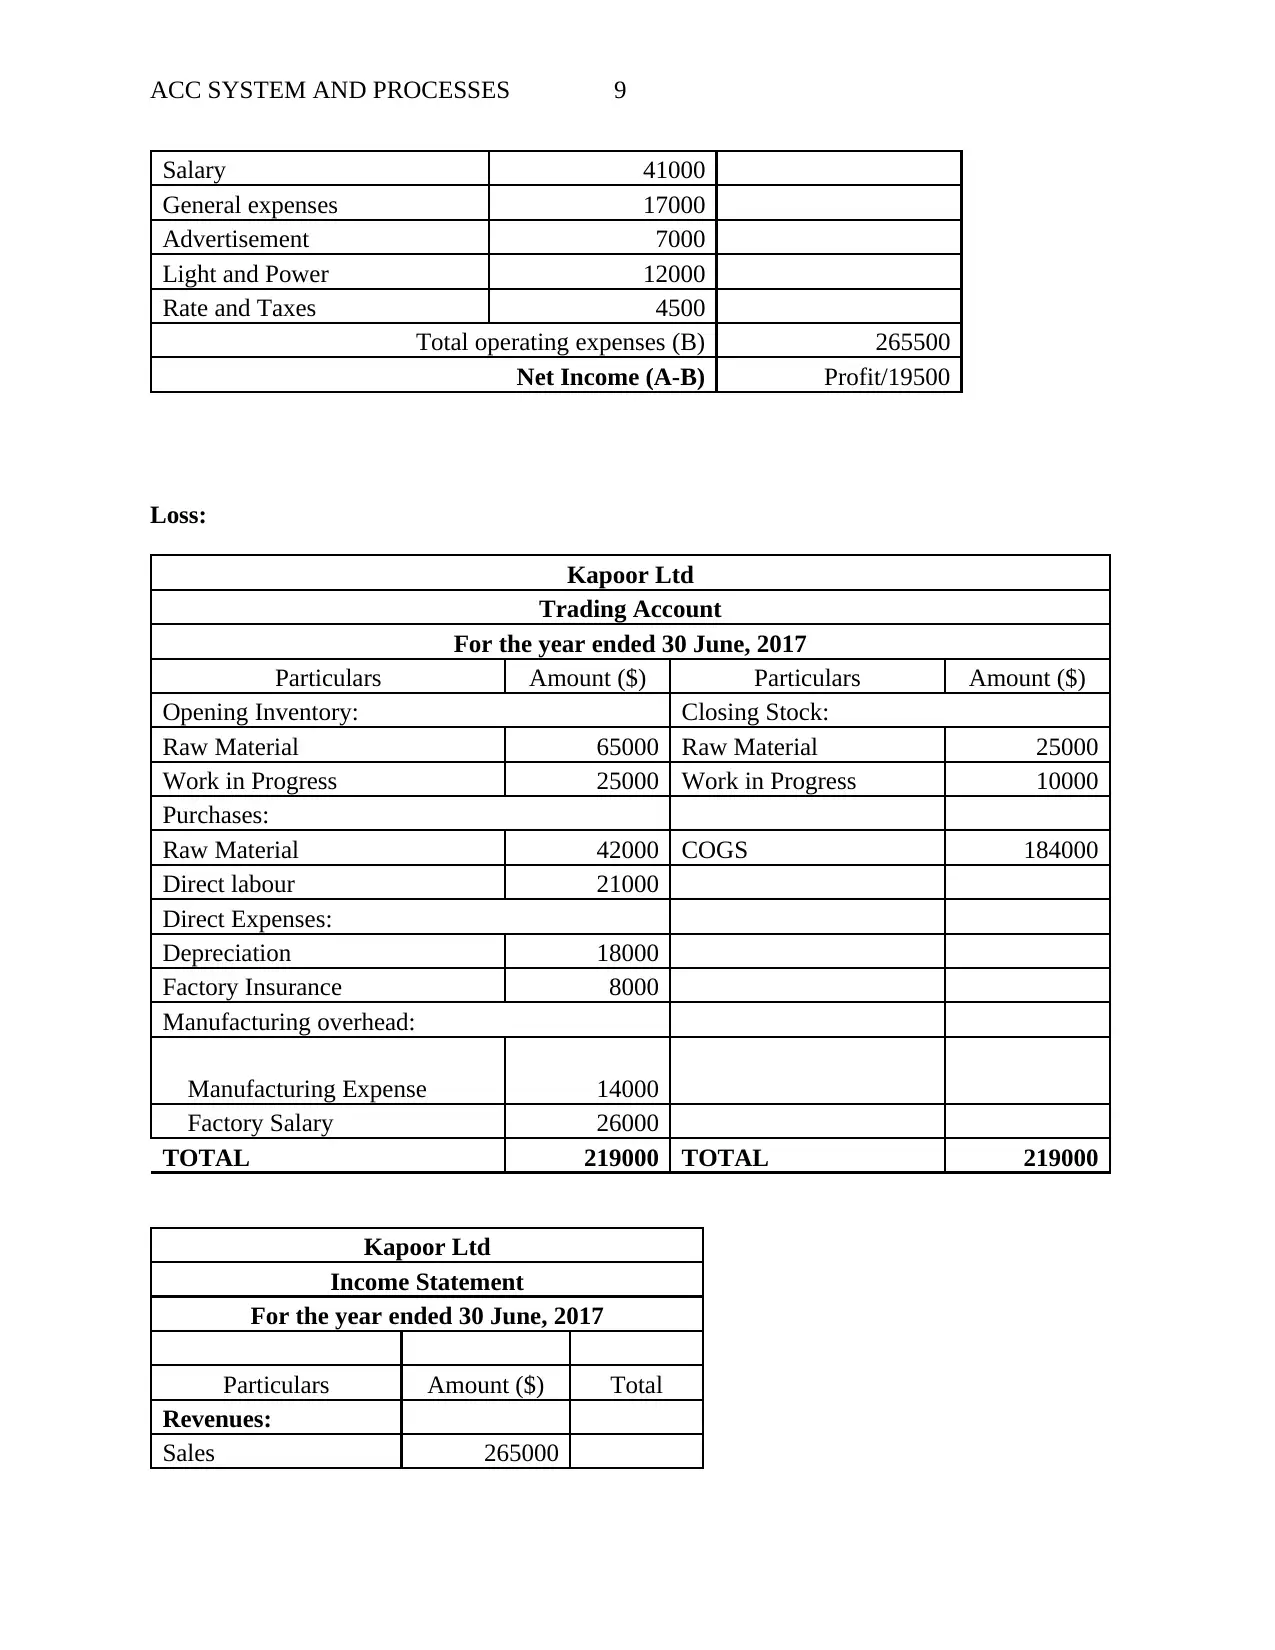
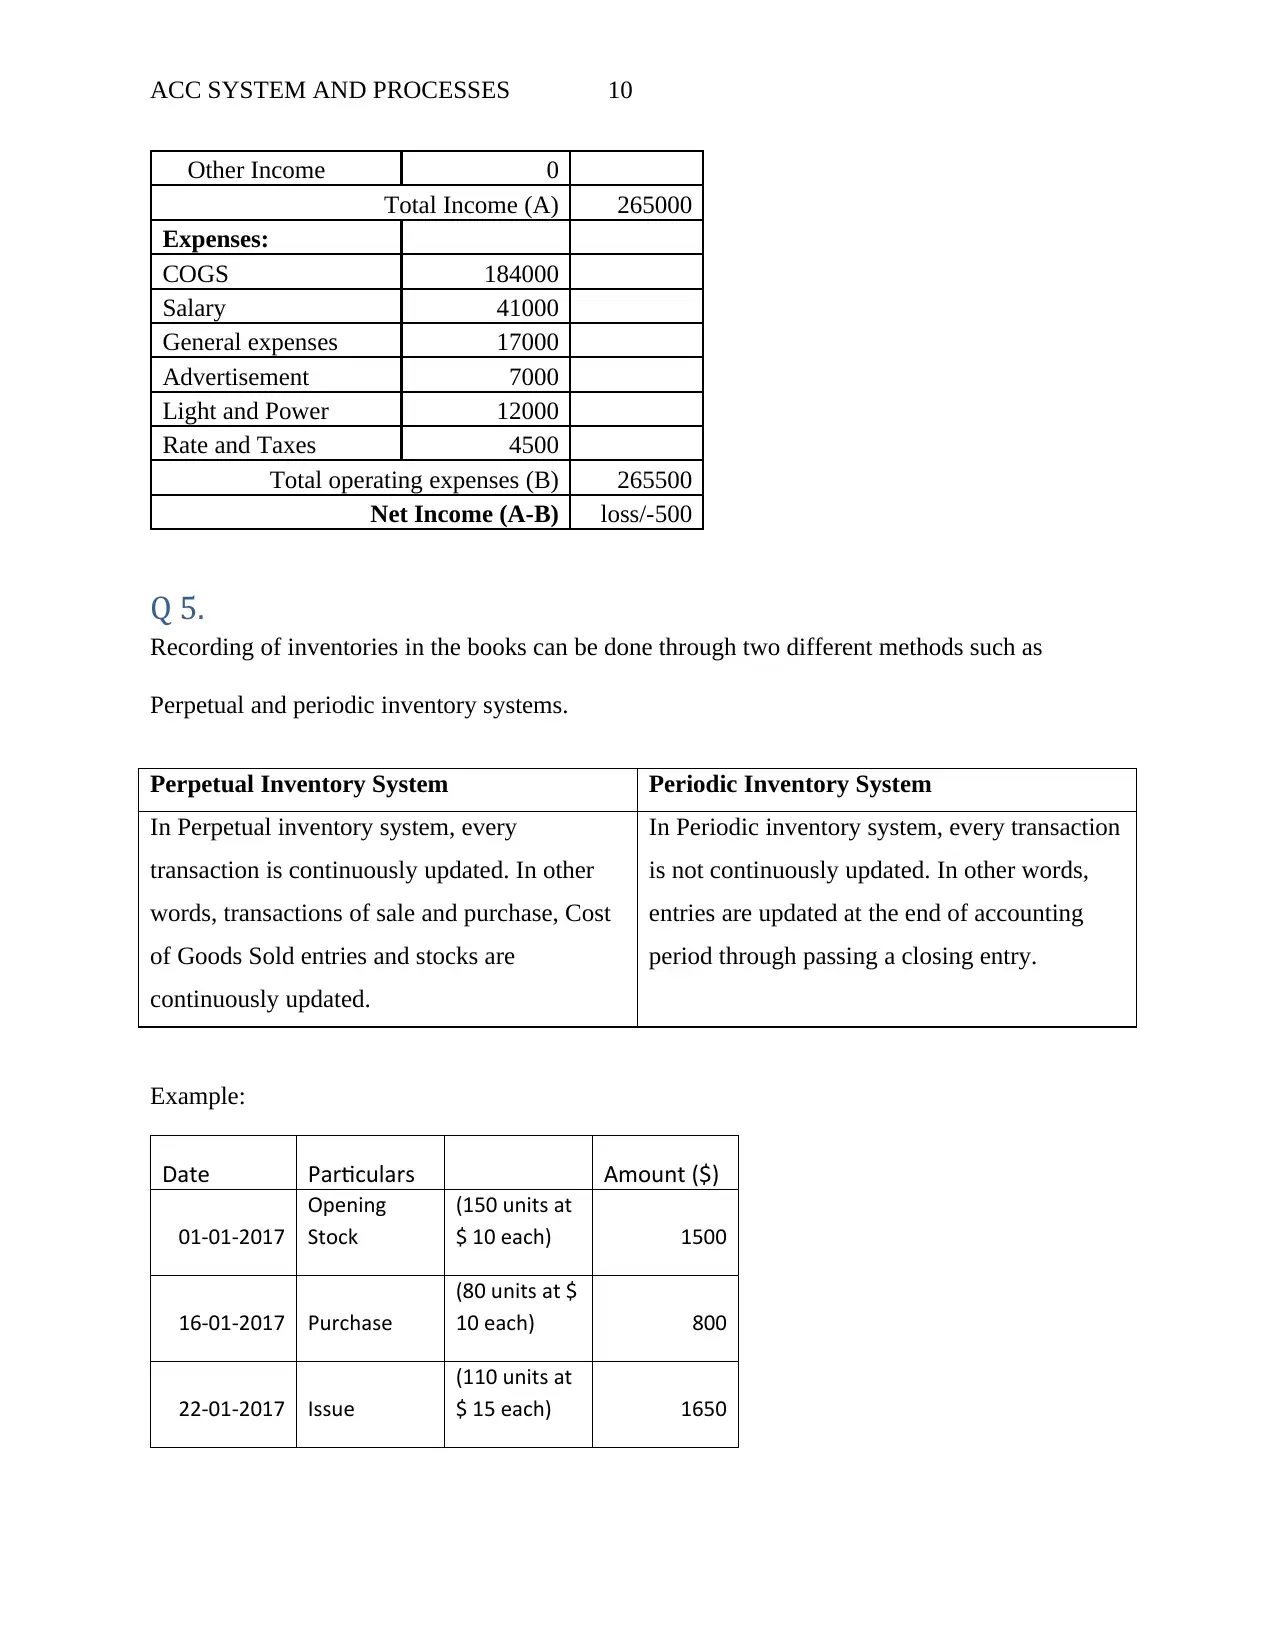
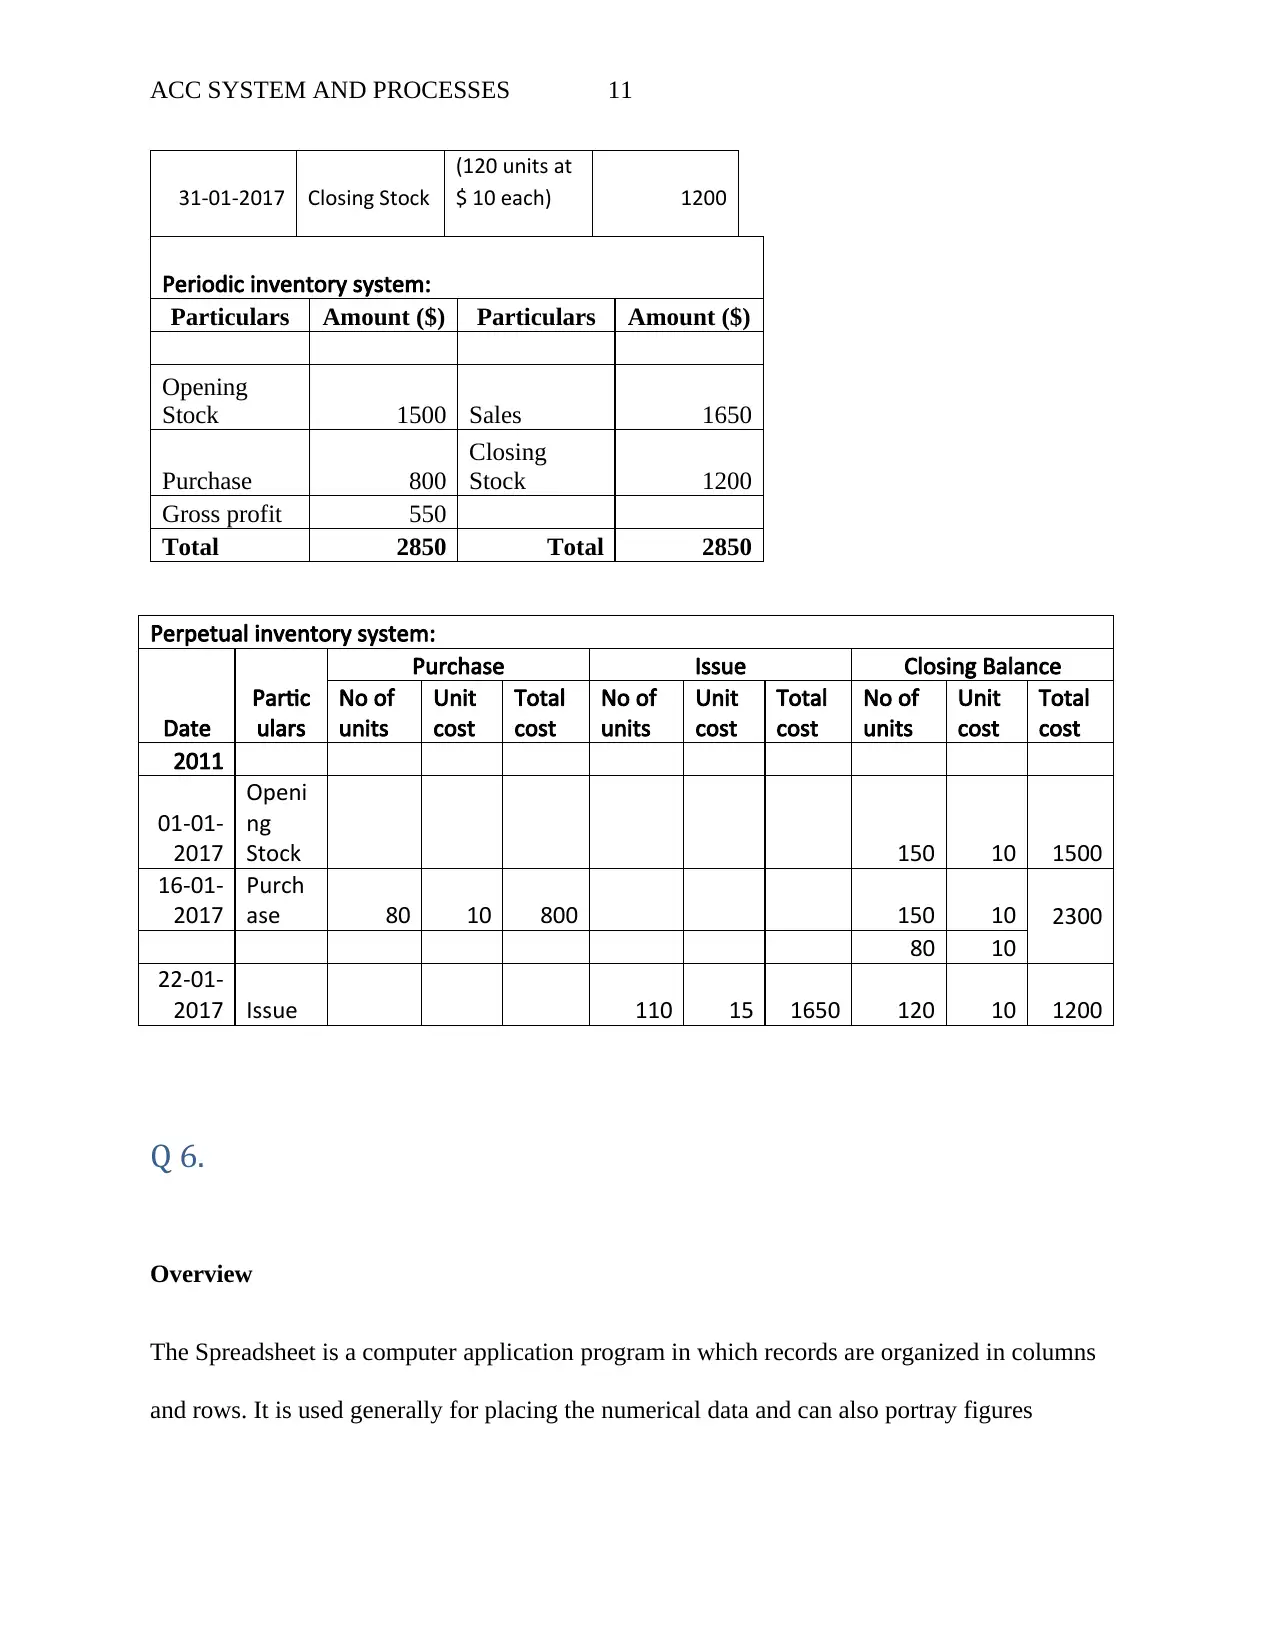
This homework assignment delves into accounting systems and processes, utilizing Microsoft Excel for financial analysis and reporting. The solution begins by explaining naming cell references and their application in calculating net profit. It then addresses the use of parentheses to denote negative figures in financial reports. The assignment further explores the benefits of separating data entry and report areas in accounting spreadsheets, including a detailed example of trading and income statements. The 'IF' function is demonstrated through a net profit/loss calculation. The solution also contrasts perpetual and periodic inventory systems, providing examples. Advantages and disadvantages of using spreadsheets in accounting are outlined, emphasizing accuracy and automation. Finally, the assignment covers inventory valuation methods, specifically average cost, FIFO (First-In, First-Out), and LIFO (Last-In, First-Out), with calculations for cost of goods sold and closing inventory values.

RUNNING HEAD: ACC SYSTEM AND PROCESSES
Acc system AND PROCESSEs
Paraphrase This Document
Need a fresh take? Get an instant paraphrase of this document with our AI Paraphraser

ACC SYSTEM AND PROCESSES 1
Table of Contents
Q 1...............................................................................................................................................................2
Q 2...............................................................................................................................................................3
Q 3...............................................................................................................................................................3
Q 4...............................................................................................................................................................6
Q 5.............................................................................................................................................................10
Q 6.............................................................................................................................................................11
Q 7.............................................................................................................................................................12
Average Cost Method:.......................................................................................................................12
First in First Out (FIFO):......................................................................................................................14
Last in First Out (LIFO):......................................................................................................................15
Q 8.............................................................................................................................................................16
Q 9.............................................................................................................................................................18
Q 10...........................................................................................................................................................19
Q 11...........................................................................................................................................................20
Q 12...........................................................................................................................................................21
Q 13...........................................................................................................................................................22

ACC SYSTEM AND PROCESSES 2
Q 1.
The naming cell reference is used in MS-Excel for the purpose of understanding the concept of
formula. Below is the example to calculate the Net profit using the function “Naming Cell
Reference”.
Example
Normal View:
Net Profit Calculation:
Sales ($) Expenses ($) Net Profit ($)
2566.02 2469.45 96.57
3256 1258 1998
1458 1066 392
2034 1034 1000
Formula View:
Sales ($) Expenses ($) Net Profit ($)
2566.02 2469.45
=Sales-Expenses
3256 1258
=Sales-Expenses
1458 1066
=Sales-Expenses
2034 1034
=Sales-Expenses
⊘ This is a preview!⊘
Do you want full access?
Subscribe today to unlock all pages.

Trusted by 1+ million students worldwide

ACC SYSTEM AND PROCESSES 3
Q 2.
Brackets in worksheet is known as Parentheses. Negative figures in financial report denotes
credit items or expenses. There are also other forms to present negative figures are: minus sign
before the value, apply red color to the value or use brackets. Accountants normally follow the
practice of using the brackets in preparation of financial reports because it is considered to be the
best and simplest method to denote the negative figures in report. Further it can be said that
brackets highlight the negative figures easily to the person.
Example:
Particulars Amount ($)
Sales $6,50,000.00
Direct Costs ($4,25,000.00)
Gross margin $2,25,000.00
Indirect Costs ($1,68,000.00)
Net Profit $57,000.00
Q 3.
Accounting spreadsheet reports should be designed with a completely separate data entry area
and a separate report area because of the following reasons:
1. Separation of report area with the data area will provide a perfect image about the
company’s financials to the readers.
2. Worksheet used for the preparation of the financials because formulae’s and many
function keys can be used easily and one or more data can be modified or deleted without
changing of the whole data.
Paraphrase This Document
Need a fresh take? Get an instant paraphrase of this document with our AI Paraphraser

ACC SYSTEM AND PROCESSES 4
After the preparation of the report, all the financials must be collaborate with the data entry area.
Therefore, Separation of report area with the data area will provide profits to the stakeholders
because the company’s financial position can be easily analyzed.
Example:
Normal View:
Kapoor Ltd
Trading Account
For the year ended 30 June, 2017
Particulars Amount ($) Particulars Amount ($)
Opening Inventory: Closing Stock:
Raw Material 65000 Raw Material 25000
Work in Progress 25000 Work in Progress 10000
Purchases:
Raw Material 42000 COGS 184000
Direct labour 21000
Direct Expenses:
Depreciation 18000
Factory Insurance 8000
Manufacturing overhead:
Manufacturing
Expense 14000
Factory Salary 26000
TOTAL 219000 TOTAL 219000
Kapoor Ltd
Income Statement
For the year ended 30 June, 2017
Particulars Amount ($)
Total ($)
Revenues:

ACC SYSTEM AND PROCESSES 5
Sales 285000
Other Income 0
Total Income (A) 285000
Expenses:
COGS 184000
Salary 41000
General expenses 17000
Advertisement 7000
Light and Power 12000
Rate and Taxes 4500
Total operating expenses (B) 265500
Net Income (A-B) 19500
Formula View:
Kapoor Ltd
Trading Account
For the year ended 30 June, 2017
Particulars Amount ($) =+B4 Amount ($)
Opening Inventory: Closing Stock:
Raw Material 65000 Raw Material 25000
Work in Progress 25000 Work in Progress 10000
Purchases:
Raw Material 42000 COGS
=E17-
(E6+E7)
Direct labour 21000
Direct Expenses:
Depreciation 18000
Factory Insurance 8000
Manufacturing overhead:
⊘ This is a preview!⊘
Do you want full access?
Subscribe today to unlock all pages.

Trusted by 1+ million students worldwide

ACC SYSTEM AND PROCESSES 6
Manufacturing
Expense 14000
Factory Salary 26000
TOTAL
=SUM(C5:C16
) TOTAL =C17
Kapoor Ltd
Income Statement
For the year ended 30 June, 2017
=+B4 Amount ($) Total ($)
Revenues:
Sales 285000
Other Income 0
Total Income (A) =SUM(C26:C27)
Expenses:
=D9 =E9
Salary 41000
General expenses 17000
Advertisement 7000
Light and Power 12000
Rate and Taxes 4500
Total operating expenses (B) =SUM(C30:C35)
Net Income (A-B) =D28-D36
Q 4.
‘IF’ function is used in worksheet to know something is true then apply the function otherwise
apply something else. Logical calculations between actuals and forecasted values then use
function ‘IF’ in worksheet.
The syntax for ‘IF’ Function is:
SYNTAX IF(Something is True, then apply, otherwise do something else)
Paraphrase This Document
Need a fresh take? Get an instant paraphrase of this document with our AI Paraphraser

ACC SYSTEM AND PROCESSES 7
Using the same example (Q 3) calculating net profit/loss using ‘IF’ function:
No Profit or Loss:
Kapoor Ltd
Trading Account
For the year ended 30 June, 2017
Particulars Amount ($) Particulars Amount ($)
Opening Inventory: Closing Stock:
Raw Material 65000 Raw Material 25000
Work in Progress 25000 Work in Progress 10000
Purchases:
Raw Material 42000 COGS 184000
Direct labour 21000
Direct Expenses:
Depreciation 18000
Factory Insurance 8000
Manufacturing overhead:
Manufacturing Expense 14000
Factory Salary 26000
TOTAL 219000 TOTAL 219000
Kapoor Ltd
Income Statement
For the year ended 30 June, 2017
Particulars Amount ($) Total
Revenues:
Sales 265500
Other Income 0
Total Income (A) 265500
Expenses:
COGS 184000
Salary 41000
General expenses 17000

ACC SYSTEM AND PROCESSES 8
Advertisement 7000
Light and Power 12000
Rate and Taxes 4500
Total operating expenses (B) 265500
Net Income (A-B) no profit no loss0
Profit:
Kapoor Ltd
Trading Account
For the year ended 30 June, 2017
Particulars Amount ($) Particulars Amount ($)
Opening Inventory: Closing Stock:
Raw Material 65000 Raw Material 25000
Work in Progress 25000 Work in Progress 10000
Purchases:
Raw Material 42000 COGS 184000
Direct labour 21000
Direct Expenses:
Depreciation 18000
Factory Insurance 8000
Manufacturing overhead:
Manufacturing Expense 14000
Factory Salary 26000
TOTAL 219000 TOTAL 219000
Kapoor Ltd
Income Statement
For the year ended 30 June, 2017
Particulars Amount ($) Total ($)
Revenues:
Sales 285000
Other Income 0
Total Income (A) 285000
Expenses:
COGS 184000
⊘ This is a preview!⊘
Do you want full access?
Subscribe today to unlock all pages.

Trusted by 1+ million students worldwide

ACC SYSTEM AND PROCESSES 9
Salary 41000
General expenses 17000
Advertisement 7000
Light and Power 12000
Rate and Taxes 4500
Total operating expenses (B) 265500
Net Income (A-B) Profit/19500
Loss:
Kapoor Ltd
Trading Account
For the year ended 30 June, 2017
Particulars Amount ($) Particulars Amount ($)
Opening Inventory: Closing Stock:
Raw Material 65000 Raw Material 25000
Work in Progress 25000 Work in Progress 10000
Purchases:
Raw Material 42000 COGS 184000
Direct labour 21000
Direct Expenses:
Depreciation 18000
Factory Insurance 8000
Manufacturing overhead:
Manufacturing Expense 14000
Factory Salary 26000
TOTAL 219000 TOTAL 219000
Kapoor Ltd
Income Statement
For the year ended 30 June, 2017
Particulars Amount ($) Total
Revenues:
Sales 265000
Paraphrase This Document
Need a fresh take? Get an instant paraphrase of this document with our AI Paraphraser

ACC SYSTEM AND PROCESSES 10
Other Income 0
Total Income (A) 265000
Expenses:
COGS 184000
Salary 41000
General expenses 17000
Advertisement 7000
Light and Power 12000
Rate and Taxes 4500
Total operating expenses (B) 265500
Net Income (A-B) loss/-500
Q 5.
Recording of inventories in the books can be done through two different methods such as
Perpetual and periodic inventory systems.
Perpetual Inventory System Periodic Inventory System
In Perpetual inventory system, every
transaction is continuously updated. In other
words, transactions of sale and purchase, Cost
of Goods Sold entries and stocks are
continuously updated.
In Periodic inventory system, every transaction
is not continuously updated. In other words,
entries are updated at the end of accounting
period through passing a closing entry.
Example:
Date Particulars Amount ($)
01-01-2017
Opening
Stock
(150 units at
$ 10 each) 1500
16-01-2017 Purchase
(80 units at $
10 each) 800
22-01-2017 Issue
(110 units at
$ 15 each) 1650

ACC SYSTEM AND PROCESSES 11
31-01-2017 Closing Stock
(120 units at
$ 10 each) 1200
Periodic inventory system:
Particulars Amount ($) Particulars Amount ($)
Opening
Stock 1500 Sales 1650
Purchase 800
Closing
Stock 1200
Gross profit 550
Total 2850 Total 2850
Perpetual inventory system:
Date
Partic
ulars
Purchase Issue Closing Balance
No of
units
Unit
cost
Total
cost
No of
units
Unit
cost
Total
cost
No of
units
Unit
cost
Total
cost
2011
01-01-
2017
Openi
ng
Stock 150 10 1500
16-01-
2017
Purch
ase 80 10 800 150 10 2300
80 10
22-01-
2017 Issue 110 15 1650 120 10 1200
Q 6.
Overview
The Spreadsheet is a computer application program in which records are organized in columns
and rows. It is used generally for placing the numerical data and can also portray figures
⊘ This is a preview!⊘
Do you want full access?
Subscribe today to unlock all pages.

Trusted by 1+ million students worldwide
1 out of 25
Related Documents

Your All-in-One AI-Powered Toolkit for Academic Success.
+13062052269
info@desklib.com
Available 24*7 on WhatsApp / Email
Unlock your academic potential
Copyright © 2020–2025 A2Z Services. All Rights Reserved. Developed and managed by ZUCOL.