HI5002 Finance for Business: AGL and Origin Energy Financial Report
VerifiedAdded on 2023/04/23
|19
|4576
|147
Report
AI Summary
This report provides a comprehensive financial analysis of AGL Energy and Origin Energy, two ASX-listed companies in the Australian energy sector, to advise a wealthy investor. It compares their liquidity and profitability using ratio analysis, examines share price movements over three years, calculates and analyzes their weighted average cost of capital (WACC), and compares their capital structure policies. The analysis reveals AGL's superior profitability, liquidity, and capital structure compared to Origin Energy. Ultimately, the report recommends investing in AGL Energy due to its lower operational and financial risk and its potential for higher financial returns.

1
HI5002: Finance for Business
HI5002: Finance for Business
Paraphrase This Document
Need a fresh take? Get an instant paraphrase of this document with our AI Paraphraser
2
Executive Summary
The underlying report is developed for carrying out financial comparison of the two
selected ASX listed entities operating within the same sector of Australia. The companies
selected for evaluation purpose are AGL and Origin energy operating within the energy sector of
Australia. This is done by evaluation of their liquidity and profitability position which has
revealed that AGL has maintained better profitability and liquidity in comparison to Origin
Energy. Also, it has better weighted average cost of capital and also has maintained better capital
structure in comparison to Origin Energy. As such, it is recommend to the investors to invest
within AGL Energy as it has lower operational and financial risk and is expected to produce
higher financial results in the coming period of time.
3
Contents
Executive Summary.........................................................................................................................2
Introduction......................................................................................................................................4
Part 1: Description of the Companies (Discussion on operation and comparative advantages of
the two chosen companies)..............................................................................................................4
AGL Energy Limited...................................................................................................................4
Origin Energy Limited.................................................................................................................5
Part 2: Analysis and Comparison of the Liquidity and Profitability of the Selected Companies. . .5
Part 2.1: Profitability Analysis.....................................................................................................6
Part 2.2: Liquidity Analysis.........................................................................................................7
Part 3: Share price movement analysis............................................................................................8
Part 3.1: Movements in the monthly share price of both companies over the last three years....8
Part 3.2: Report..........................................................................................................................11
Part 4: Calculation and Analysis of WACC..................................................................................11
Part 4.1: Calculation of current capital structure weights of both the companies.....................11
Part 4.2: Calculation of WACC of both the companies.............................................................12
Part 5: Capital Structure Policy.....................................................................................................14
Part 5.1: Identification and comparison of capital structure policy of two selected companies
through using the capital structure ratios...................................................................................14
Part 5.2: Identification of favorable and unfavorable financial leverage position of both the
companies and analysis of effect of fresh issue of equity capital on the firm’s capital structure
and EPS of the both the companies............................................................................................15
Part 6: Recommendation Letter.....................................................................................................17
Conclusion.....................................................................................................................................17
References......................................................................................................................................18
⊘ This is a preview!⊘
Do you want full access?
Subscribe today to unlock all pages.
Trusted by 1+ million students worldwide
4
Introduction
The present report is developed for providing an understanding of the importance of
financial analysis process for evaluation of the future growth prospects of a company. Financial
analysis can be described as a process of carrying out evaluation of the business projects and
other organizational activities for determining whether a company is profitable or not in the
future contexts. As such, this report carries out the evaluation of the financial performance of
two ASX listed entities for providing financial and investment advice to their investors. The
overall financial analysis of the selected companies is carried out with the use of information
presented within the financial statements of the selected companies. The companies selected for
evaluation purpose are AGL and Origin Energy, operating within the energy sector of Australia.
The financial analysis of both the companies is conducted by comparison of their liquidity and
profitability position and examination of the monthly share prices movements of both the
companies within 3 years. This is followed by calculation of their weighted average cost of
capital and providing a comparison of their capital structure policy. Lastly, it provides
recommendation to the investors regarding the investment portfolio to be created by the selection
of either of the company on the basis of their overall financial evaluation.
Part 1: Description of the Companies (Discussion on operation and comparative
advantages of the two chosen companies)
AGL Energy Limited
AGL Energy Ltd, is recognized to be a leading Australian listed company that is involved
in production and retailing of electricity and gas. The company generates electricity both for
residential and commercial purpose and is headquartered within Sydney, Australia. The company
generates energy from variety of sources such as thermal power, natural gas, wind power,
hydroelectricity, solar energy, and gas storage and steam resources. It is recognized to be one of
the largest developers of renewable energy assets and is also largest private owner for supplying
gas and electricity within Australia. It is categorized to conduct its operations mainly in the four
segments that include customer markets, wholesale market, group operations and investment
segments. The company strategic vision is to deliver affordable, reliable and sustainable energy
solutions to the customers by developing innovative energy solutions. This can be regarded as
Paraphrase This Document
Need a fresh take? Get an instant paraphrase of this document with our AI Paraphraser
5
the comparative advantage of the company over its competitors as it has maintained one of the
largest electricity generation portfolios via investing in renewable energy sections for harnessing
electricity without environment pollution (AGL Energy Limited, 2018).
Origin Energy Limited
Origin Energy, on the other hand, is regarded to be the main competitor of AGL Energy
which is also involved in distribution of gas and electricity products to household and business
sectors within Australia listed on ASX. The core business area of the company involves
exploration of natural gas, retailing of energy and generation of electricity. The energy has
developed an extensive upstream gas deposits. The gas deposits were stated to be a major part of
the coals seam gas boom of Queensland and have lead to the development of 3 LNG processing
facilities. These developments have lead to the evaluation of energy business of Origin and
change its character from being a simply utility business to a heavily leveraged oil and gas
company. The company has derived its competitive advantage from developing its strategic
priorities of providing cleaner sources of energy by becoming a low cost operator within the
energy sector of Australia (Origin Energy Limited, 2018).
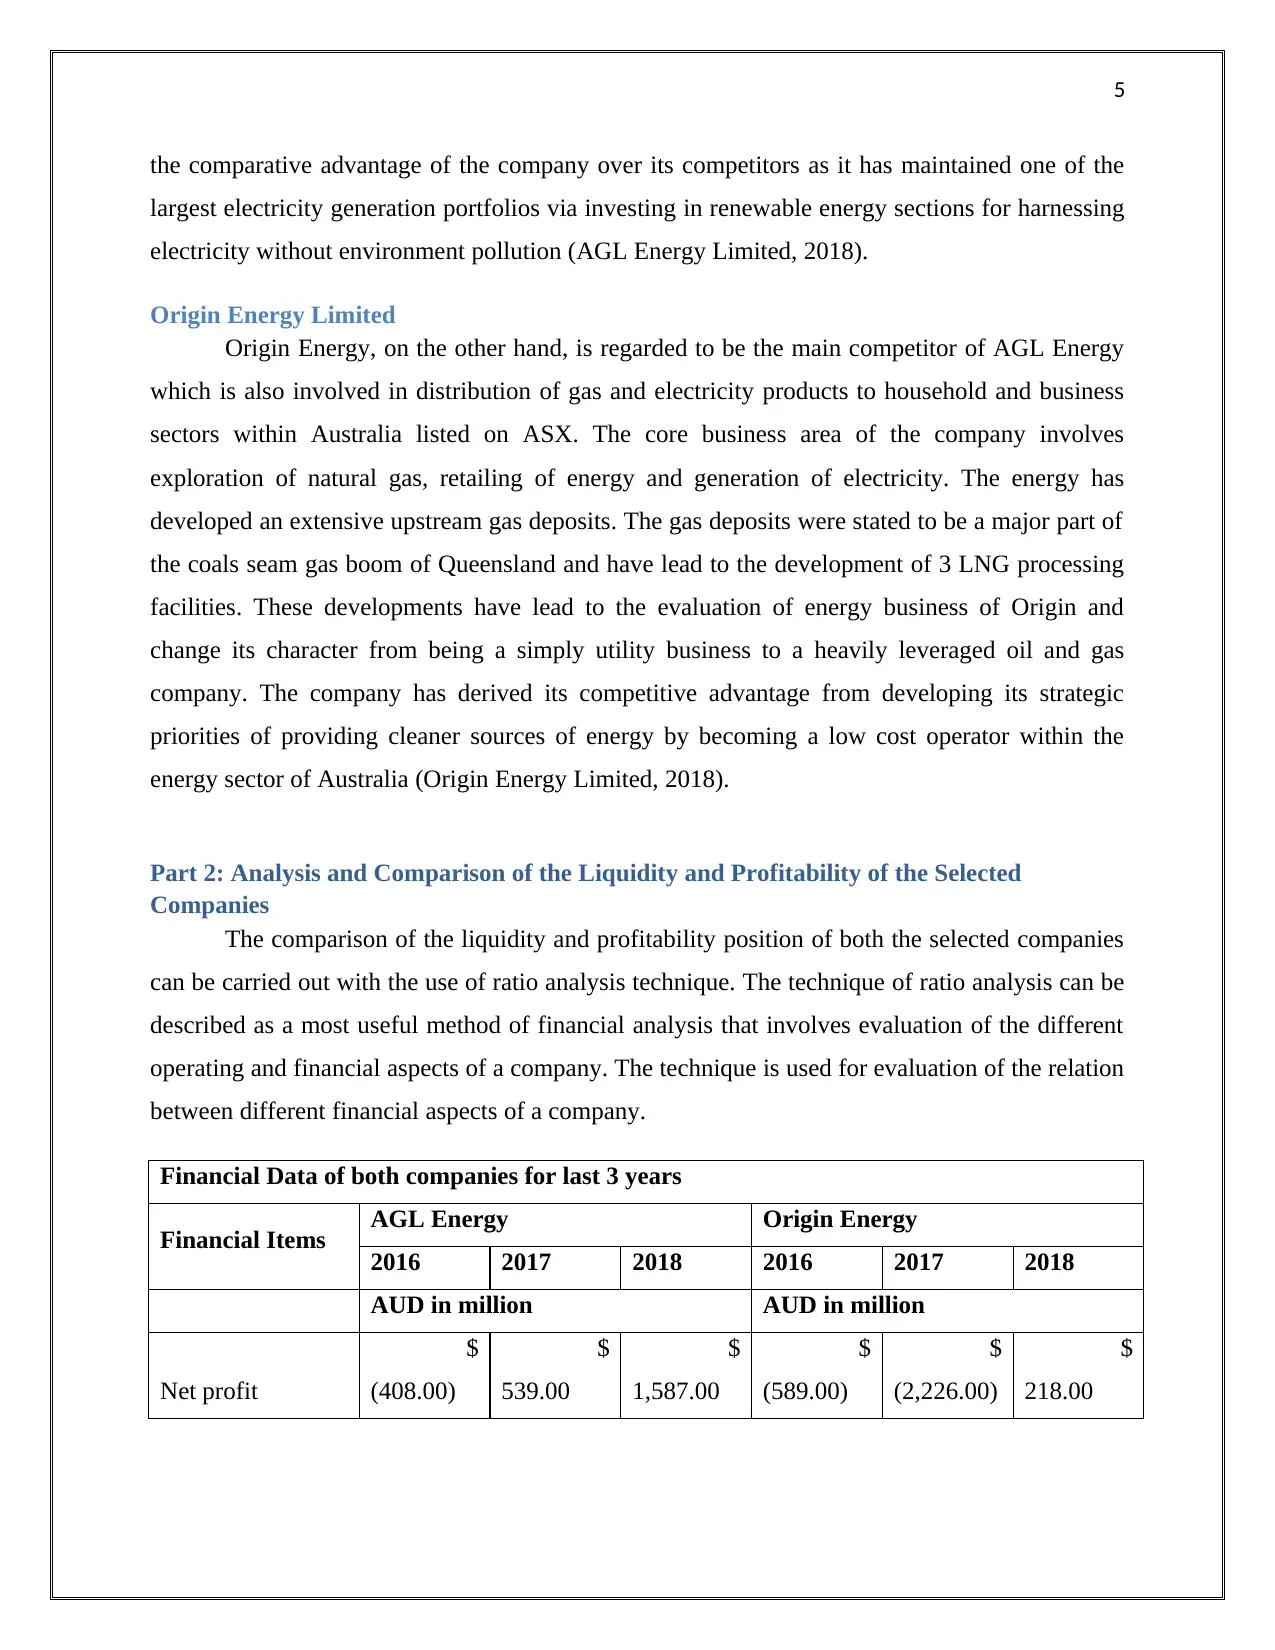
Part 2: Analysis and Comparison of the Liquidity and Profitability of the Selected
Companies
The comparison of the liquidity and profitability position of both the selected companies
can be carried out with the use of ratio analysis technique. The technique of ratio analysis can be
described as a most useful method of financial analysis that involves evaluation of the different
operating and financial aspects of a company. The technique is used for evaluation of the relation
between different financial aspects of a company.
Financial Data of both companies for last 3 years
Financial Items AGL Energy Origin Energy
2016 2017 2018 2016 2017 2018
AUD in million AUD in million
Net profit
$
(408.00)
$
539.00
$
1,587.00
$
(589.00)
$
(2,226.00)
$
218.00
the comparative advantage of the company over its competitors as it has maintained one of the
largest electricity generation portfolios via investing in renewable energy sections for harnessing
electricity without environment pollution (AGL Energy Limited, 2018).
Origin Energy Limited
Origin Energy, on the other hand, is regarded to be the main competitor of AGL Energy
which is also involved in distribution of gas and electricity products to household and business
sectors within Australia listed on ASX. The core business area of the company involves
exploration of natural gas, retailing of energy and generation of electricity. The energy has
developed an extensive upstream gas deposits. The gas deposits were stated to be a major part of
the coals seam gas boom of Queensland and have lead to the development of 3 LNG processing
facilities. These developments have lead to the evaluation of energy business of Origin and
change its character from being a simply utility business to a heavily leveraged oil and gas
company. The company has derived its competitive advantage from developing its strategic
priorities of providing cleaner sources of energy by becoming a low cost operator within the
energy sector of Australia (Origin Energy Limited, 2018).
Part 2: Analysis and Comparison of the Liquidity and Profitability of the Selected
Companies
The comparison of the liquidity and profitability position of both the selected companies
can be carried out with the use of ratio analysis technique. The technique of ratio analysis can be
described as a most useful method of financial analysis that involves evaluation of the different
operating and financial aspects of a company. The technique is used for evaluation of the relation
between different financial aspects of a company.
Financial Data of both companies for last 3 years
Financial Items AGL Energy Origin Energy
2016 2017 2018 2016 2017 2018
AUD in million AUD in million
Net profit
$
(408.00)
$
539.00
$
1,587.00
$
(589.00)
$
(2,226.00)
$
218.00
6
Net
Sales/Revenue
$
11,150.00
$
12,359.00
$
12,816.00
$
11,923.00
$
13,646.00
$
14,604.00
Total Assets
$
14,604.00
$
14,458.00
$
14,639.00
$
28,898.00
$
25,199.00
$
24,257.00
Average Total
Assets
$
15,218.50
$
14,531.00
$
14,548.50
$
31,132.50
$
27,048.50
$
24,728.00
Shareholder's
Equity
$
7,915.00
$
7,574.00
$
8,390.00
$
14,509.00
$
11,396.00
$
11,804.00
Average
Shareholder
Equity
$
8,360.50
$
7,744.50
$
7,982.00
$
13,616.00
$
12,952.50
$
11,600.00
Current Assets
$
3,587.00
$
3,625.00
$
3,806.00
$
3,571.00
$
5,011.00
$
3,766.00
Current Liabilities
$
2,553.00
$
2,731.00
$
2,308.00
$
2,889.00
$
3,854.00
$
4,449.00
Inventory
$
414.00
$
351.00
$
370.00
$
248.00
$
138.00
$
196.00
Quick Assets
$
3,173.00
$
3,274.00
$
3,436.00
$
3,323.00
$
4,873.00
$
3,570.00
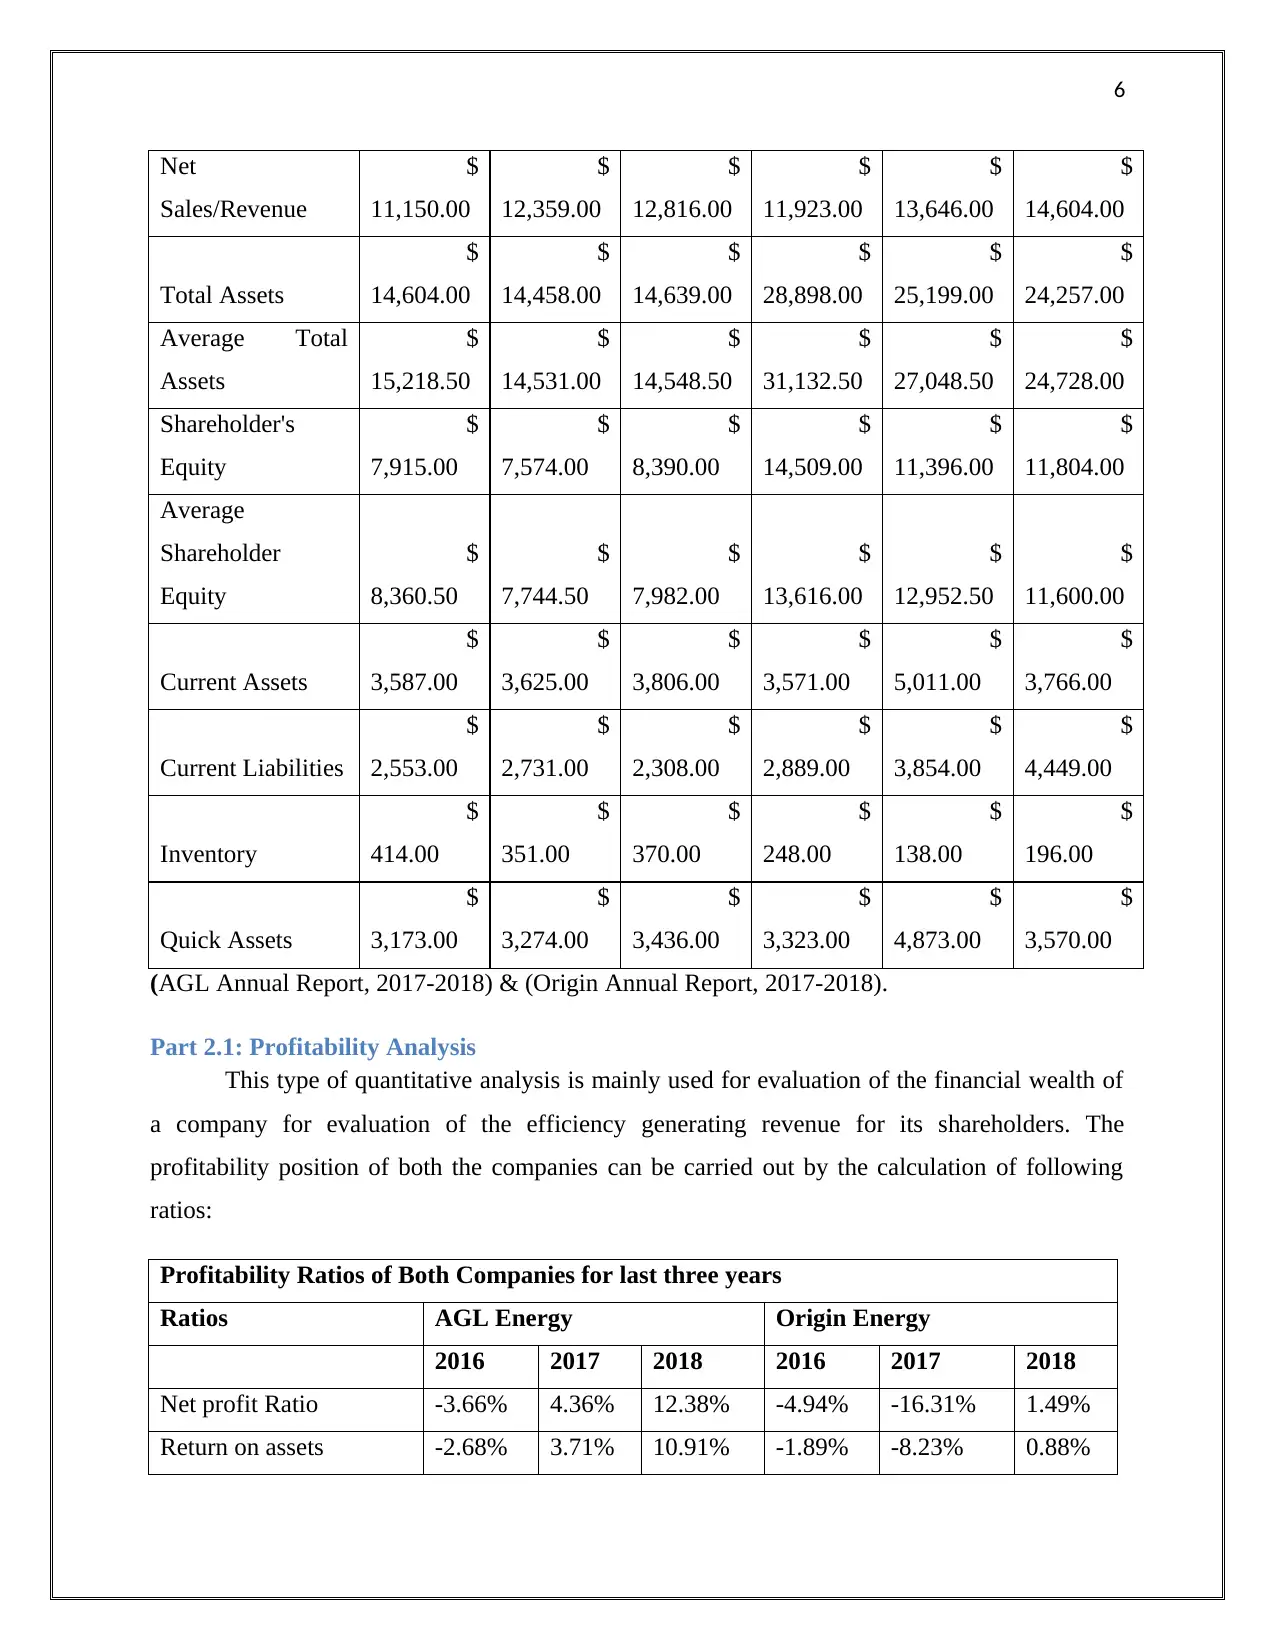
(AGL Annual Report, 2017-2018) & (Origin Annual Report, 2017-2018).
Part 2.1: Profitability Analysis
This type of quantitative analysis is mainly used for evaluation of the financial wealth of
a company for evaluation of the efficiency generating revenue for its shareholders. The
profitability position of both the companies can be carried out by the calculation of following
ratios:
Profitability Ratios of Both Companies for last three years
Ratios AGL Energy Origin Energy
2016 2017 2018 2016 2017 2018
Net profit Ratio -3.66% 4.36% 12.38% -4.94% -16.31% 1.49%
Return on assets -2.68% 3.71% 10.91% -1.89% -8.23% 0.88%
Net
Sales/Revenue
$
11,150.00
$
12,359.00
$
12,816.00
$
11,923.00
$
13,646.00
$
14,604.00
Total Assets
$
14,604.00
$
14,458.00
$
14,639.00
$
28,898.00
$
25,199.00
$
24,257.00
Average Total
Assets
$
15,218.50
$
14,531.00
$
14,548.50
$
31,132.50
$
27,048.50
$
24,728.00
Shareholder's
Equity
$
7,915.00
$
7,574.00
$
8,390.00
$
14,509.00
$
11,396.00
$
11,804.00
Average
Shareholder
Equity
$
8,360.50
$
7,744.50
$
7,982.00
$
13,616.00
$
12,952.50
$
11,600.00
Current Assets
$
3,587.00
$
3,625.00
$
3,806.00
$
3,571.00
$
5,011.00
$
3,766.00
Current Liabilities
$
2,553.00
$
2,731.00
$
2,308.00
$
2,889.00
$
3,854.00
$
4,449.00
Inventory
$
414.00
$
351.00
$
370.00
$
248.00
$
138.00
$
196.00
Quick Assets
$
3,173.00
$
3,274.00
$
3,436.00
$
3,323.00
$
4,873.00
$
3,570.00
(AGL Annual Report, 2017-2018) & (Origin Annual Report, 2017-2018).
Part 2.1: Profitability Analysis
This type of quantitative analysis is mainly used for evaluation of the financial wealth of
a company for evaluation of the efficiency generating revenue for its shareholders. The
profitability position of both the companies can be carried out by the calculation of following
ratios:
Profitability Ratios of Both Companies for last three years
Ratios AGL Energy Origin Energy
2016 2017 2018 2016 2017 2018
Net profit Ratio -3.66% 4.36% 12.38% -4.94% -16.31% 1.49%
Return on assets -2.68% 3.71% 10.91% -1.89% -8.23% 0.88%
⊘ This is a preview!⊘
Do you want full access?
Subscribe today to unlock all pages.
Trusted by 1+ million students worldwide
7
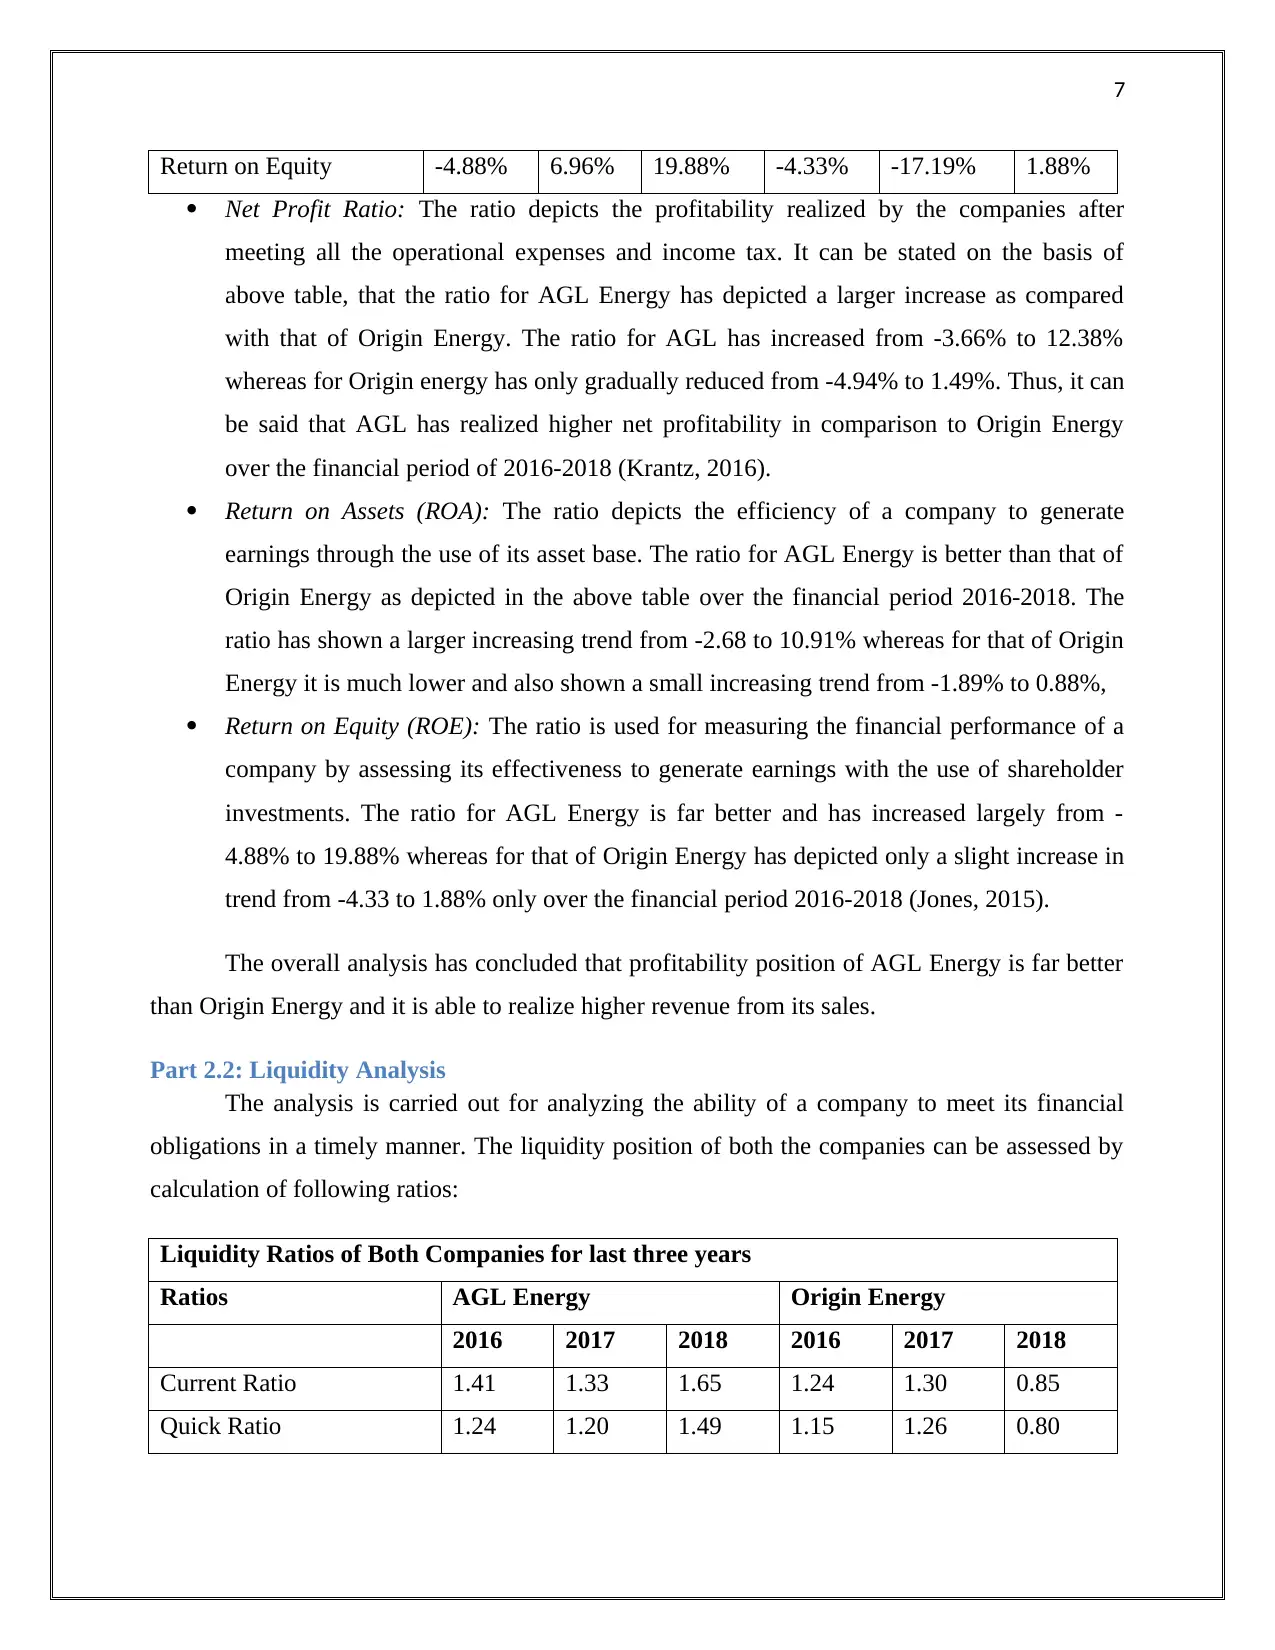
Return on Equity -4.88% 6.96% 19.88% -4.33% -17.19% 1.88%
Net Profit Ratio: The ratio depicts the profitability realized by the companies after
meeting all the operational expenses and income tax. It can be stated on the basis of
above table, that the ratio for AGL Energy has depicted a larger increase as compared
with that of Origin Energy. The ratio for AGL has increased from -3.66% to 12.38%
whereas for Origin energy has only gradually reduced from -4.94% to 1.49%. Thus, it can
be said that AGL has realized higher net profitability in comparison to Origin Energy
over the financial period of 2016-2018 (Krantz, 2016).
Return on Assets (ROA): The ratio depicts the efficiency of a company to generate
earnings through the use of its asset base. The ratio for AGL Energy is better than that of
Origin Energy as depicted in the above table over the financial period 2016-2018. The
ratio has shown a larger increasing trend from -2.68 to 10.91% whereas for that of Origin
Energy it is much lower and also shown a small increasing trend from -1.89% to 0.88%,
Return on Equity (ROE): The ratio is used for measuring the financial performance of a
company by assessing its effectiveness to generate earnings with the use of shareholder
investments. The ratio for AGL Energy is far better and has increased largely from -
4.88% to 19.88% whereas for that of Origin Energy has depicted only a slight increase in
trend from -4.33 to 1.88% only over the financial period 2016-2018 (Jones, 2015).
The overall analysis has concluded that profitability position of AGL Energy is far better
than Origin Energy and it is able to realize higher revenue from its sales.
Part 2.2: Liquidity Analysis
The analysis is carried out for analyzing the ability of a company to meet its financial
obligations in a timely manner. The liquidity position of both the companies can be assessed by
calculation of following ratios:
Liquidity Ratios of Both Companies for last three years
Ratios AGL Energy Origin Energy
2016 2017 2018 2016 2017 2018
Current Ratio 1.41 1.33 1.65 1.24 1.30 0.85
Quick Ratio 1.24 1.20 1.49 1.15 1.26 0.80
Paraphrase This Document
Need a fresh take? Get an instant paraphrase of this document with our AI Paraphraser
8
Current Ratio: It is a liquidity ratio that measures the ability of a company to meet its
financial obligations with its current basset base. The current ratio for AGL Energy has
shown an increasing trend from the year 2016-2018. The ratio has increased from 1.41 to
1.65 whereas for that of Origin Energy has depicted a decreasing trend from 1.24 to 0.85
over the financial year 2016-2018. Thus, it can be said that there is more risk in case of
Origin Energy for not meeting its financial obligations in the future context.
Quick Ratio: The ratio measures the ability of a company to meet its short-term financial
obligations with its most liquid assets such as cash resources (Damodaran, 2011). The
ratio for AGL has improved from 1.24 to 1.49 over the financial period 2016-2018
whereas for that of Origin Energy has been decreased from 1.15 to 0.80. This means that
Origin Energy need to improve the inflow of its cash resources to effectively meet its
short-term financial obligations.
It can be said on the basis of liquidity analysis that AGL Energy Limited liquidity
position is fare better than Origin Energy.
Part 3: Share price movement analysis
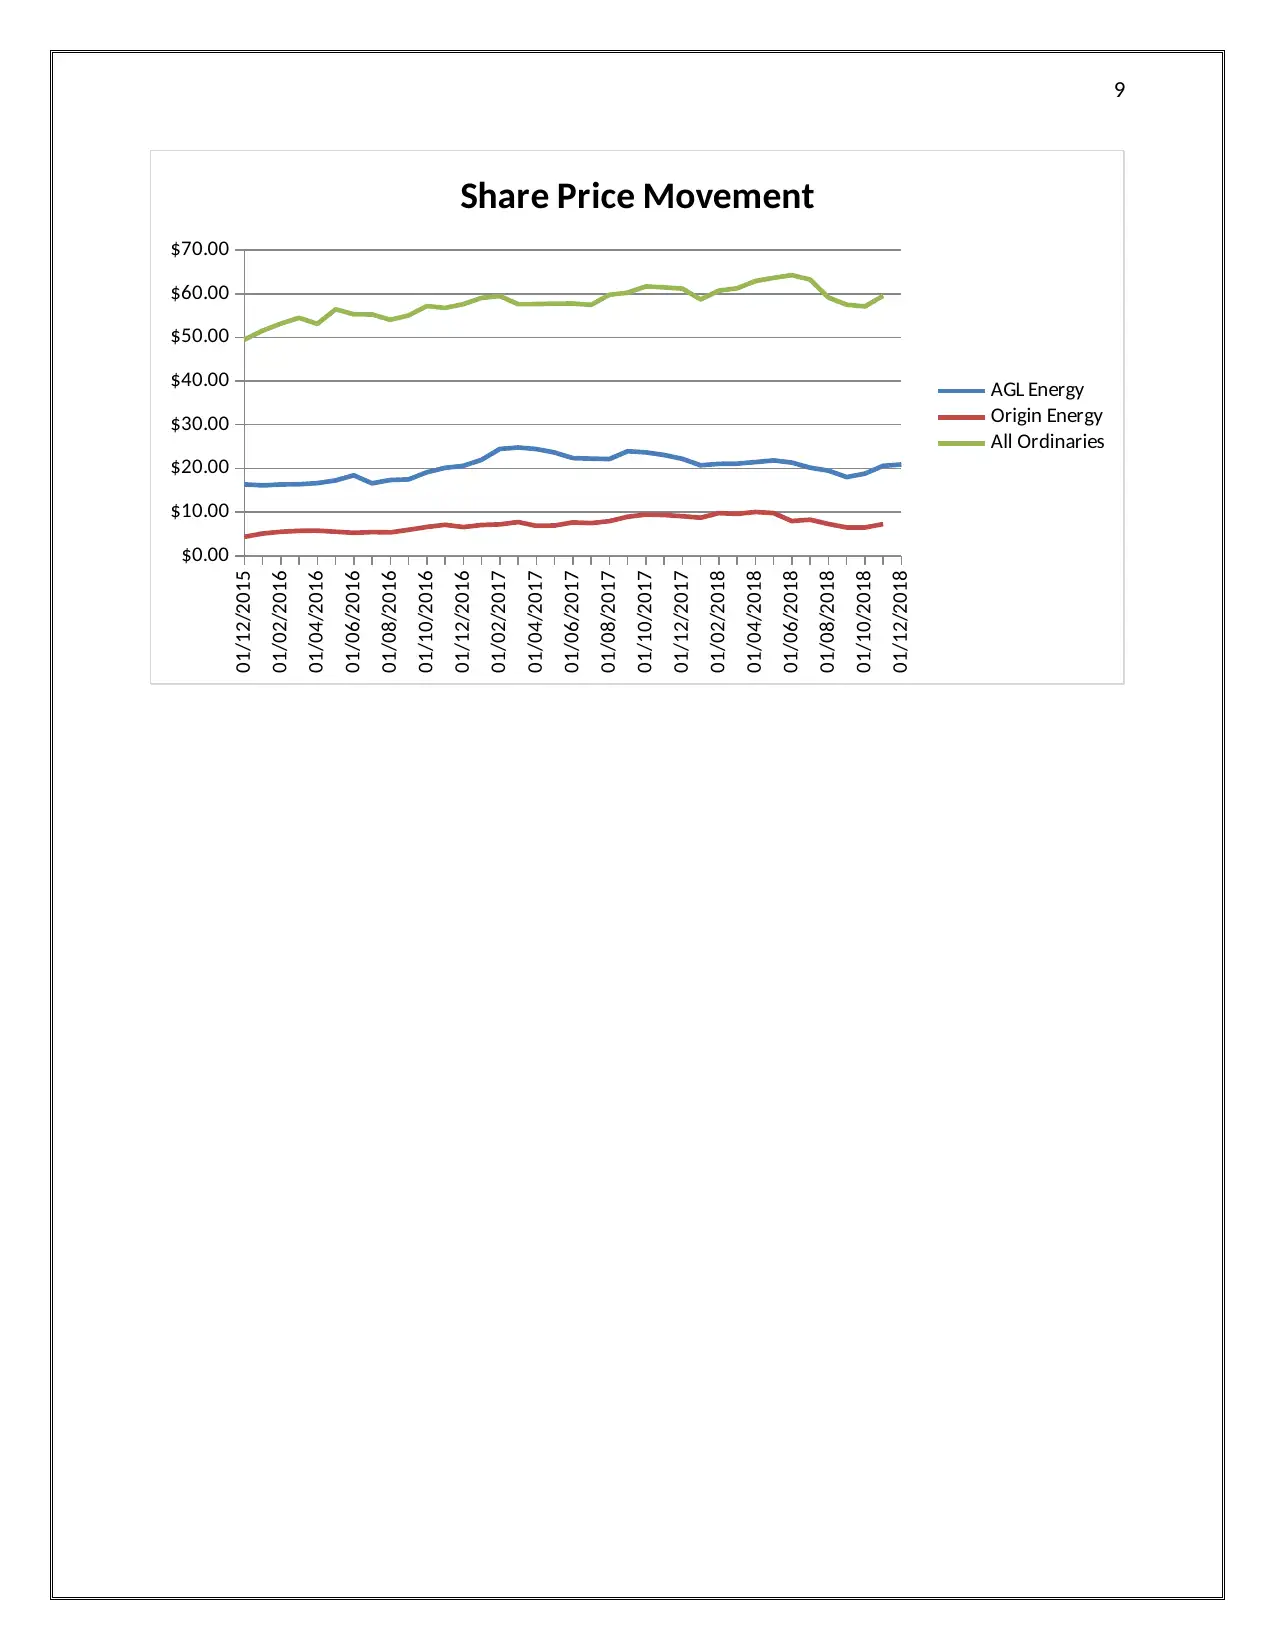
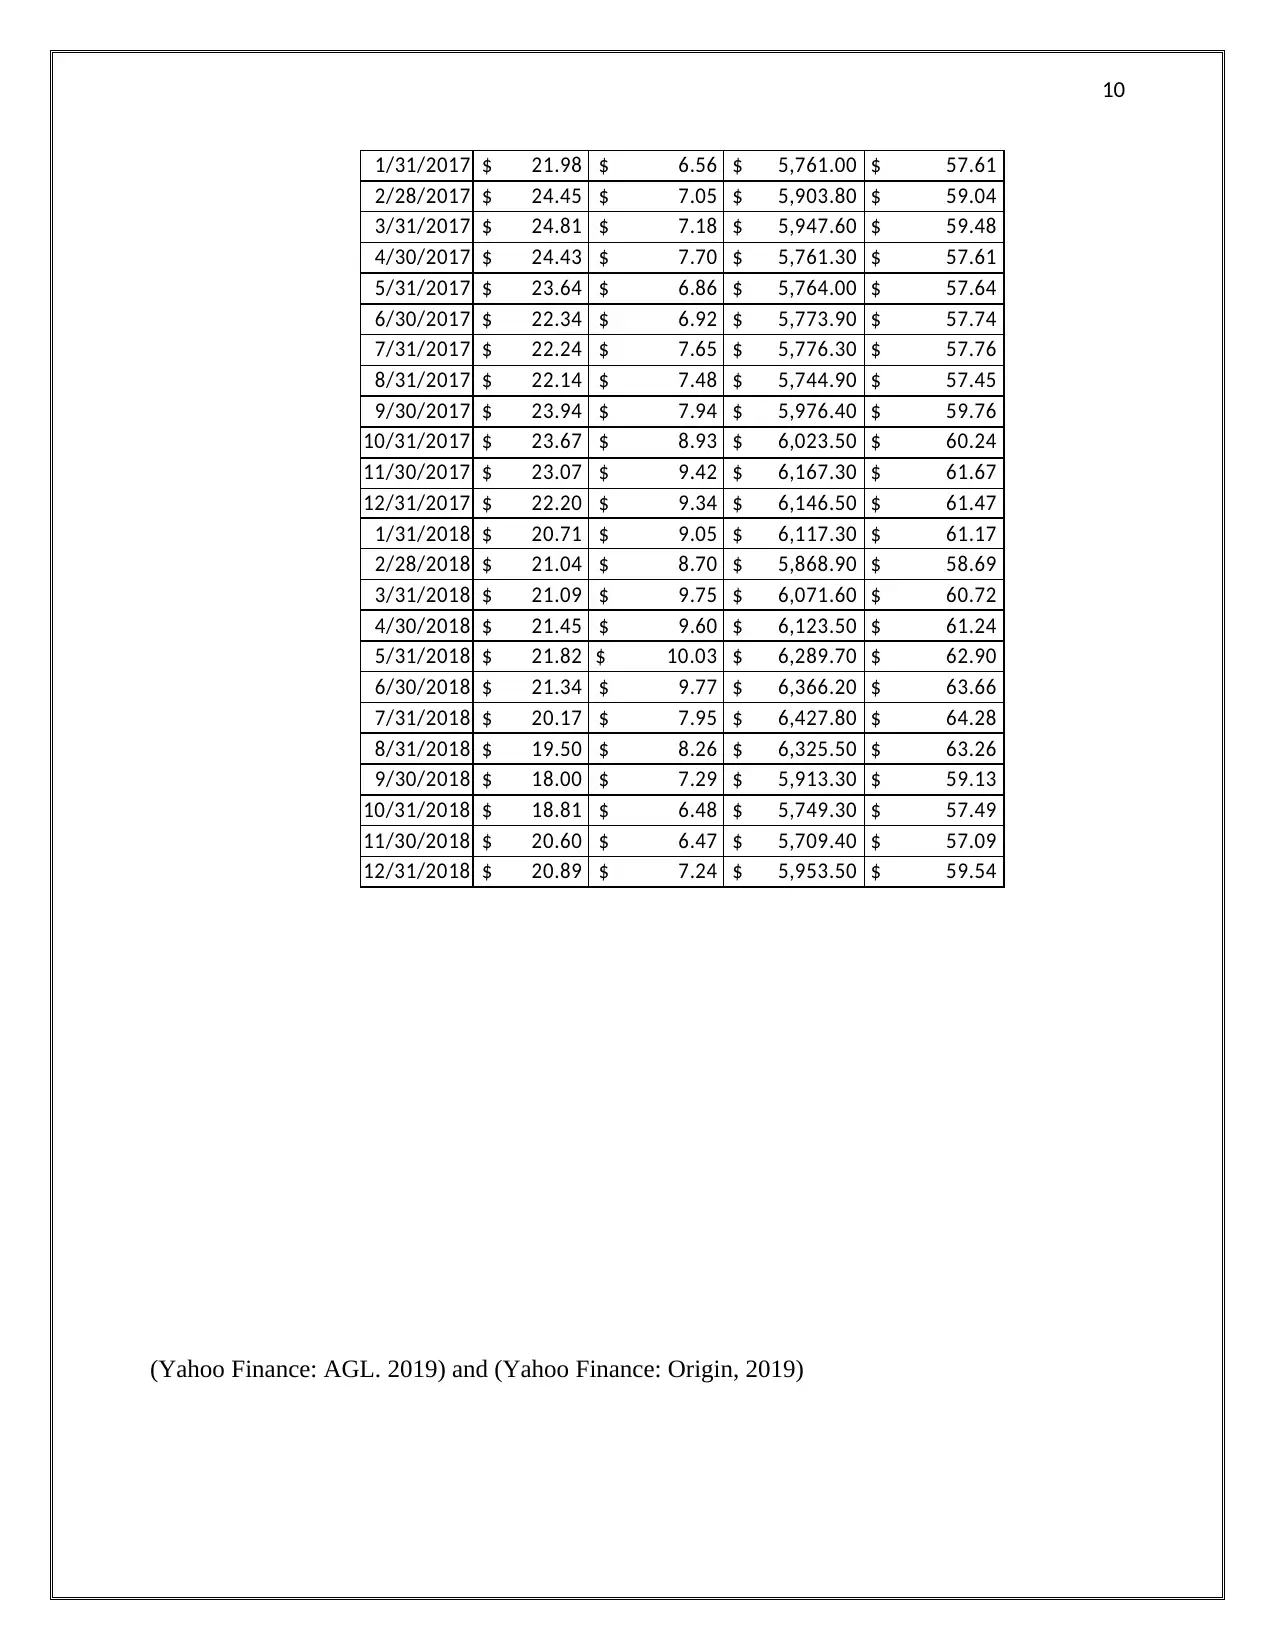
Part 3.1: Movements in the monthly share price of both companies over the last three years
It has been decided to plot the share price movement from 01/01/2016 to 31/12/2018 (3
Years).
Note: For convenience purpose it has been decided to scale the share price value of all
ordinaries to $ 100 so that it is easy to made the graph
Current Ratio: It is a liquidity ratio that measures the ability of a company to meet its
financial obligations with its current basset base. The current ratio for AGL Energy has
shown an increasing trend from the year 2016-2018. The ratio has increased from 1.41 to
1.65 whereas for that of Origin Energy has depicted a decreasing trend from 1.24 to 0.85
over the financial year 2016-2018. Thus, it can be said that there is more risk in case of
Origin Energy for not meeting its financial obligations in the future context.
Quick Ratio: The ratio measures the ability of a company to meet its short-term financial
obligations with its most liquid assets such as cash resources (Damodaran, 2011). The
ratio for AGL has improved from 1.24 to 1.49 over the financial period 2016-2018
whereas for that of Origin Energy has been decreased from 1.15 to 0.80. This means that
Origin Energy need to improve the inflow of its cash resources to effectively meet its
short-term financial obligations.
It can be said on the basis of liquidity analysis that AGL Energy Limited liquidity
position is fare better than Origin Energy.
Part 3: Share price movement analysis
Part 3.1: Movements in the monthly share price of both companies over the last three years
It has been decided to plot the share price movement from 01/01/2016 to 31/12/2018 (3
Years).
Note: For convenience purpose it has been decided to scale the share price value of all
ordinaries to $ 100 so that it is easy to made the graph
9
01/12/2015
01/02/2016
01/04/2016
01/06/2016
01/08/2016
01/10/2016
01/12/2016
01/02/2017
01/04/2017
01/06/2017
01/08/2017
01/10/2017
01/12/2017
01/02/2018
01/04/2018
01/06/2018
01/08/2018
01/10/2018
01/12/2018$0.00
$10.00
$20.00
$30.00
$40.00
$50.00
$60.00
$70.00
Share Price Movement
AGL Energy
Origin Energy
All Ordinaries
⊘ This is a preview!⊘
Do you want full access?
Subscribe today to unlock all pages.
Trusted by 1+ million students worldwide
10
1/31/2017 $ 21.98 $ 6.56 $ 5,761.00 $ 57.61
2/28/2017 $ 24.45 $ 7.05 $ 5,903.80 $ 59.04
3/31/2017 $ 24.81 $ 7.18 $ 5,947.60 $ 59.48
4/30/2017 $ 24.43 $ 7.70 $ 5,761.30 $ 57.61
5/31/2017 $ 23.64 $ 6.86 $ 5,764.00 $ 57.64
6/30/2017 $ 22.34 $ 6.92 $ 5,773.90 $ 57.74
7/31/2017 $ 22.24 $ 7.65 $ 5,776.30 $ 57.76
8/31/2017 $ 22.14 $ 7.48 $ 5,744.90 $ 57.45
9/30/2017 $ 23.94 $ 7.94 $ 5,976.40 $ 59.76
10/31/2017 $ 23.67 $ 8.93 $ 6,023.50 $ 60.24
11/30/2017 $ 23.07 $ 9.42 $ 6,167.30 $ 61.67
12/31/2017 $ 22.20 $ 9.34 $ 6,146.50 $ 61.47
1/31/2018 $ 20.71 $ 9.05 $ 6,117.30 $ 61.17
2/28/2018 $ 21.04 $ 8.70 $ 5,868.90 $ 58.69
3/31/2018 $ 21.09 $ 9.75 $ 6,071.60 $ 60.72
4/30/2018 $ 21.45 $ 9.60 $ 6,123.50 $ 61.24
5/31/2018 $ 21.82 $ 10.03 $ 6,289.70 $ 62.90
6/30/2018 $ 21.34 $ 9.77 $ 6,366.20 $ 63.66
7/31/2018 $ 20.17 $ 7.95 $ 6,427.80 $ 64.28
8/31/2018 $ 19.50 $ 8.26 $ 6,325.50 $ 63.26
9/30/2018 $ 18.00 $ 7.29 $ 5,913.30 $ 59.13
10/31/2018 $ 18.81 $ 6.48 $ 5,749.30 $ 57.49
11/30/2018 $ 20.60 $ 6.47 $ 5,709.40 $ 57.09
12/31/2018 $ 20.89 $ 7.24 $ 5,953.50 $ 59.54
(Yahoo Finance: AGL. 2019) and (Yahoo Finance: Origin, 2019)
Paraphrase This Document
Need a fresh take? Get an instant paraphrase of this document with our AI Paraphraser
11
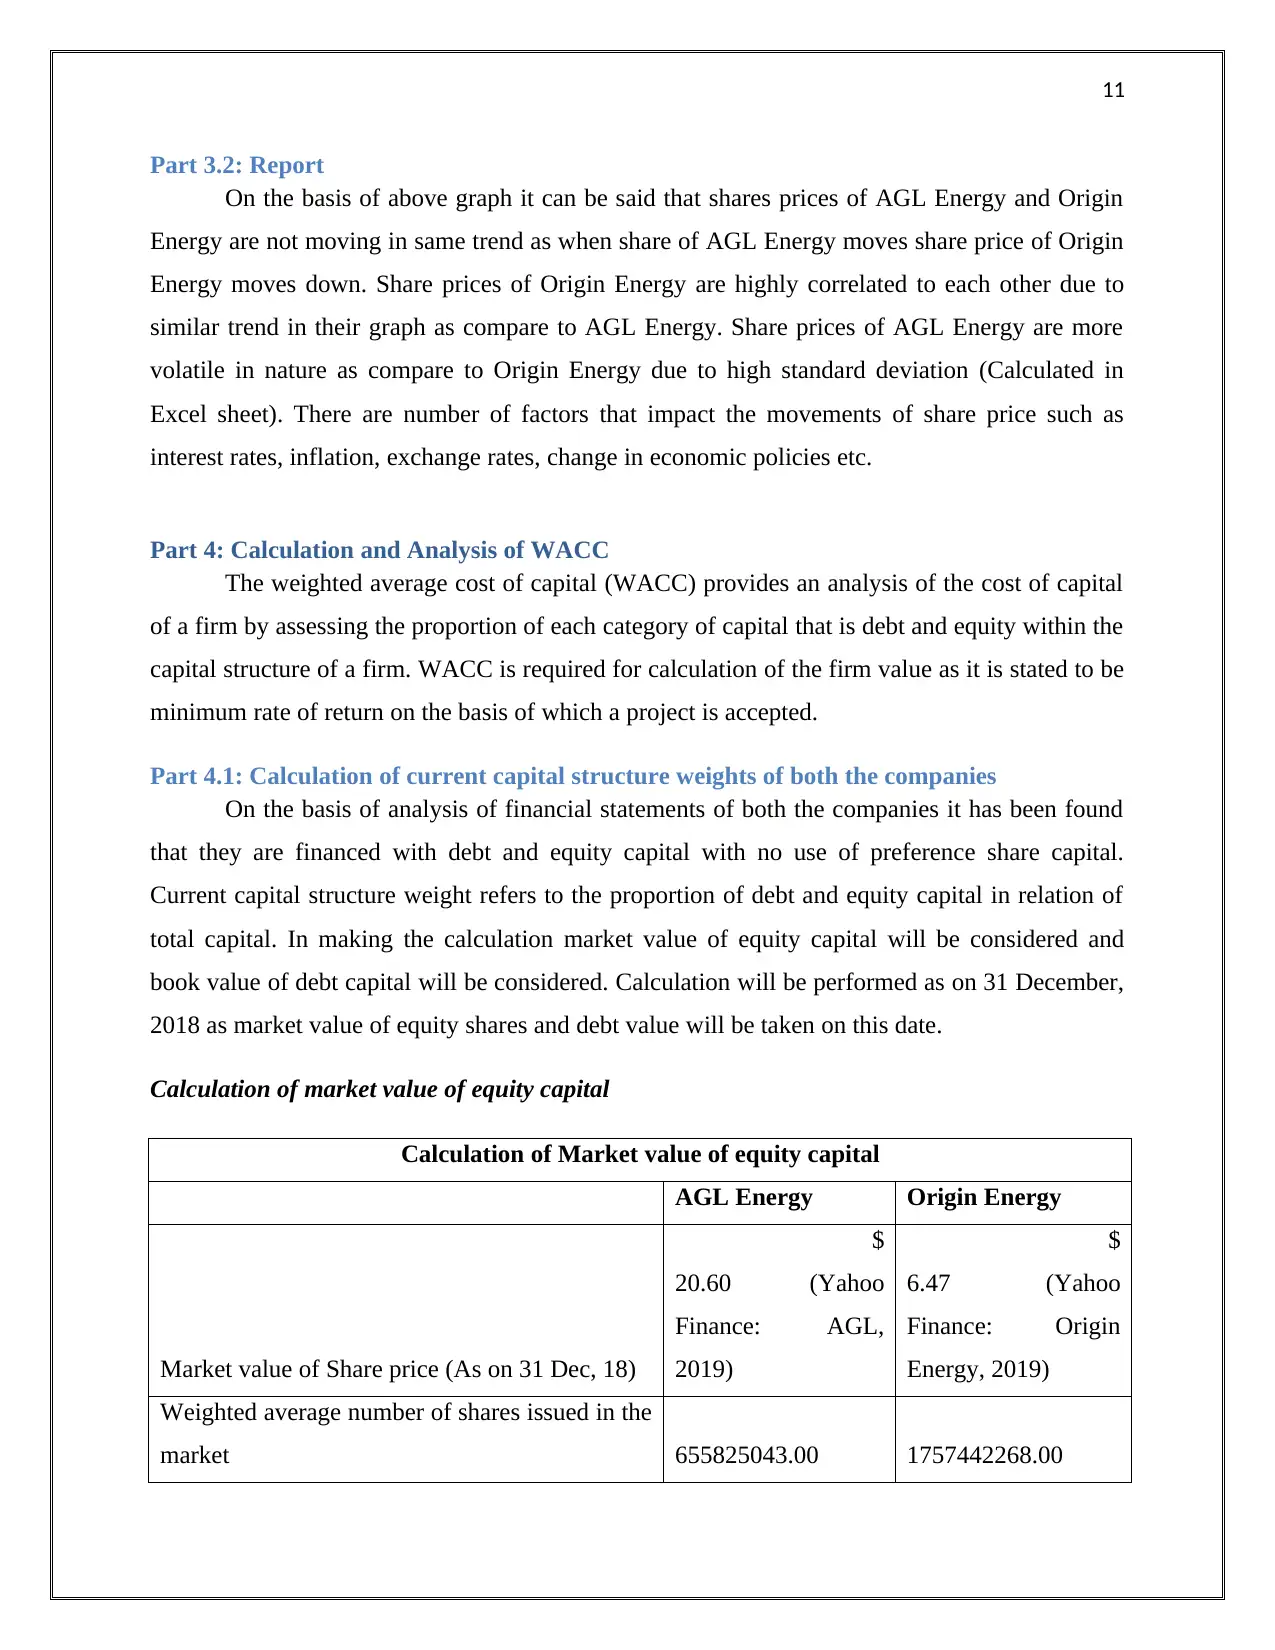
Part 3.2: Report
On the basis of above graph it can be said that shares prices of AGL Energy and Origin
Energy are not moving in same trend as when share of AGL Energy moves share price of Origin
Energy moves down. Share prices of Origin Energy are highly correlated to each other due to
similar trend in their graph as compare to AGL Energy. Share prices of AGL Energy are more
volatile in nature as compare to Origin Energy due to high standard deviation (Calculated in
Excel sheet). There are number of factors that impact the movements of share price such as
interest rates, inflation, exchange rates, change in economic policies etc.
Part 4: Calculation and Analysis of WACC
The weighted average cost of capital (WACC) provides an analysis of the cost of capital
of a firm by assessing the proportion of each category of capital that is debt and equity within the
capital structure of a firm. WACC is required for calculation of the firm value as it is stated to be
minimum rate of return on the basis of which a project is accepted.
Part 4.1: Calculation of current capital structure weights of both the companies
On the basis of analysis of financial statements of both the companies it has been found
that they are financed with debt and equity capital with no use of preference share capital.
Current capital structure weight refers to the proportion of debt and equity capital in relation of
total capital. In making the calculation market value of equity capital will be considered and
book value of debt capital will be considered. Calculation will be performed as on 31 December,
2018 as market value of equity shares and debt value will be taken on this date.
Calculation of market value of equity capital
Calculation of Market value of equity capital
AGL Energy Origin Energy
Market value of Share price (As on 31 Dec, 18)
$
20.60 (Yahoo
Finance: AGL,
2019)
$
6.47 (Yahoo
Finance: Origin
Energy, 2019)
Weighted average number of shares issued in the
market 655825043.00 1757442268.00
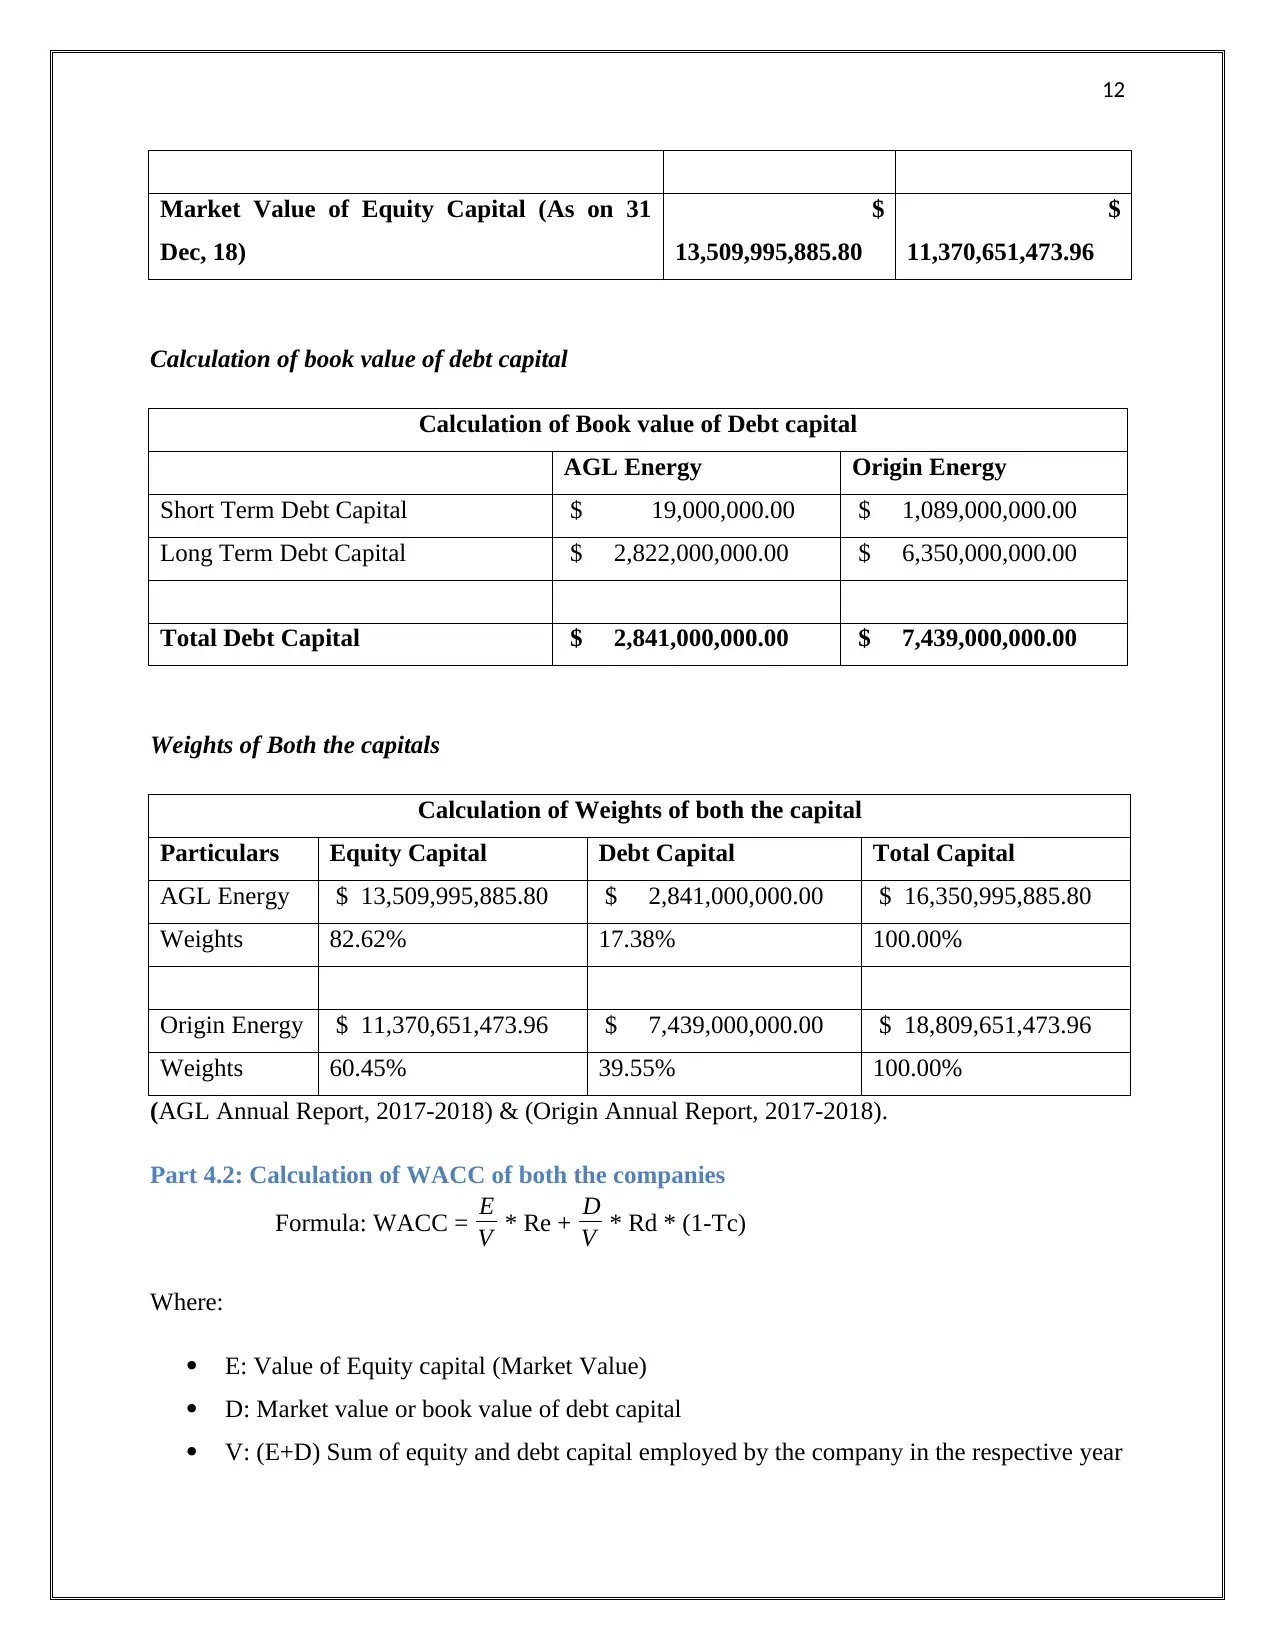
12
Market Value of Equity Capital (As on 31
Dec, 18)
$
13,509,995,885.80
$
11,370,651,473.96
Calculation of book value of debt capital
Calculation of Book value of Debt capital
AGL Energy Origin Energy
Short Term Debt Capital $ 19,000,000.00 $ 1,089,000,000.00
Long Term Debt Capital $ 2,822,000,000.00 $ 6,350,000,000.00
Total Debt Capital $ 2,841,000,000.00 $ 7,439,000,000.00
Weights of Both the capitals
Calculation of Weights of both the capital
Particulars Equity Capital Debt Capital Total Capital
AGL Energy $ 13,509,995,885.80 $ 2,841,000,000.00 $ 16,350,995,885.80
Weights 82.62% 17.38% 100.00%
Origin Energy $ 11,370,651,473.96 $ 7,439,000,000.00 $ 18,809,651,473.96
Weights 60.45% 39.55% 100.00%
(AGL Annual Report, 2017-2018) & (Origin Annual Report, 2017-2018).
Part 4.2: Calculation of WACC of both the companies
Formula: WACC = E
V * Re + D
V * Rd * (1-Tc)
Where:
E: Value of Equity capital (Market Value)
D: Market value or book value of debt capital
V: (E+D) Sum of equity and debt capital employed by the company in the respective year
⊘ This is a preview!⊘
Do you want full access?
Subscribe today to unlock all pages.
Trusted by 1+ million students worldwide
1 out of 19
Related Documents


Your All-in-One AI-Powered Toolkit for Academic Success.
+13062052269
info@desklib.com
Available 24*7 on WhatsApp / Email
![[object Object]](/_next/static/media/star-bottom.7253800d.svg)
Unlock your academic potential
Copyright © 2020–2026 A2Z Services. All Rights Reserved. Developed and managed by ZUCOL.