LSBM203 Managerial Finance: Financial Statement Analysis & Appraisal
VerifiedAdded on 2023/06/15
|17
|4204
|365
Report
AI Summary
This report provides a comprehensive financial analysis of two retail companies, B&M and Morrison, using various financial ratios to assess their performance, financial position, and investment potential. The analysis includes current ratio, quick ratio, operating profit margin, gross profit margin, return on capital employed, inventory turnover, debtor's days, creditor's days, gearing ratios, and earnings per share. The report recommends improvements for Morrison in liquidity management and suggests both companies monitor cash balances closely. It also discusses the limitations of ratio analysis and investment appraisal techniques in long-term decision-making, highlighting the importance of considering qualitative factors and external economic conditions. The second portfolio focuses on investment appraisal techniques, evaluating the acceptance of appropriate projects, and explains the limitations regarding their use in long-term decision making. The report concludes by emphasizing the importance of a balanced approach incorporating both quantitative and qualitative assessments for effective managerial finance decisions.

Managerial finance
Paraphrase This Document
Need a fresh take? Get an instant paraphrase of this document with our AI Paraphraser
Table of Contents
INTRODUCTION...........................................................................................................................3
MAIN BODY ..................................................................................................................................3
PORTFOLIO 1.................................................................................................................................3
A. FINANCIAL RATIOS............................................................................................................3
B. Analysis of performance, financial position and investment potential of both companies.....4
C. RECOMMENDATION........................................................................................................11
D. Limitations of ratio analysis..................................................................................................11
PORTFOLIO 2...............................................................................................................................12
A. INVESTMENT APPRAISAL TECHNIQUES FOR ALPHA AND BETA:.......................12
B. LIMITATIONS OF INVESTMENT APPRAISAL TECHNIQUES...................................13
CONCLUSION..............................................................................................................................15
REFERENCES..............................................................................................................................16
INTRODUCTION
Managerial finance is the concept that is responsible for taking business decisions that
directly impacts the profits, losses, cash flow as well as revenue generation within the
organisation. The process contributes to the overall growth of the business in a significant
manner. Managerial finance is interested in the external as well as internal importance of the
financial figures of the firm (Akhtar, Thyagaraj and Das, 2017). This present report consists of
two portfolios in which the first portfolio is of financial analysis of two companies, that are,
B&M and Morrison. In this portfolio, financial ratios are going to be calculated along with the
performance analysis of both companies. Recommendations regarding financial performance
will also be taken into consideration. The limitations of relying on financial ratios for
interpreting the performance of company will also be discussed in this portfolio. The next
portfolio consists of capital investment appraisal in which these techniques will be considered to
advise the senior management regarding acceptance of the appropriate project (Al Islami and
Madyan, 2020). In this portfolio, the limitations regarding the use of investment appraisal
techniques in long-term decision making is also going to be explained.
MAIN BODY
PORTFOLIO 1
A. FINANCIAL RATIOS
B&M MORRISON
Ratio Formula 2019 2020 2019 2020
Current ratio Total current assets / Total
current liabilities 1.13:1 1.18:1
0.48:1 0.39:1
Quick ratio Total current assets -
Inventory / Total current
liabilities 0.52:1 0.36:1
0.19:1 0.21:1
Operating profit Operating income/ 8.73% 13.15% 2.97% 1.44%
⊘ This is a preview!⊘
Do you want full access?
Subscribe today to unlock all pages.
Trusted by 1+ million students worldwide
margin Revenue
Gross profit margin Gross profit/Revenue 33.64% 36.80% 3.59% 2.20%
Return on capital
employed
EBIT/Total assets-Current
liabilities 12.81% 23.42%
5.78% 2.0 5%
Average inventories
turnover period
Average inventory/cost of
goods sold*365 42.41
days
71.83
days
7.12
days
15.63
days
Debtor's days Average debtors/Net credit
sales*365 2.90
days
3.91
days
3.67
days
14.29
days
Creditor's days Average creditors/Net
credit purchases*365 422.79
days
744.56
days
31.75
days
26.42
days
Gearing ratios Total debt / Total equity 3.12% 3.58% 1.40% 1.65%
Earnings per share EPS (Taken from annual
reports) 18.8 85.5 7.94 29.04
B. Analysis of performance, financial position and investment potential of both companies
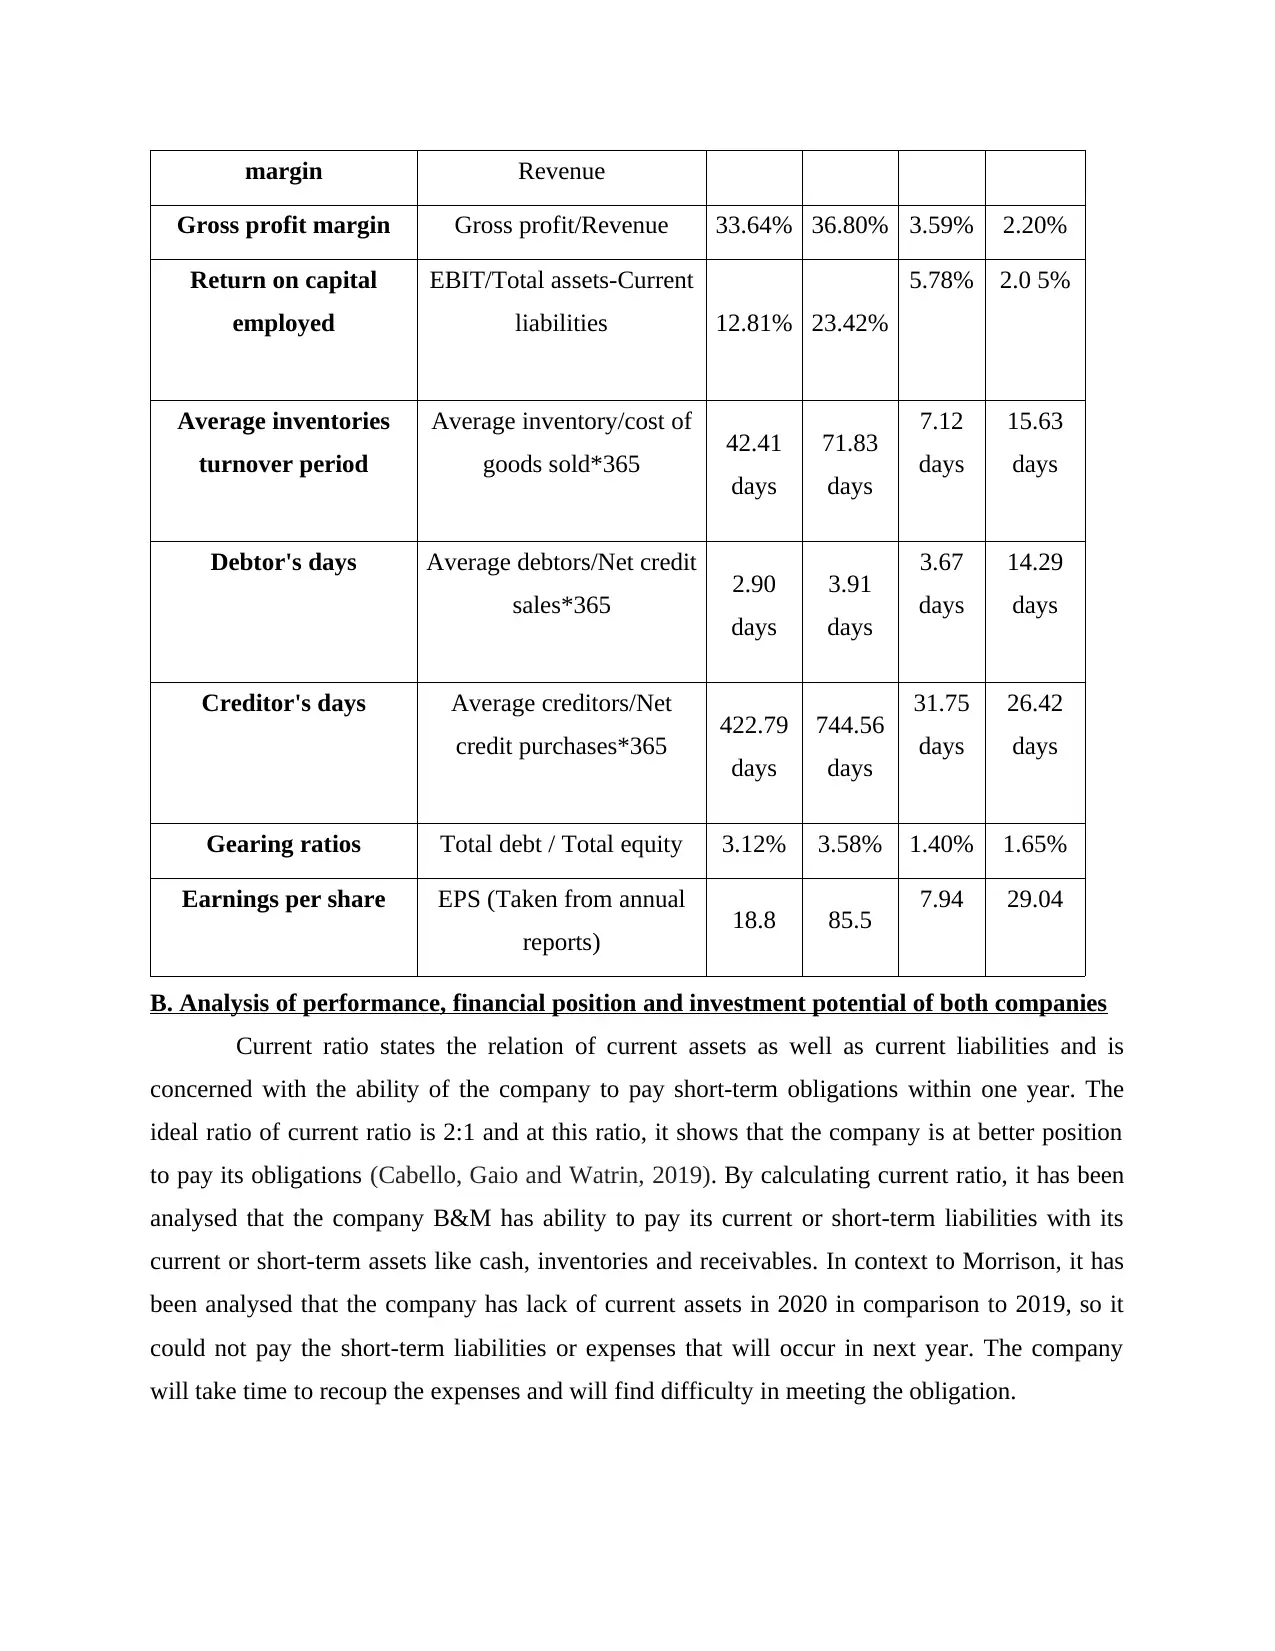
Current ratio states the relation of current assets as well as current liabilities and is
concerned with the ability of the company to pay short-term obligations within one year. The
ideal ratio of current ratio is 2:1 and at this ratio, it shows that the company is at better position
to pay its obligations (Cabello, Gaio and Watrin, 2019). By calculating current ratio, it has been
analysed that the company B&M has ability to pay its current or short-term liabilities with its
current or short-term assets like cash, inventories and receivables. In context to Morrison, it has
been analysed that the company has lack of current assets in 2020 in comparison to 2019, so it
could not pay the short-term liabilities or expenses that will occur in next year. The company
will take time to recoup the expenses and will find difficulty in meeting the obligation.
Gross profit margin Gross profit/Revenue 33.64% 36.80% 3.59% 2.20%
Return on capital
employed
EBIT/Total assets-Current
liabilities 12.81% 23.42%
5.78% 2.0 5%
Average inventories
turnover period
Average inventory/cost of
goods sold*365 42.41
days
71.83
days
7.12
days
15.63
days
Debtor's days Average debtors/Net credit
sales*365 2.90
days
3.91
days
3.67
days
14.29
days
Creditor's days Average creditors/Net
credit purchases*365 422.79
days
744.56
days
31.75
days
26.42
days
Gearing ratios Total debt / Total equity 3.12% 3.58% 1.40% 1.65%
Earnings per share EPS (Taken from annual
reports) 18.8 85.5 7.94 29.04
B. Analysis of performance, financial position and investment potential of both companies
Current ratio states the relation of current assets as well as current liabilities and is
concerned with the ability of the company to pay short-term obligations within one year. The
ideal ratio of current ratio is 2:1 and at this ratio, it shows that the company is at better position
to pay its obligations (Cabello, Gaio and Watrin, 2019). By calculating current ratio, it has been
analysed that the company B&M has ability to pay its current or short-term liabilities with its
current or short-term assets like cash, inventories and receivables. In context to Morrison, it has
been analysed that the company has lack of current assets in 2020 in comparison to 2019, so it
could not pay the short-term liabilities or expenses that will occur in next year. The company
will take time to recoup the expenses and will find difficulty in meeting the obligation.
Paraphrase This Document
Need a fresh take? Get an instant paraphrase of this document with our AI Paraphraser
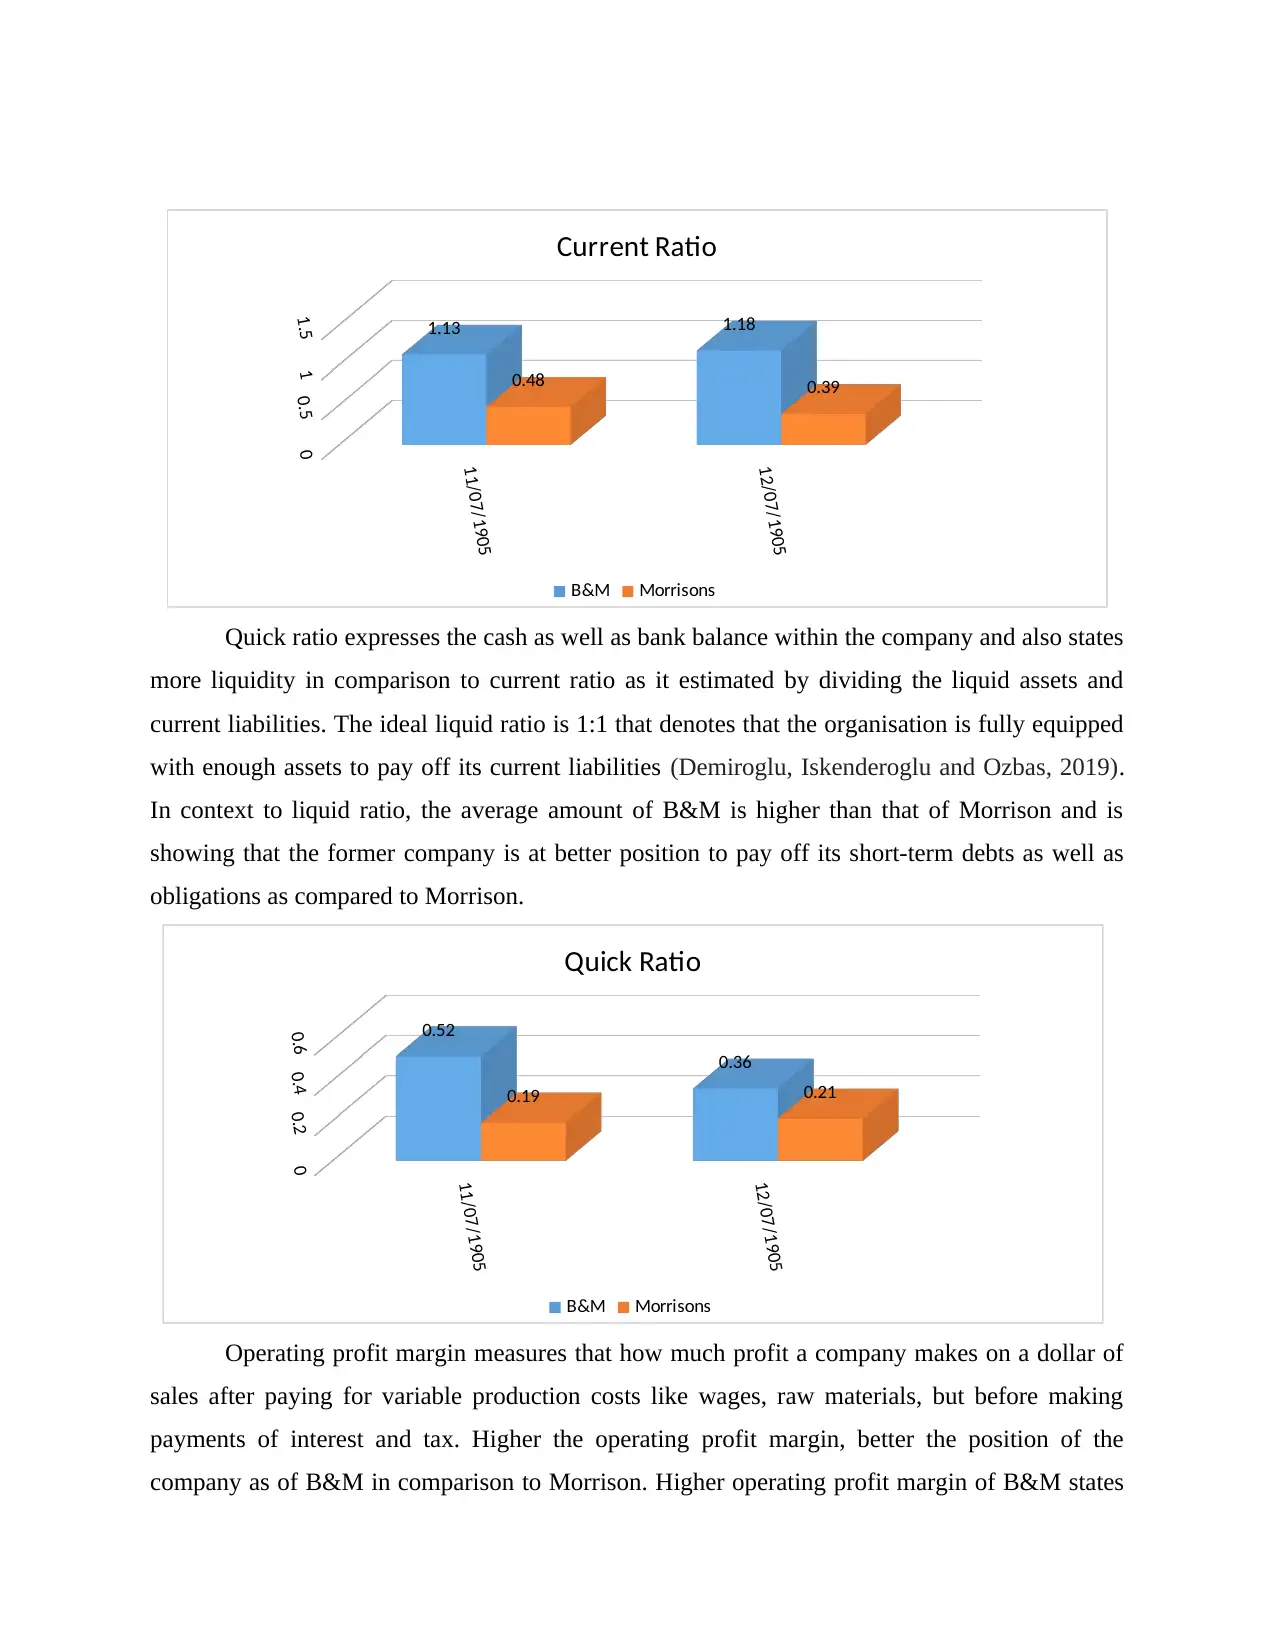
Quick ratio expresses the cash as well as bank balance within the company and also states
more liquidity in comparison to current ratio as it estimated by dividing the liquid assets and
current liabilities. The ideal liquid ratio is 1:1 that denotes that the organisation is fully equipped
with enough assets to pay off its current liabilities (Demiroglu, Iskenderoglu and Ozbas, 2019).
In context to liquid ratio, the average amount of B&M is higher than that of Morrison and is
showing that the former company is at better position to pay off its short-term debts as well as
obligations as compared to Morrison.
Operating profit margin measures that how much profit a company makes on a dollar of
sales after paying for variable production costs like wages, raw materials, but before making
payments of interest and tax. Higher the operating profit margin, better the position of the
company as of B&M in comparison to Morrison. Higher operating profit margin of B&M states
11/07/1905
12/07/1905
00.511.5 1.13 1.18
0.48 0.39
Current Ratio
B&M Morrisons
11/07/1905
12/07/1905
00.20.40.6
0.52
0.36
0.19 0.21
Quick Ratio
B&M Morrisons
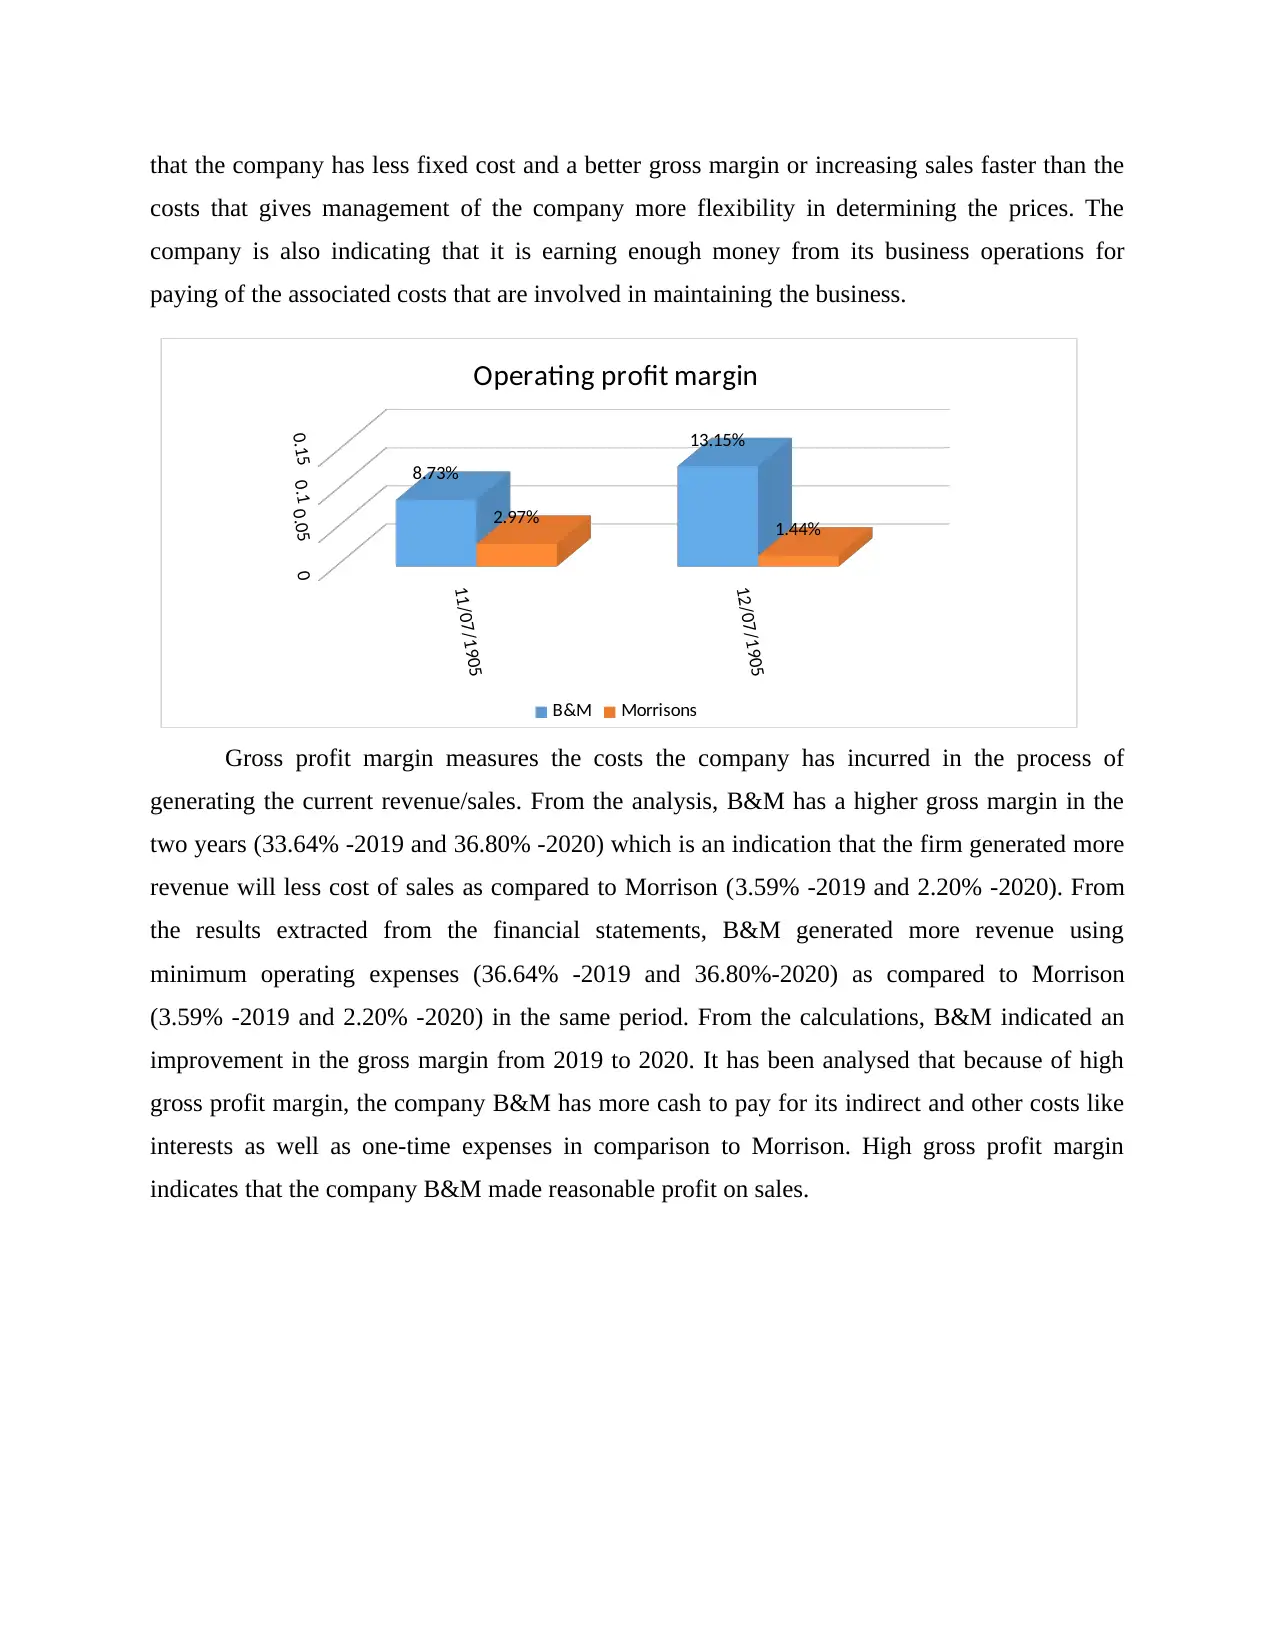
that the company has less fixed cost and a better gross margin or increasing sales faster than the
costs that gives management of the company more flexibility in determining the prices. The
company is also indicating that it is earning enough money from its business operations for
paying of the associated costs that are involved in maintaining the business.
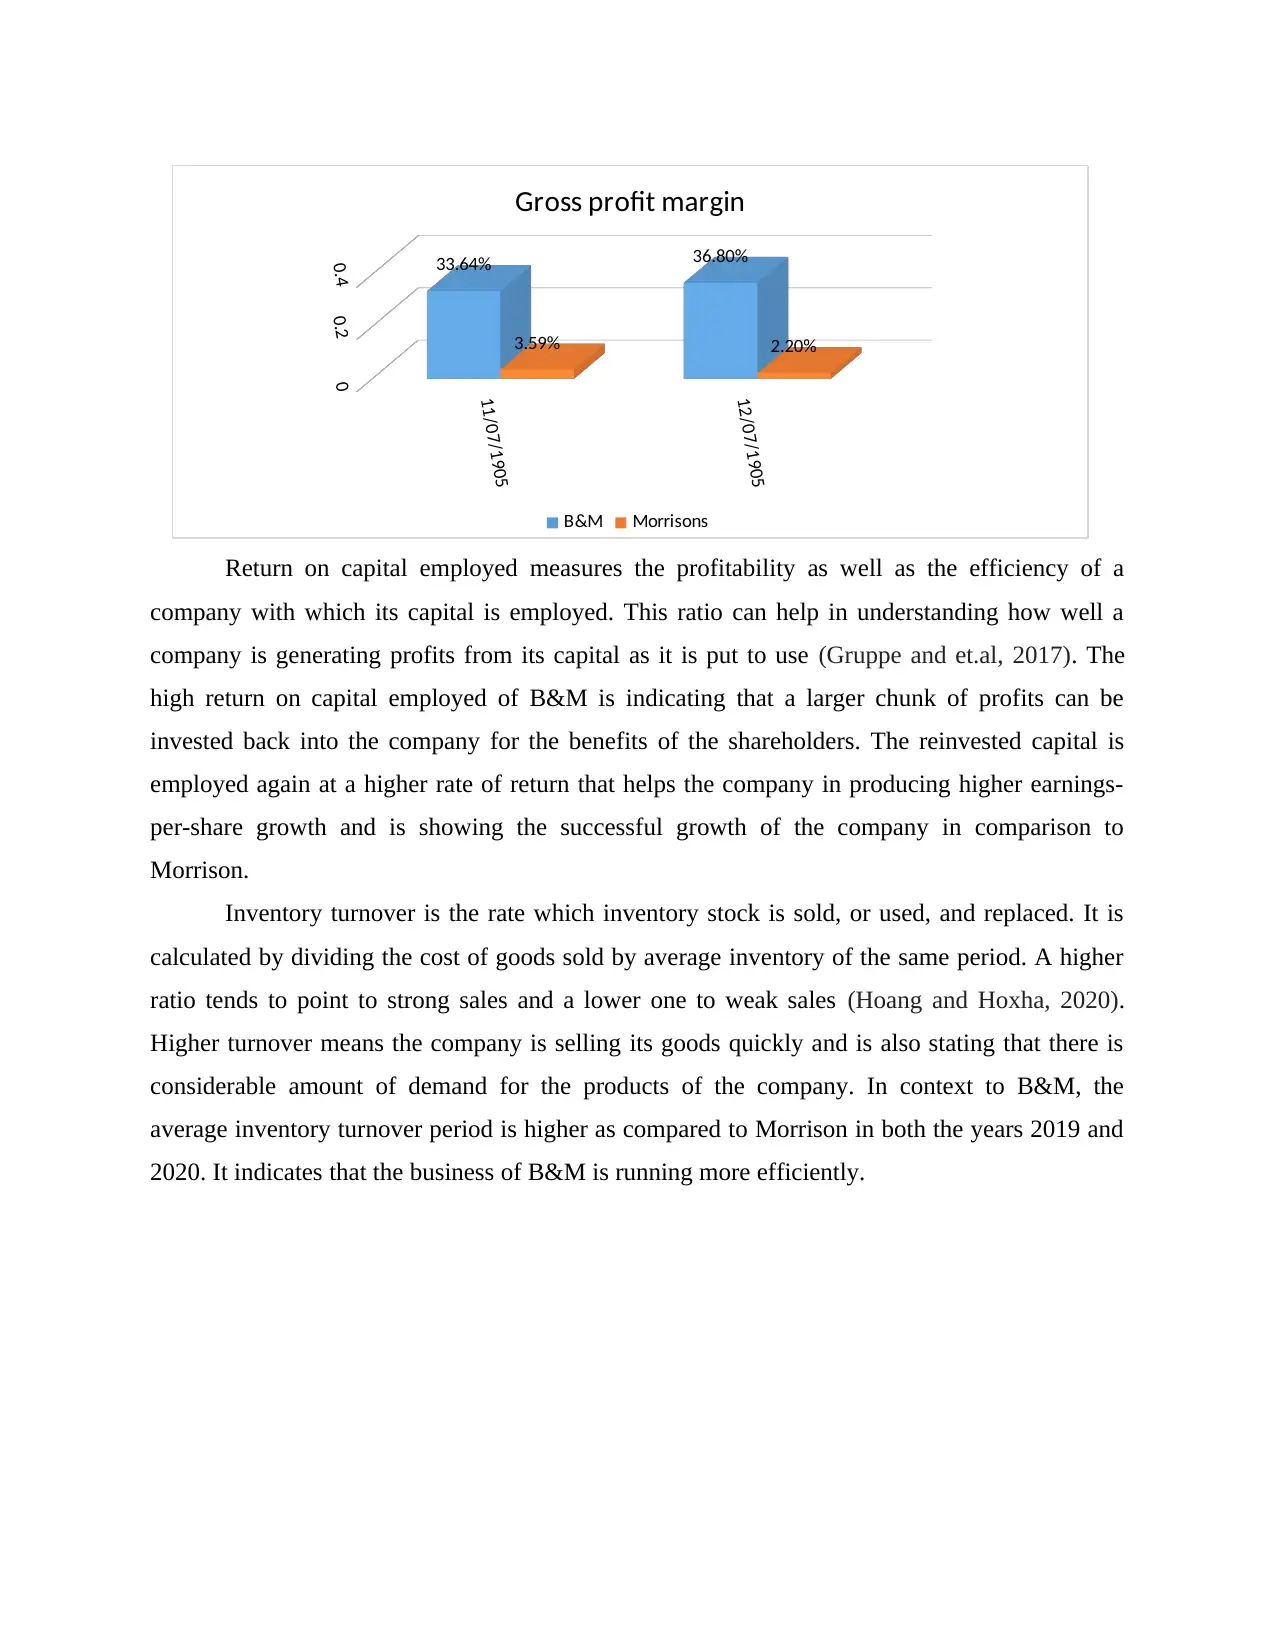
Gross profit margin measures the costs the company has incurred in the process of
generating the current revenue/sales. From the analysis, B&M has a higher gross margin in the
two years (33.64% -2019 and 36.80% -2020) which is an indication that the firm generated more
revenue will less cost of sales as compared to Morrison (3.59% -2019 and 2.20% -2020). From
the results extracted from the financial statements, B&M generated more revenue using
minimum operating expenses (36.64% -2019 and 36.80%-2020) as compared to Morrison
(3.59% -2019 and 2.20% -2020) in the same period. From the calculations, B&M indicated an
improvement in the gross margin from 2019 to 2020. It has been analysed that because of high
gross profit margin, the company B&M has more cash to pay for its indirect and other costs like
interests as well as one-time expenses in comparison to Morrison. High gross profit margin
indicates that the company B&M made reasonable profit on sales.
11/07/1905
12/07/1905
00.050.10.15 8.73%
13.15%
2.97% 1.44%
Operating profit margin
B&M Morrisons
costs that gives management of the company more flexibility in determining the prices. The
company is also indicating that it is earning enough money from its business operations for
paying of the associated costs that are involved in maintaining the business.
Gross profit margin measures the costs the company has incurred in the process of
generating the current revenue/sales. From the analysis, B&M has a higher gross margin in the
two years (33.64% -2019 and 36.80% -2020) which is an indication that the firm generated more
revenue will less cost of sales as compared to Morrison (3.59% -2019 and 2.20% -2020). From
the results extracted from the financial statements, B&M generated more revenue using
minimum operating expenses (36.64% -2019 and 36.80%-2020) as compared to Morrison
(3.59% -2019 and 2.20% -2020) in the same period. From the calculations, B&M indicated an
improvement in the gross margin from 2019 to 2020. It has been analysed that because of high
gross profit margin, the company B&M has more cash to pay for its indirect and other costs like
interests as well as one-time expenses in comparison to Morrison. High gross profit margin
indicates that the company B&M made reasonable profit on sales.
11/07/1905
12/07/1905
00.050.10.15 8.73%
13.15%
2.97% 1.44%
Operating profit margin
B&M Morrisons
⊘ This is a preview!⊘
Do you want full access?
Subscribe today to unlock all pages.
Trusted by 1+ million students worldwide
Return on capital employed measures the profitability as well as the efficiency of a
company with which its capital is employed. This ratio can help in understanding how well a
company is generating profits from its capital as it is put to use (Gruppe and et.al, 2017). The
high return on capital employed of B&M is indicating that a larger chunk of profits can be
invested back into the company for the benefits of the shareholders. The reinvested capital is
employed again at a higher rate of return that helps the company in producing higher earnings-
per-share growth and is showing the successful growth of the company in comparison to
Morrison.
Inventory turnover is the rate which inventory stock is sold, or used, and replaced. It is
calculated by dividing the cost of goods sold by average inventory of the same period. A higher
ratio tends to point to strong sales and a lower one to weak sales (Hoang and Hoxha, 2020).
Higher turnover means the company is selling its goods quickly and is also stating that there is
considerable amount of demand for the products of the company. In context to B&M, the
average inventory turnover period is higher as compared to Morrison in both the years 2019 and
2020. It indicates that the business of B&M is running more efficiently.
11/07/1905
12/07/1905
00.20.4 33.64% 36.80%
3.59% 2.20%
Gross profit margin
B&M Morrisons
Paraphrase This Document
Need a fresh take? Get an instant paraphrase of this document with our AI Paraphraser
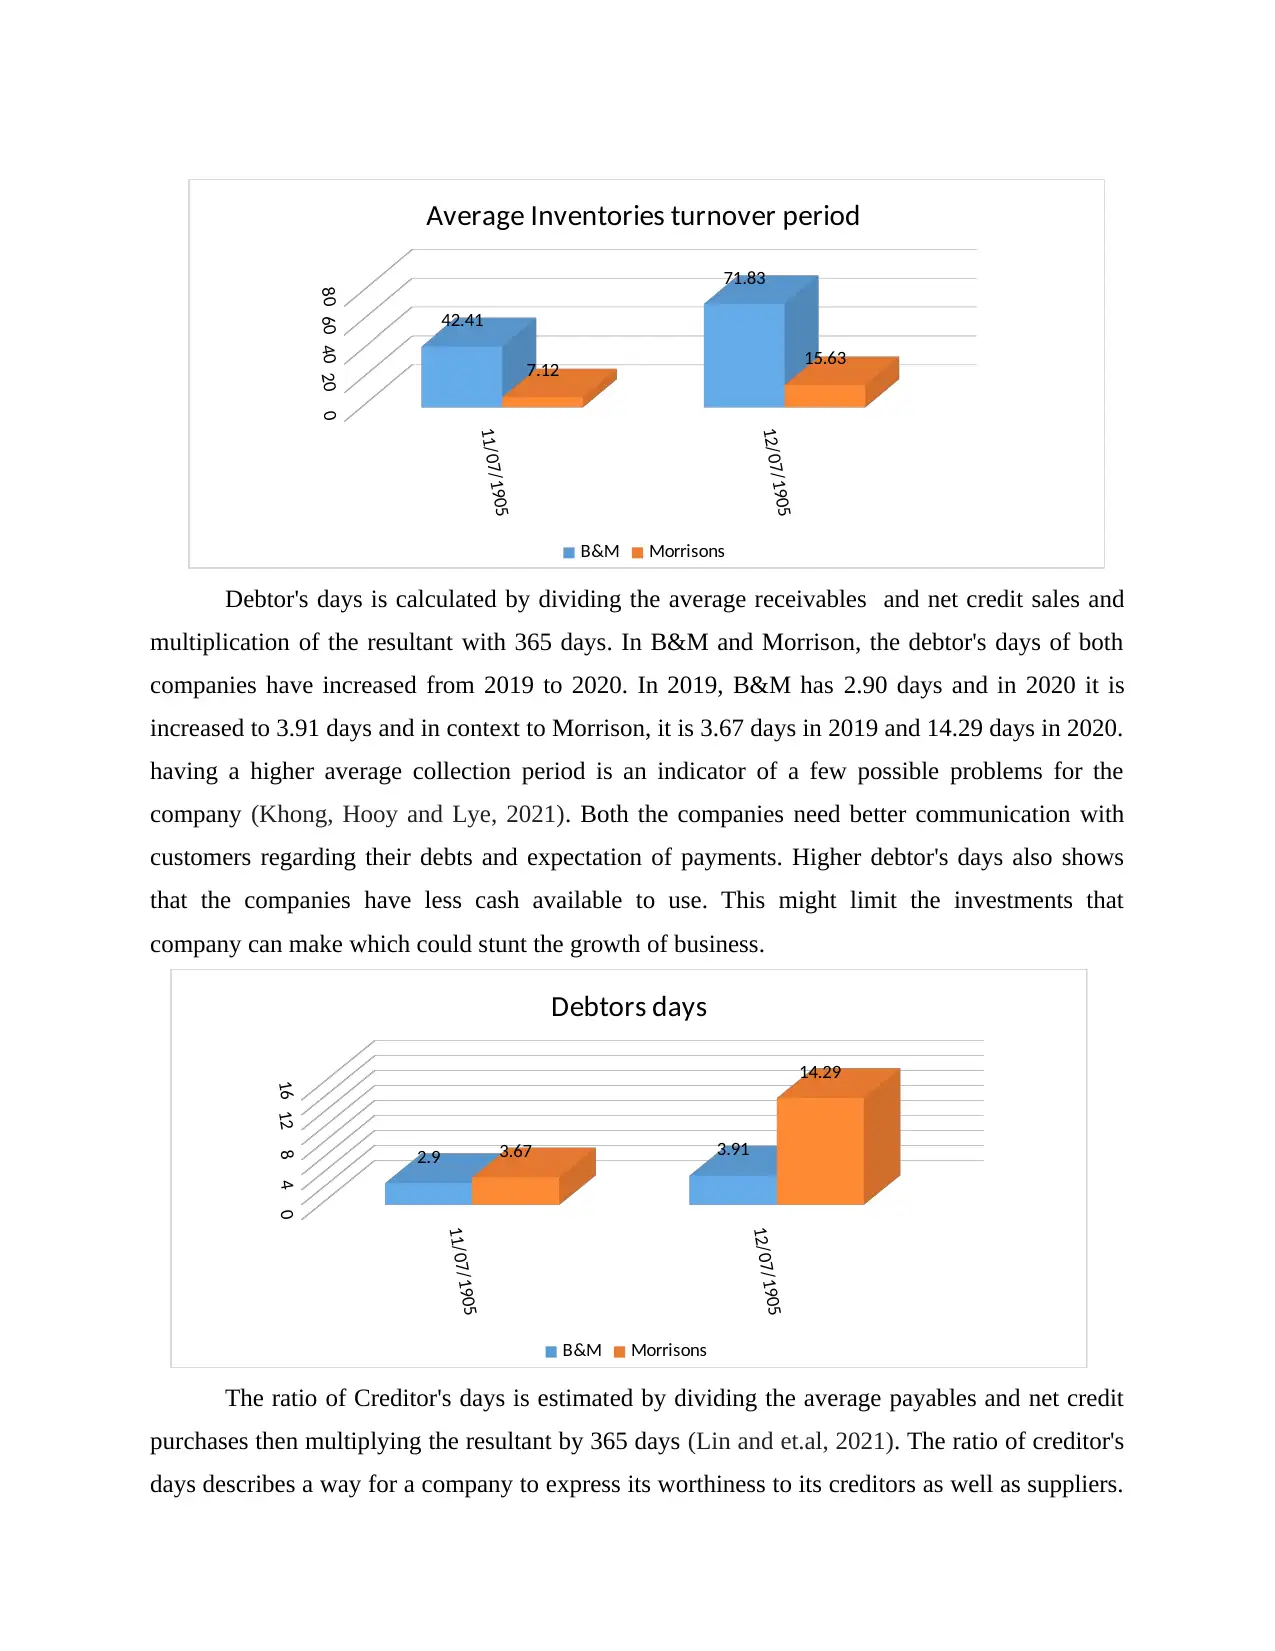
Debtor's days is calculated by dividing the average receivables and net credit sales and
multiplication of the resultant with 365 days. In B&M and Morrison, the debtor's days of both
companies have increased from 2019 to 2020. In 2019, B&M has 2.90 days and in 2020 it is
increased to 3.91 days and in context to Morrison, it is 3.67 days in 2019 and 14.29 days in 2020.
having a higher average collection period is an indicator of a few possible problems for the
company (Khong, Hooy and Lye, 2021). Both the companies need better communication with
customers regarding their debts and expectation of payments. Higher debtor's days also shows
that the companies have less cash available to use. This might limit the investments that
company can make which could stunt the growth of business.
The ratio of Creditor's days is estimated by dividing the average payables and net credit
purchases then multiplying the resultant by 365 days (Lin and et.al, 2021). The ratio of creditor's
days describes a way for a company to express its worthiness to its creditors as well as suppliers.
11/07/1905
12/07/1905
020406080
42.41
71.83
7.12 15.63
Average Inventories turnover period
B&M Morrisons
11/07/1905
12/07/1905
0481216
2.9 3.913.67
14.29
Debtors days
B&M Morrisons
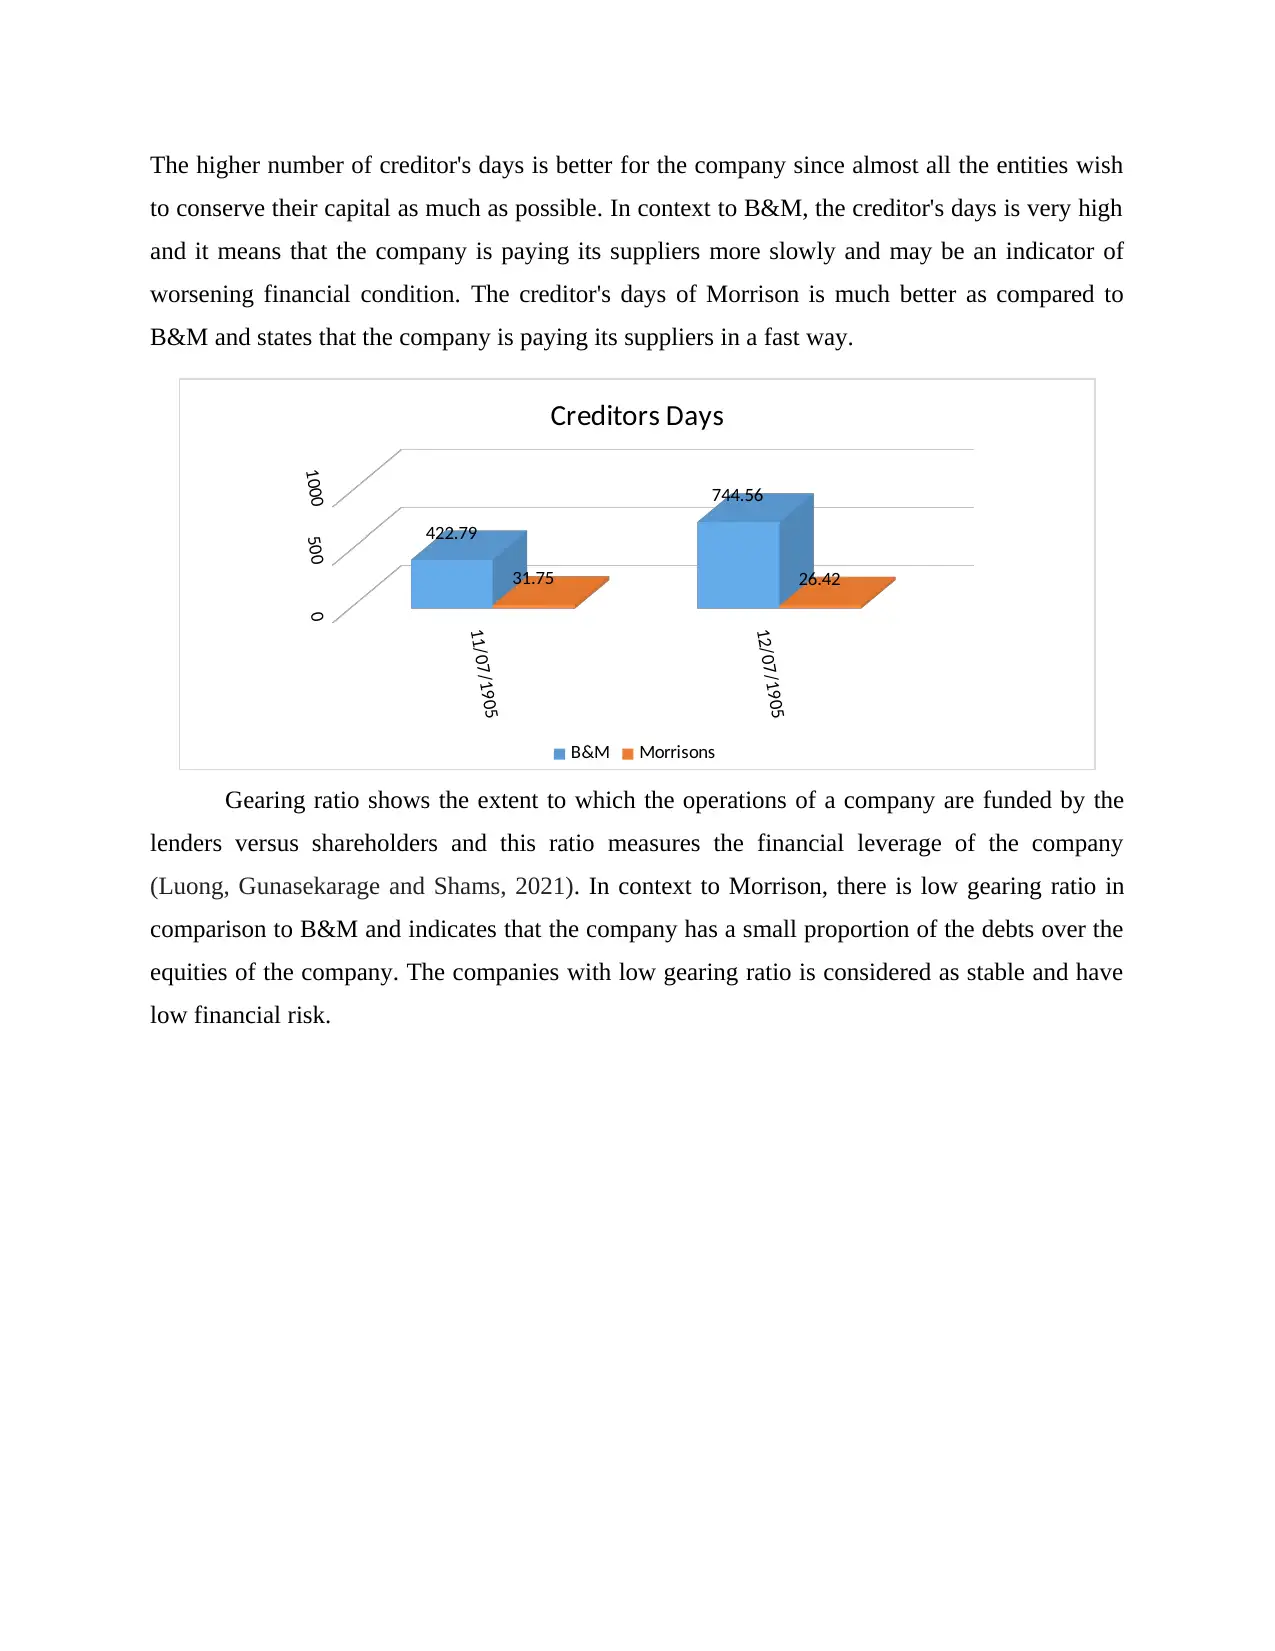
The higher number of creditor's days is better for the company since almost all the entities wish
to conserve their capital as much as possible. In context to B&M, the creditor's days is very high
and it means that the company is paying its suppliers more slowly and may be an indicator of
worsening financial condition. The creditor's days of Morrison is much better as compared to
B&M and states that the company is paying its suppliers in a fast way.
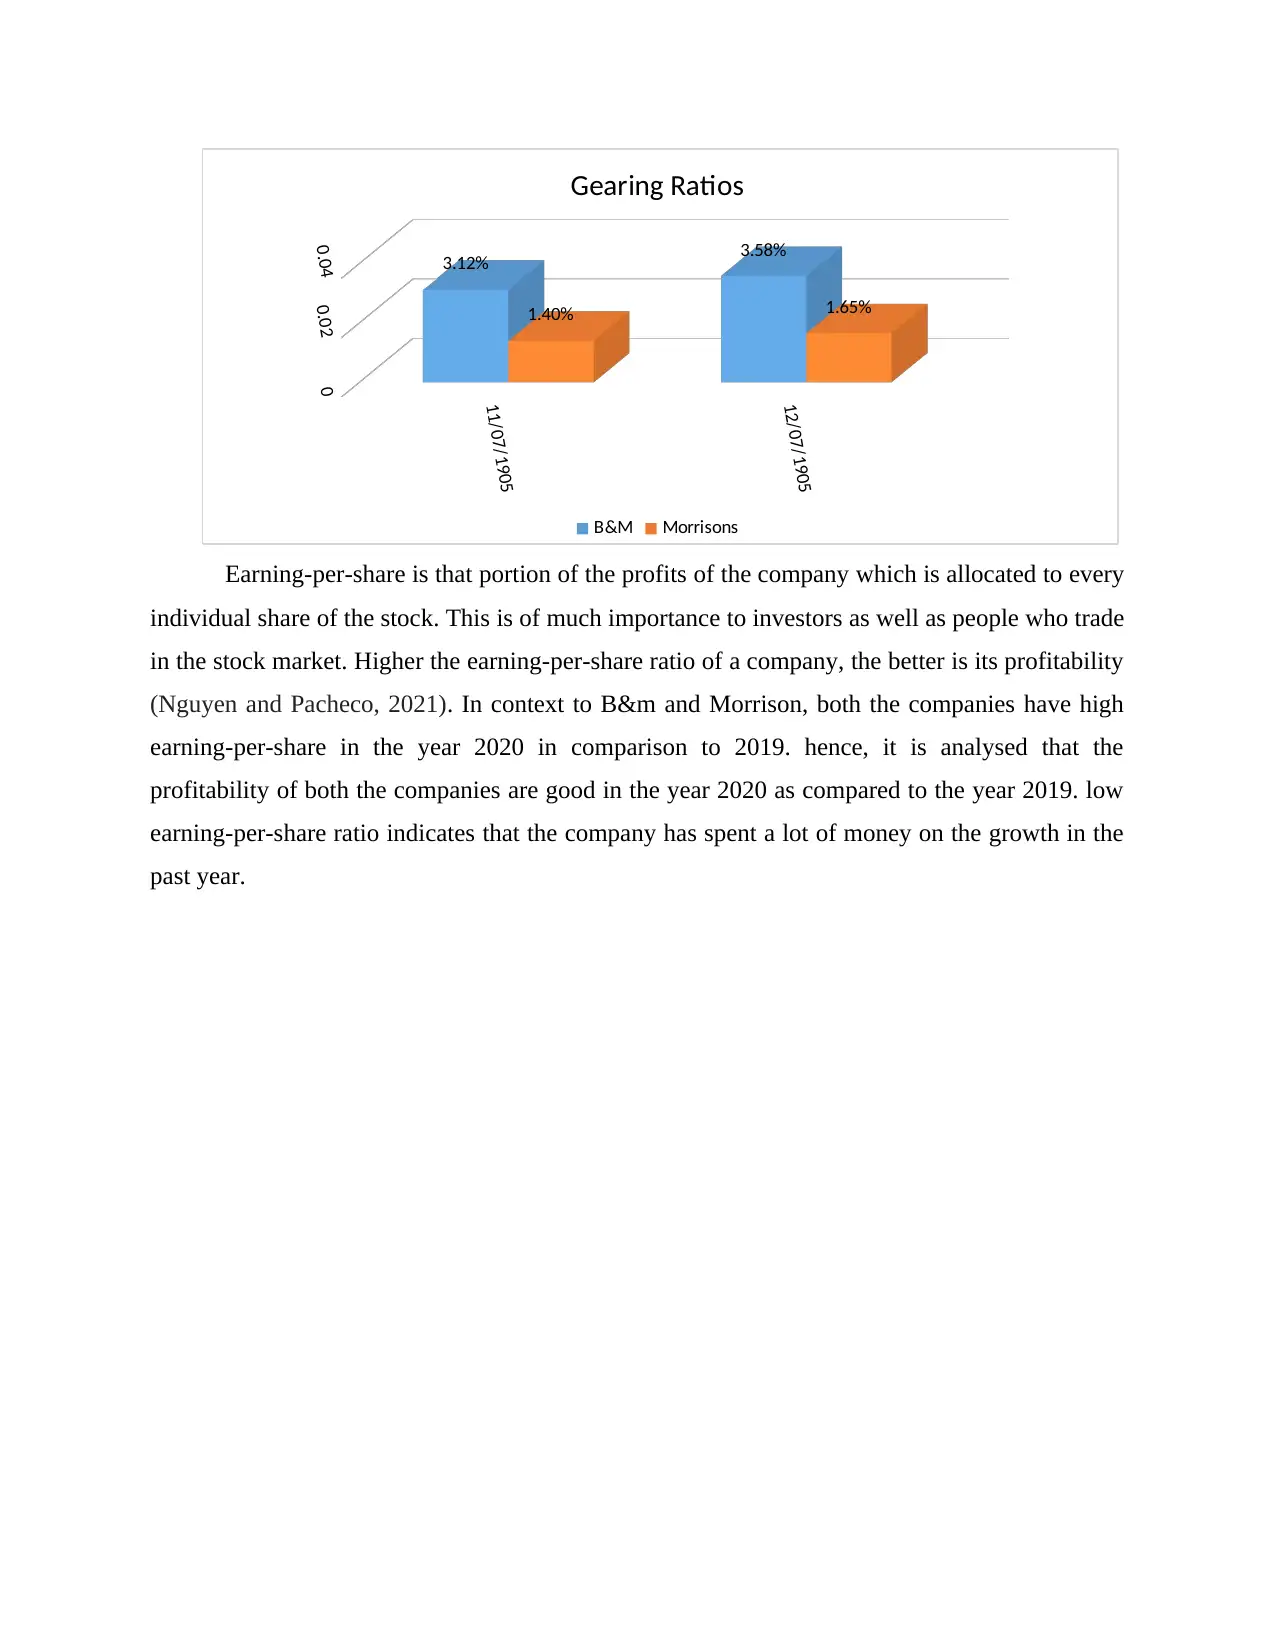
Gearing ratio shows the extent to which the operations of a company are funded by the
lenders versus shareholders and this ratio measures the financial leverage of the company
(Luong, Gunasekarage and Shams, 2021). In context to Morrison, there is low gearing ratio in
comparison to B&M and indicates that the company has a small proportion of the debts over the
equities of the company. The companies with low gearing ratio is considered as stable and have
low financial risk.
11/07/1905
12/07/1905
0
500
1000
422.79
744.56
31.75 26.42
Creditors Days
B&M Morrisons
to conserve their capital as much as possible. In context to B&M, the creditor's days is very high
and it means that the company is paying its suppliers more slowly and may be an indicator of
worsening financial condition. The creditor's days of Morrison is much better as compared to
B&M and states that the company is paying its suppliers in a fast way.
Gearing ratio shows the extent to which the operations of a company are funded by the
lenders versus shareholders and this ratio measures the financial leverage of the company
(Luong, Gunasekarage and Shams, 2021). In context to Morrison, there is low gearing ratio in
comparison to B&M and indicates that the company has a small proportion of the debts over the
equities of the company. The companies with low gearing ratio is considered as stable and have
low financial risk.
11/07/1905
12/07/1905
0
500
1000
422.79
744.56
31.75 26.42
Creditors Days
B&M Morrisons
⊘ This is a preview!⊘
Do you want full access?
Subscribe today to unlock all pages.
Trusted by 1+ million students worldwide
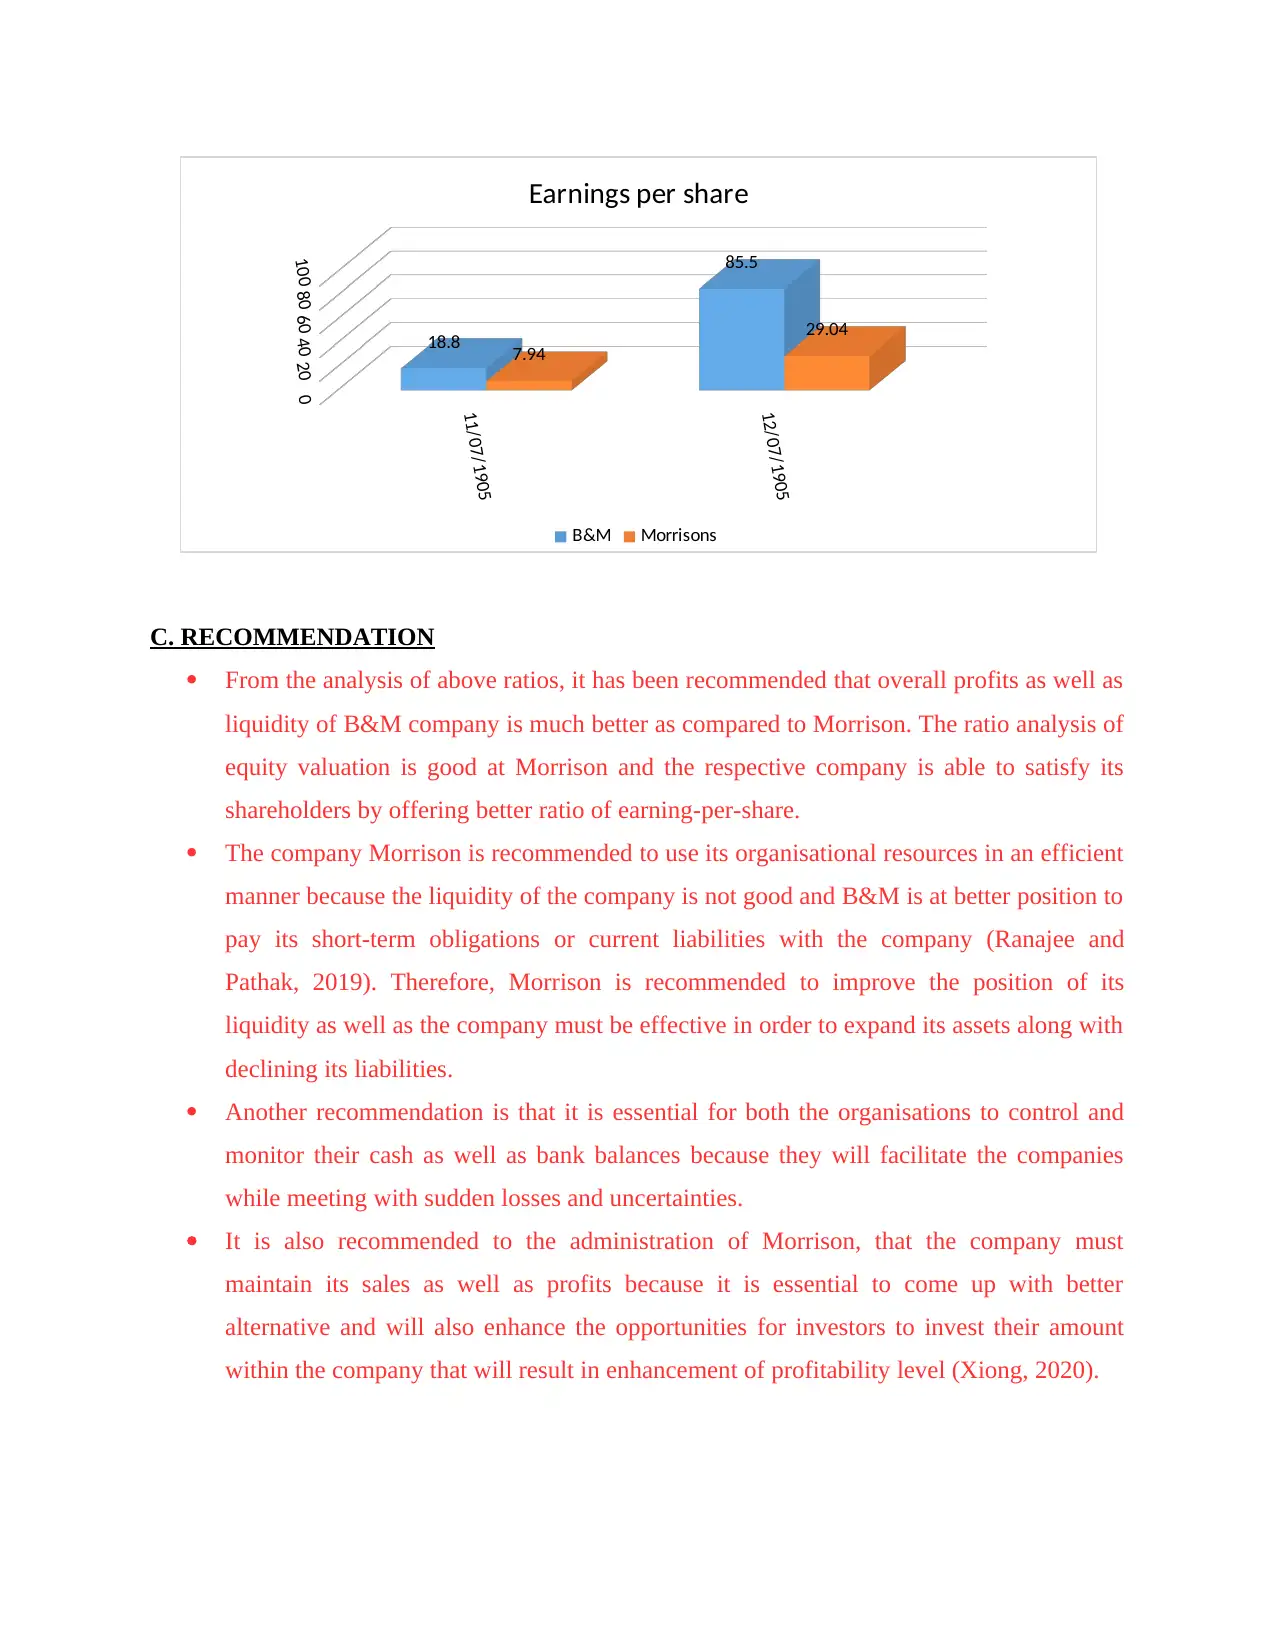
Earning-per-share is that portion of the profits of the company which is allocated to every
individual share of the stock. This is of much importance to investors as well as people who trade
in the stock market. Higher the earning-per-share ratio of a company, the better is its profitability
(Nguyen and Pacheco, 2021). In context to B&m and Morrison, both the companies have high
earning-per-share in the year 2020 in comparison to 2019. hence, it is analysed that the
profitability of both the companies are good in the year 2020 as compared to the year 2019. low
earning-per-share ratio indicates that the company has spent a lot of money on the growth in the
past year.
11/07/1905
12/07/1905
0
0.02
0.04 3.12% 3.58%
1.40% 1.65%
Gearing Ratios
B&M Morrisons
Paraphrase This Document
Need a fresh take? Get an instant paraphrase of this document with our AI Paraphraser
C. RECOMMENDATION
From the analysis of above ratios, it has been recommended that overall profits as well as
liquidity of B&M company is much better as compared to Morrison. The ratio analysis of
equity valuation is good at Morrison and the respective company is able to satisfy its
shareholders by offering better ratio of earning-per-share.
The company Morrison is recommended to use its organisational resources in an efficient
manner because the liquidity of the company is not good and B&M is at better position to
pay its short-term obligations or current liabilities with the company (Ranajee and
Pathak, 2019). Therefore, Morrison is recommended to improve the position of its
liquidity as well as the company must be effective in order to expand its assets along with
declining its liabilities.
Another recommendation is that it is essential for both the organisations to control and
monitor their cash as well as bank balances because they will facilitate the companies
while meeting with sudden losses and uncertainties.
It is also recommended to the administration of Morrison, that the company must
maintain its sales as well as profits because it is essential to come up with better
alternative and will also enhance the opportunities for investors to invest their amount
within the company that will result in enhancement of profitability level (Xiong, 2020).
11/07/1905
12/07/1905
020406080100
18.8
85.5
7.94
29.04
Earnings per share
B&M Morrisons
D. Limitations of Ratio Analysis:
In any technique of Financial Analysis, there are some limitations that are associated with
the techniques like Ratio Analysis that are identified at the time of their implementation or after
their interpretations. Some of the limitations of Ratio Analysis are explained as under:
Changes in interventions and policies: At the time of this financial analysis, if any
alterations in accounting procedure as well as policies occur then it impacts the financial
reports of the company and hence, come up with any of the interpretation or conclusion
will not be feasible and requires alterations as per the accounting policies.
Changes in Operations of business: Within business operations, there are always sone
alterations that are concerned with the operational structure and because of which the
supply chain strategy gives significant changes in the analysis of financials. It results in
misleading of the conclusion as well as performance of company and will not be
considered as an exact aspect and interpretation that could be observed after the changes.
Dependency on past information: The information used in this analysis is done on the
basis of the past performances and results which were declared by the companies.
Therefore, it cannot represents the performance of the future within the company (Zarin
and et.al, 2021). Just like B&M and Morrison, the ratio of the operations is given on the
basis of past performance of the company so it is not possible to ascertain the future
performance of the organisations.
Assumptions: While making an analysis of certain ratios, an analytics presumes the
certain amounts and ratio at the time of identifying this. It brings major alterations in
financial metrices as well as create biasness in the implementation and is not feasible.
This gives false results and makes the whole analysis unjustified to the absolute condition
in organisation. Within B&M and Morrison, if there are any such type of alterations
occur, then it will impact the whole performance of the companies.
Manipulations in the financial statements: In order to get better results in comparison
to past performance, the company sometimes makes manipulations in its operations
which results in inconsistent results. Therefore, it is not considered as an accurate image
of the performance of the company and will not give correct and appropriate financial
statements of the company. So it is essential for an analyst to be aware about these
practices.
⊘ This is a preview!⊘
Do you want full access?
Subscribe today to unlock all pages.
Trusted by 1+ million students worldwide
1 out of 17
Related Documents


Your All-in-One AI-Powered Toolkit for Academic Success.
+13062052269
info@desklib.com
Available 24*7 on WhatsApp / Email
![[object Object]](/_next/static/media/star-bottom.7253800d.svg)
Unlock your academic potential
Copyright © 2020–2026 A2Z Services. All Rights Reserved. Developed and managed by ZUCOL.