Finance Report: Coca-Cola Amatil Limited Financial Analysis - Item 2

Verified

Added on  2023/06/04

|13
|2006
|423
Report
AI Summary
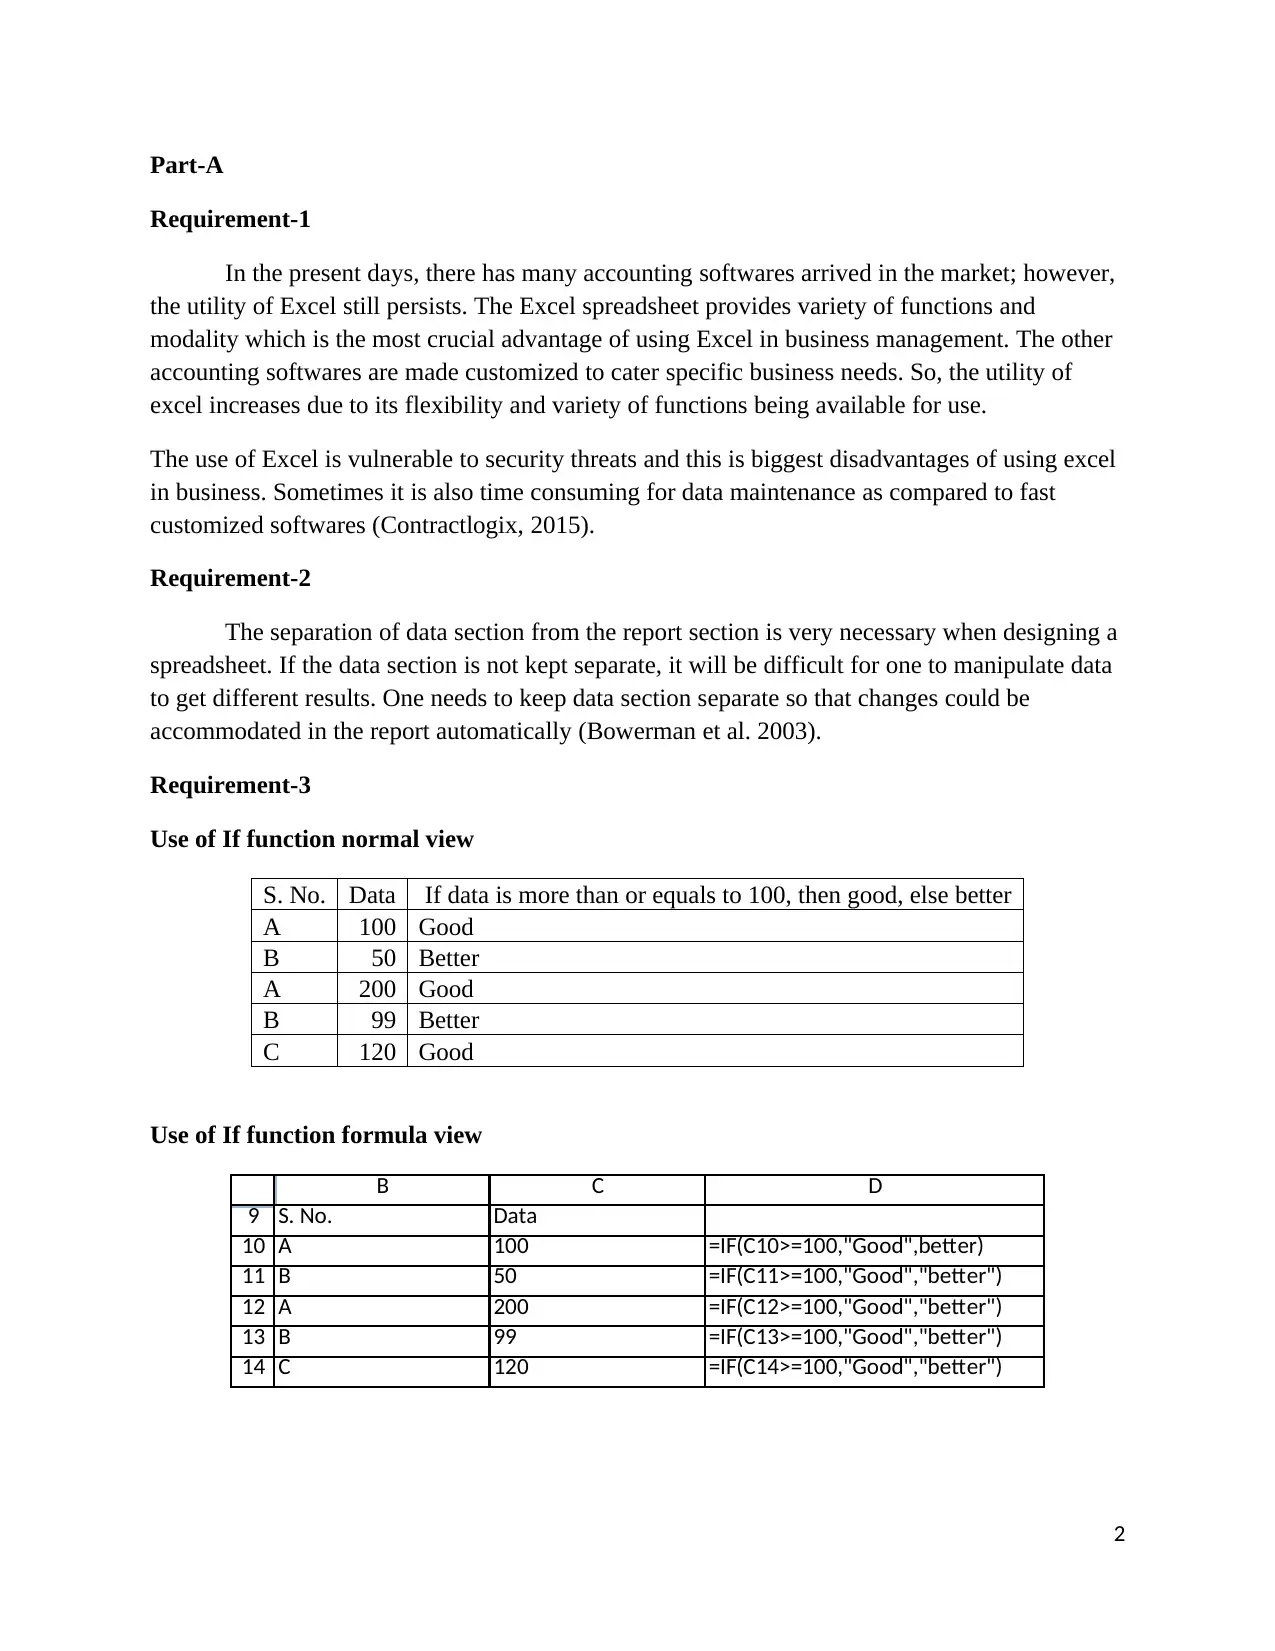
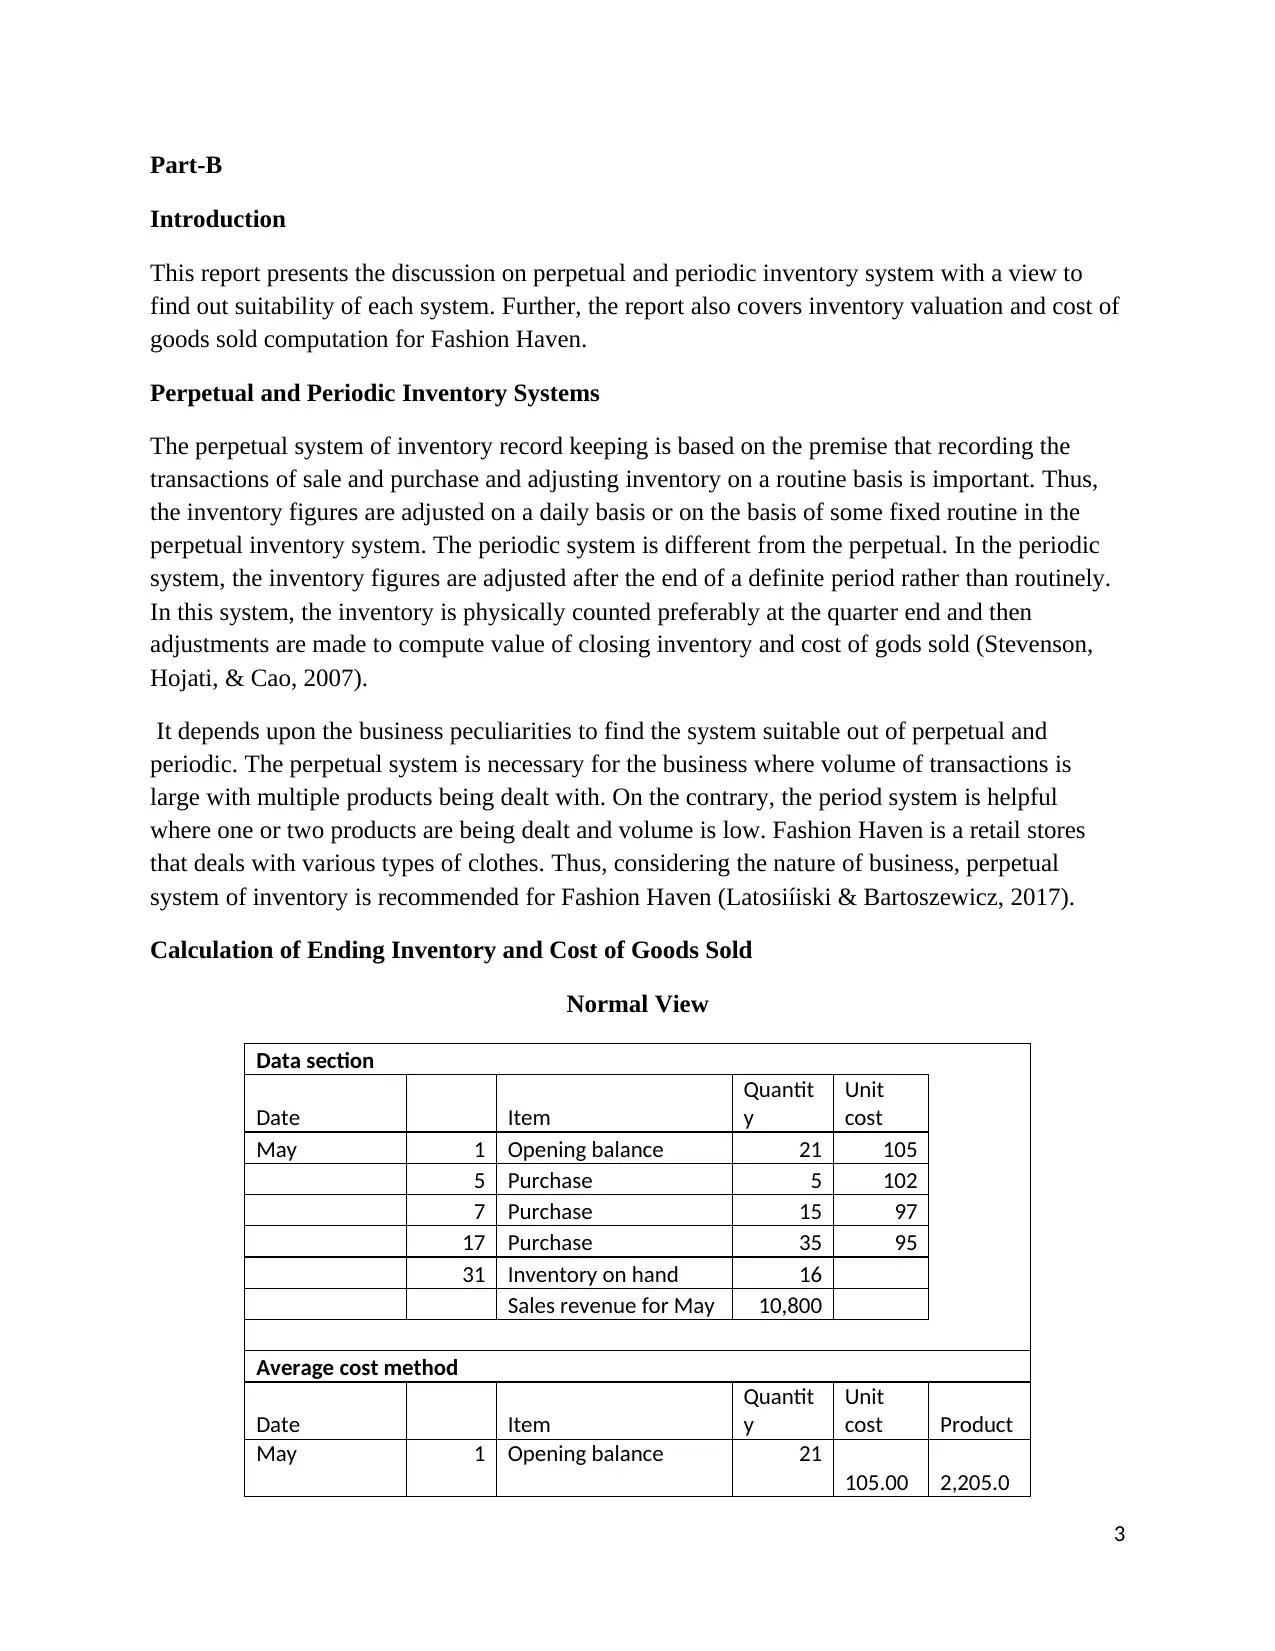
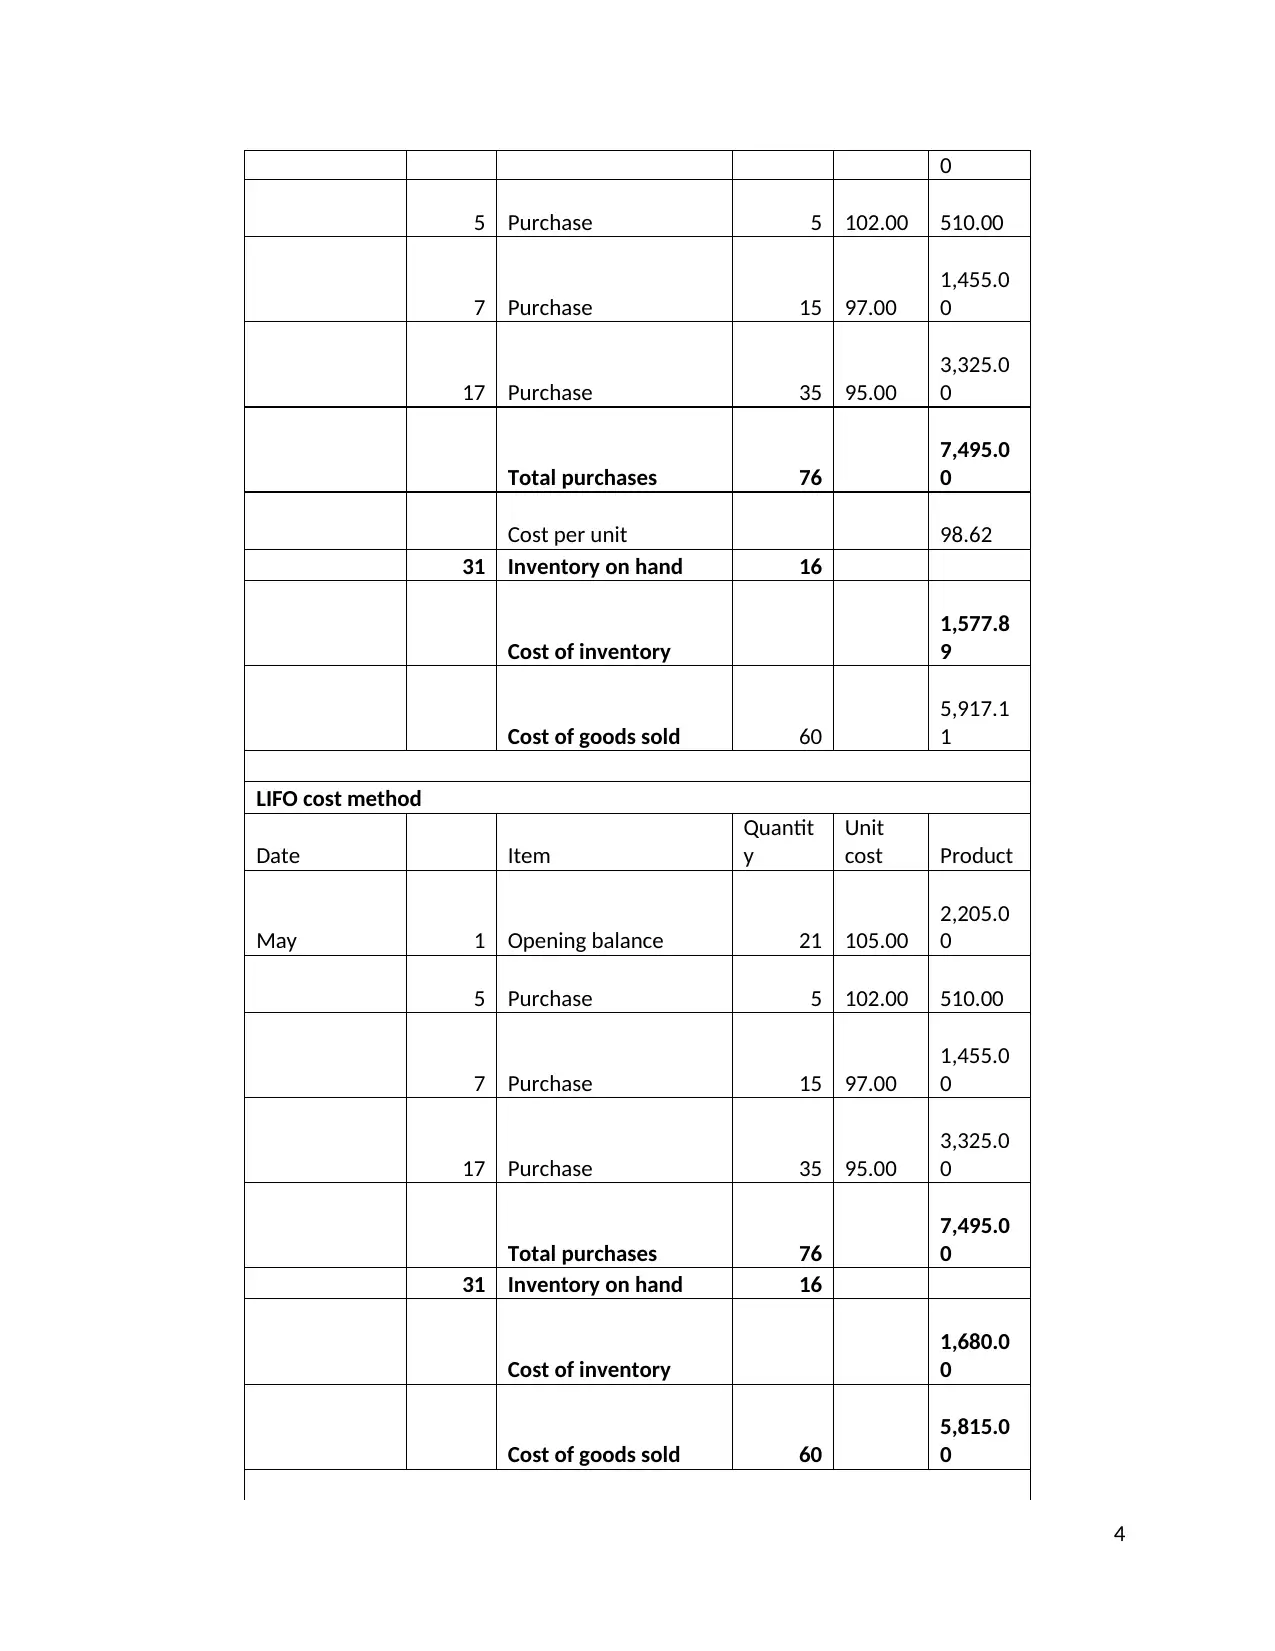
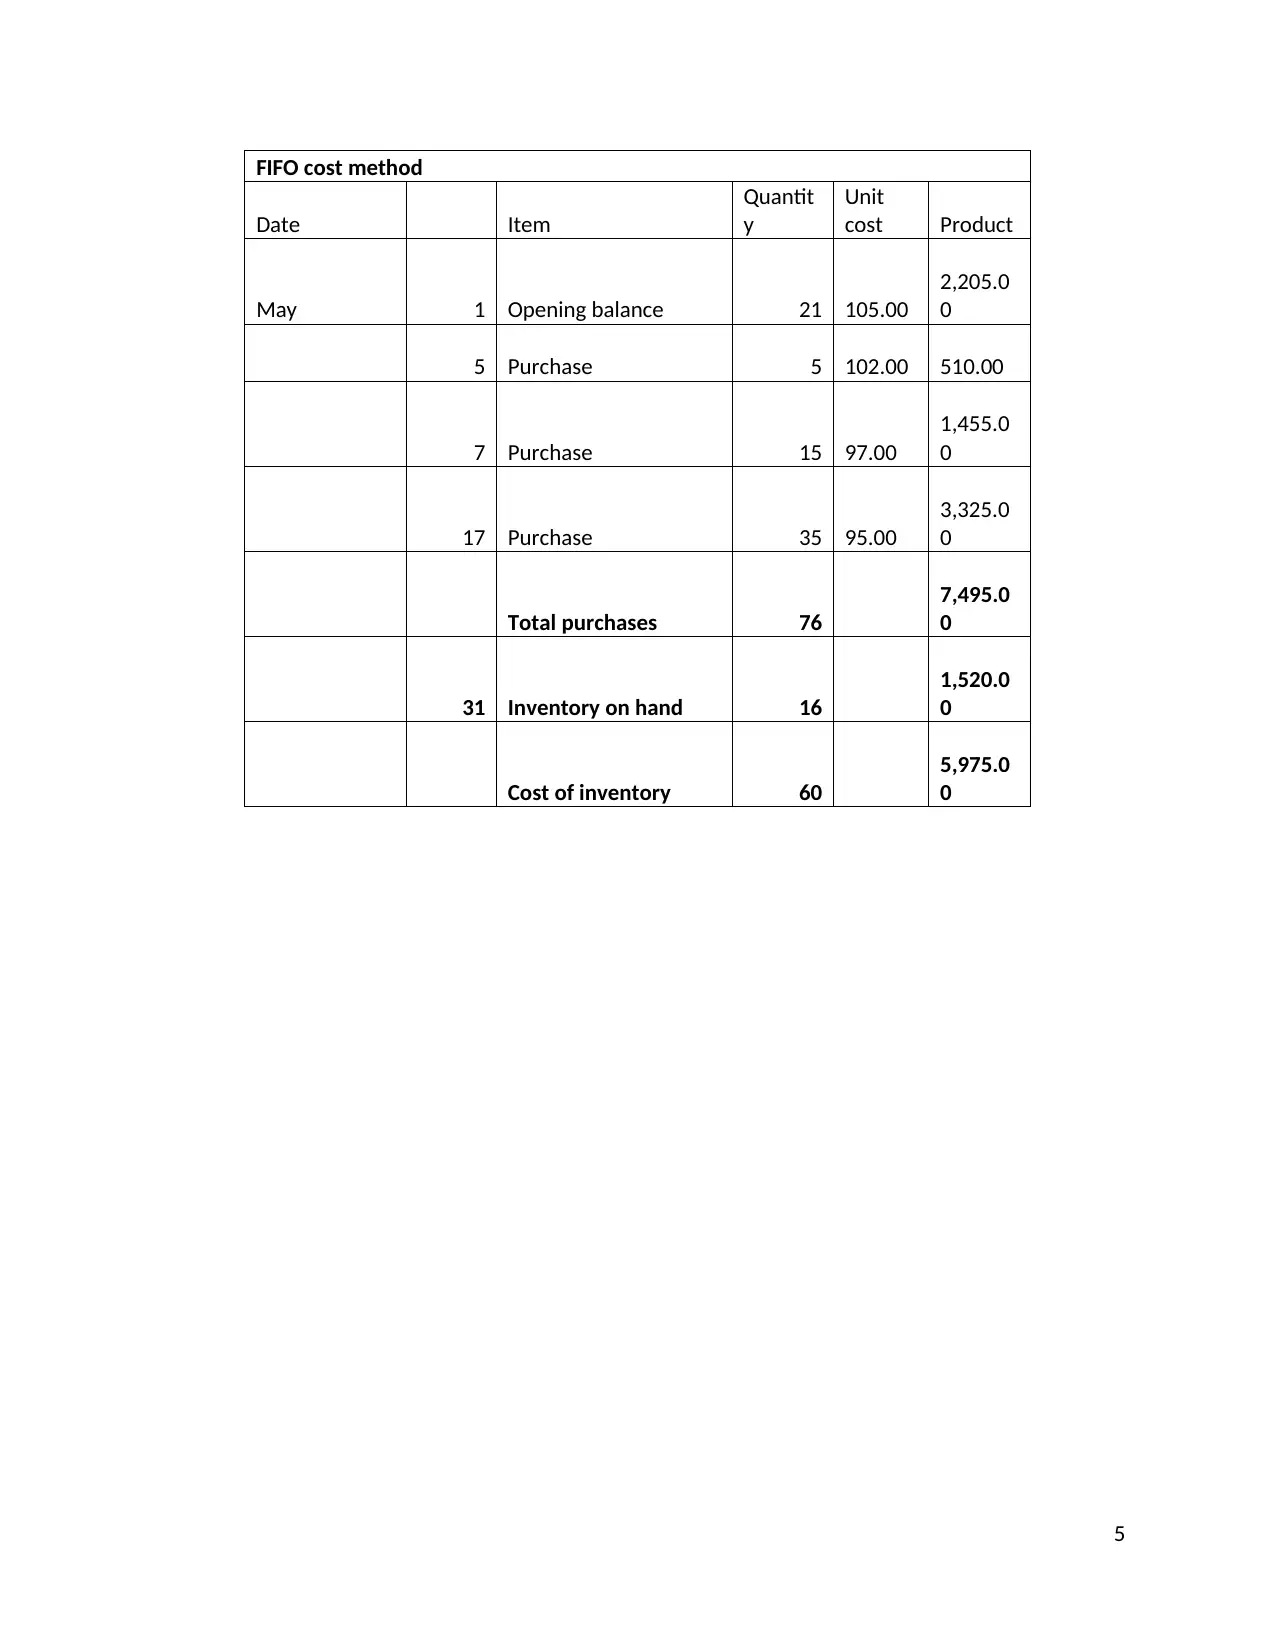
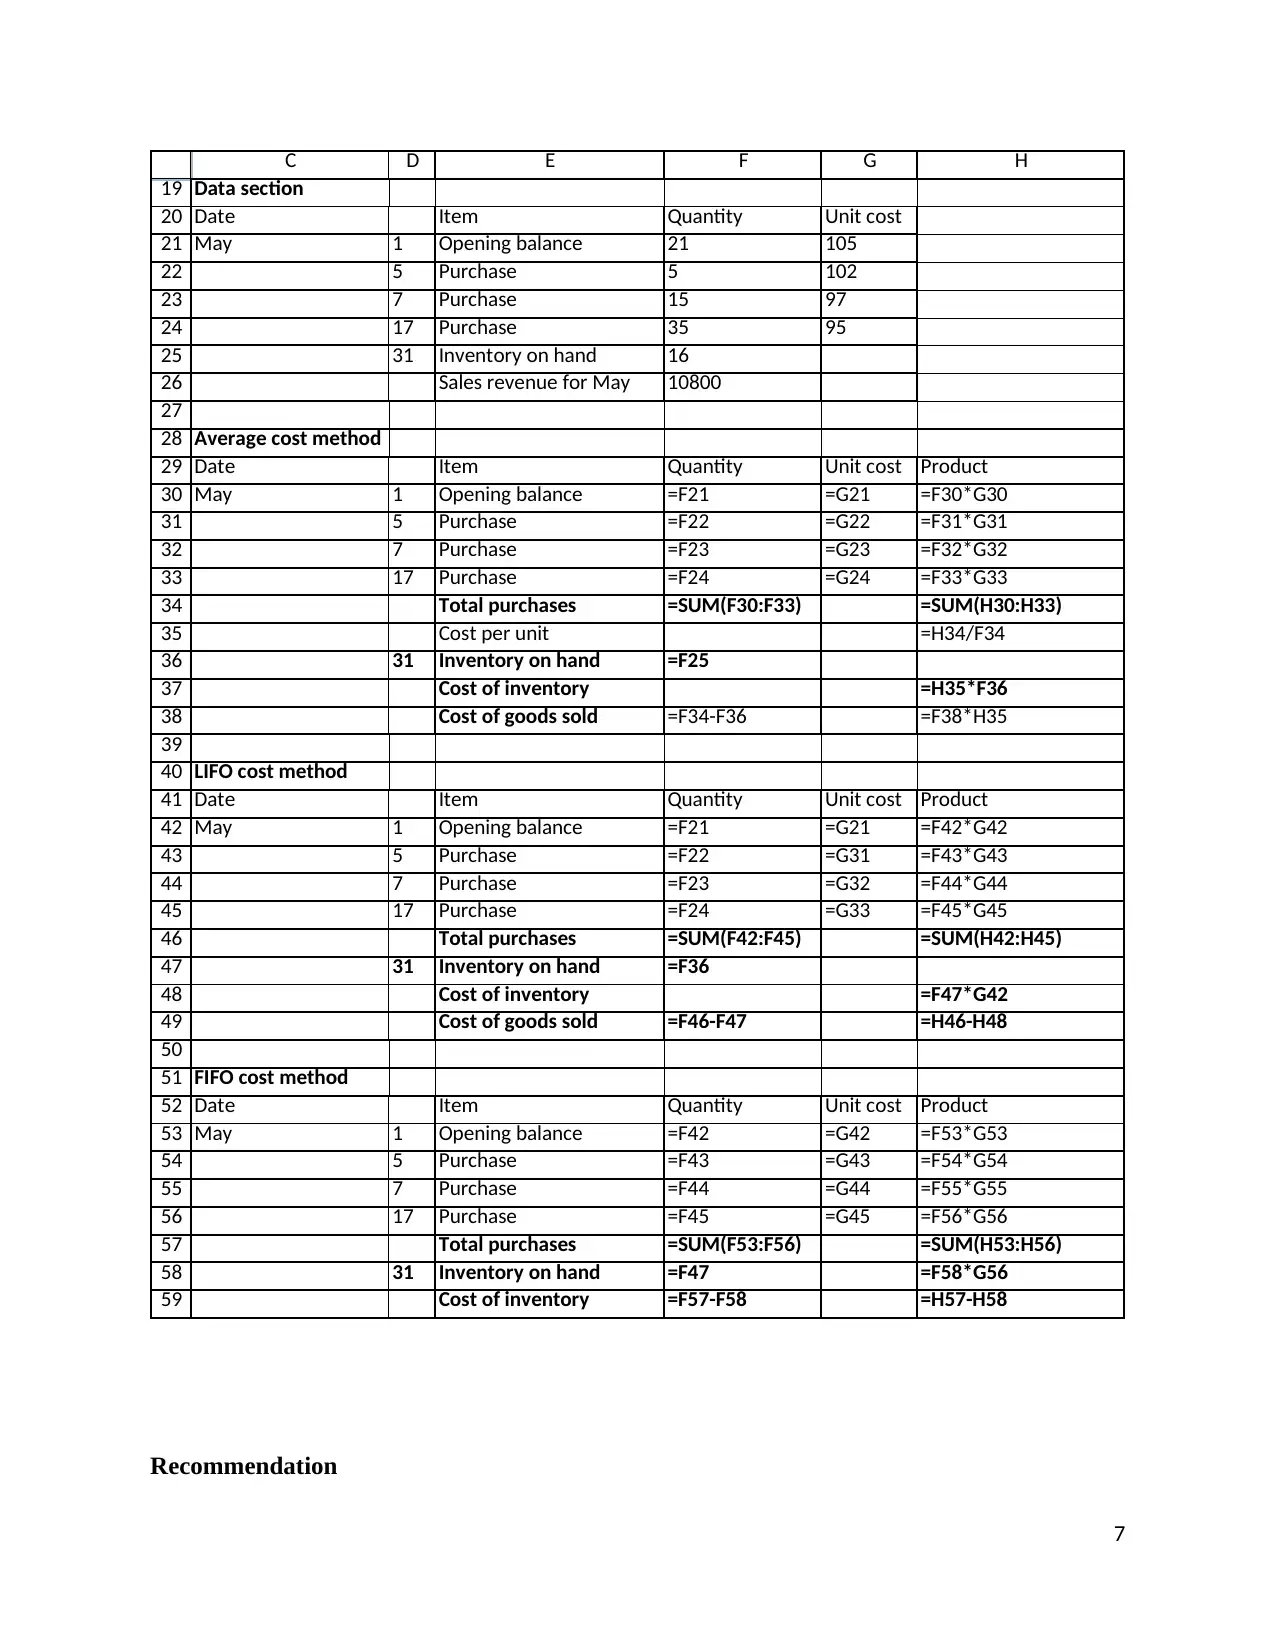
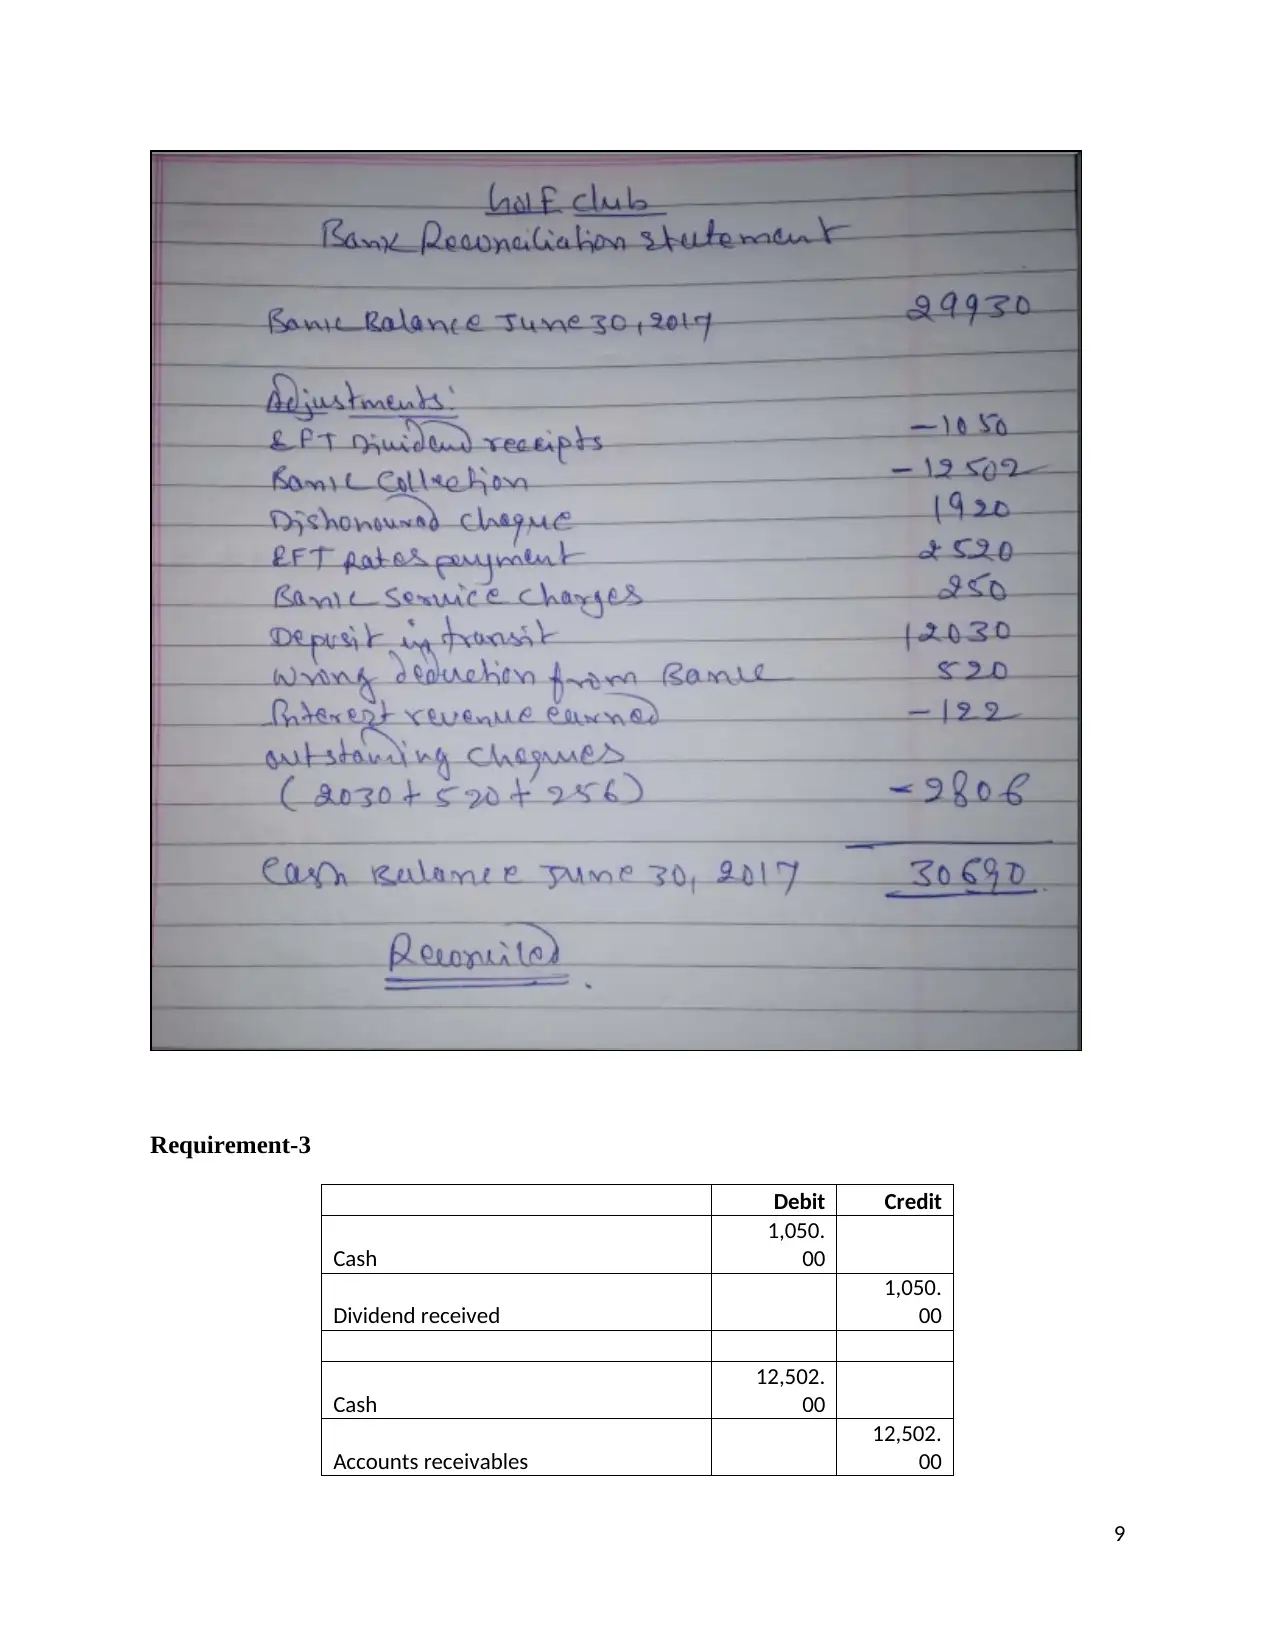
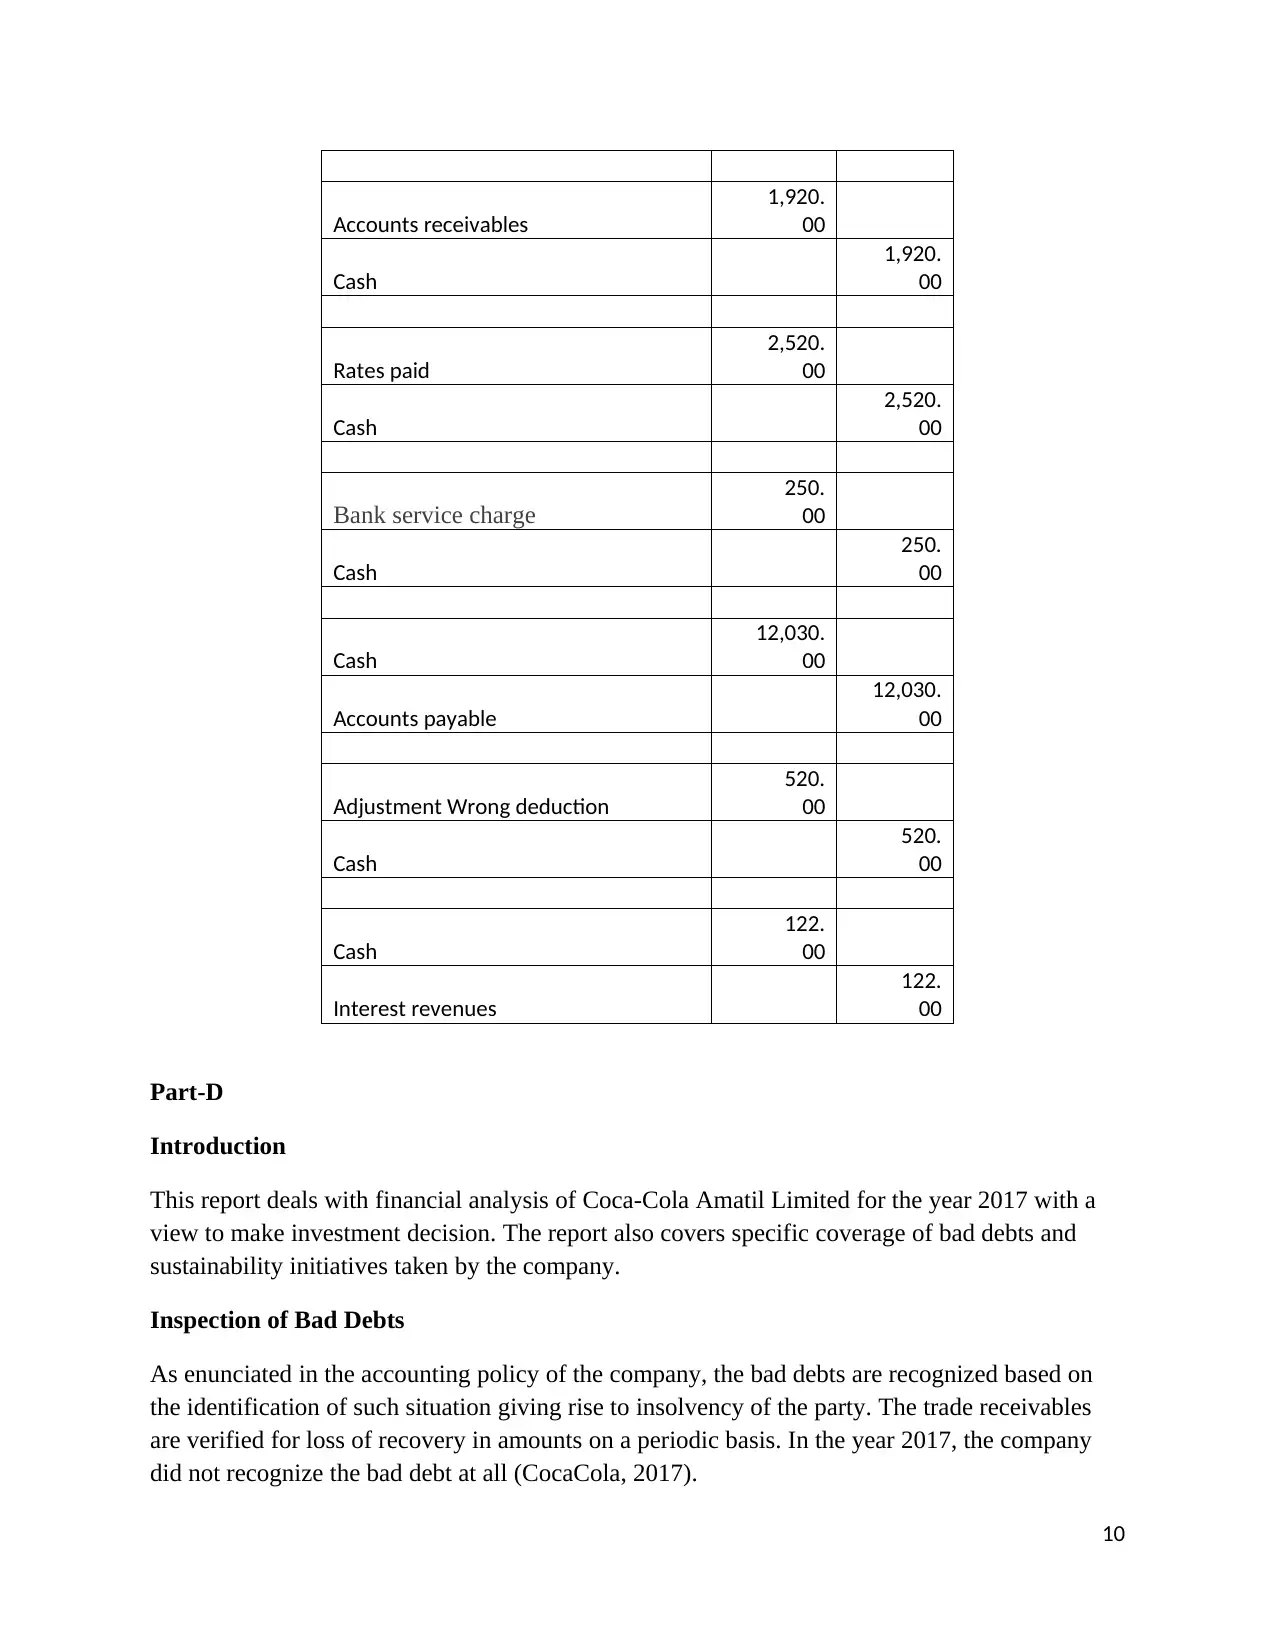
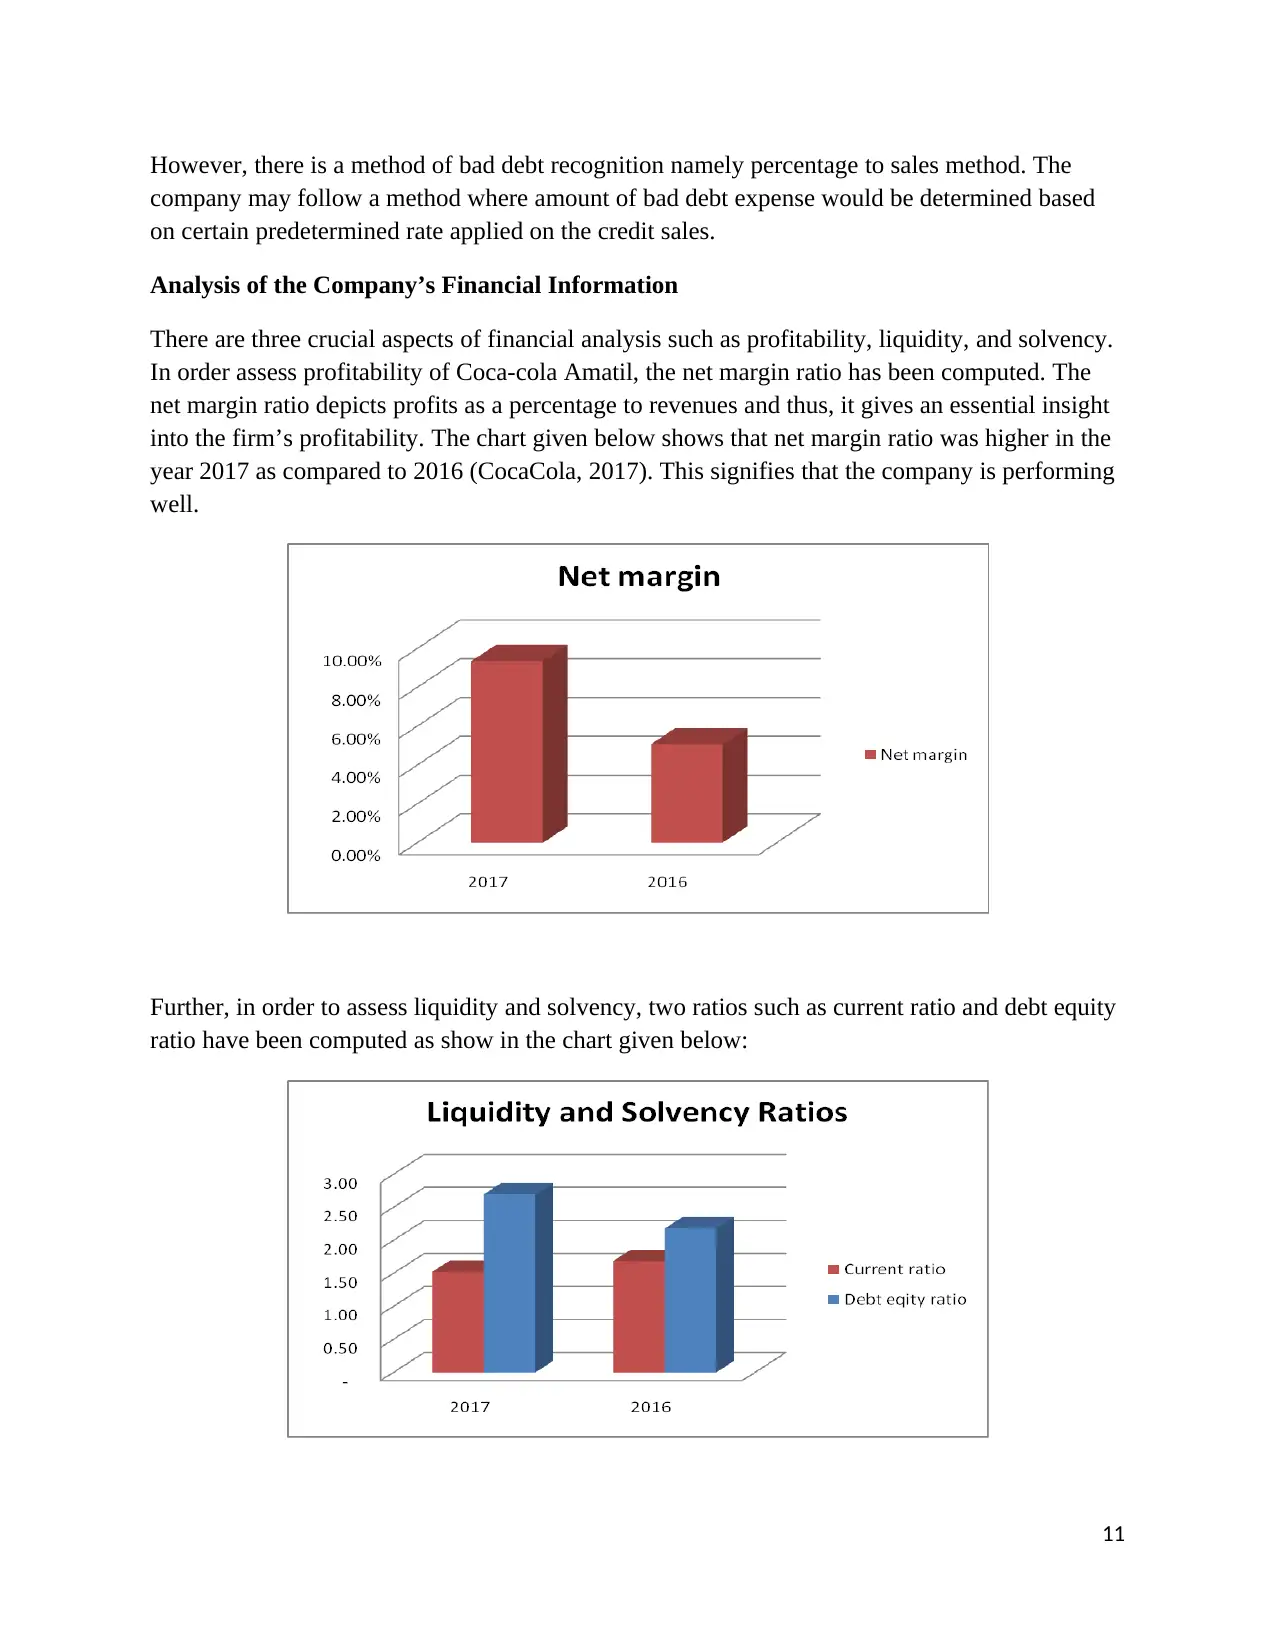
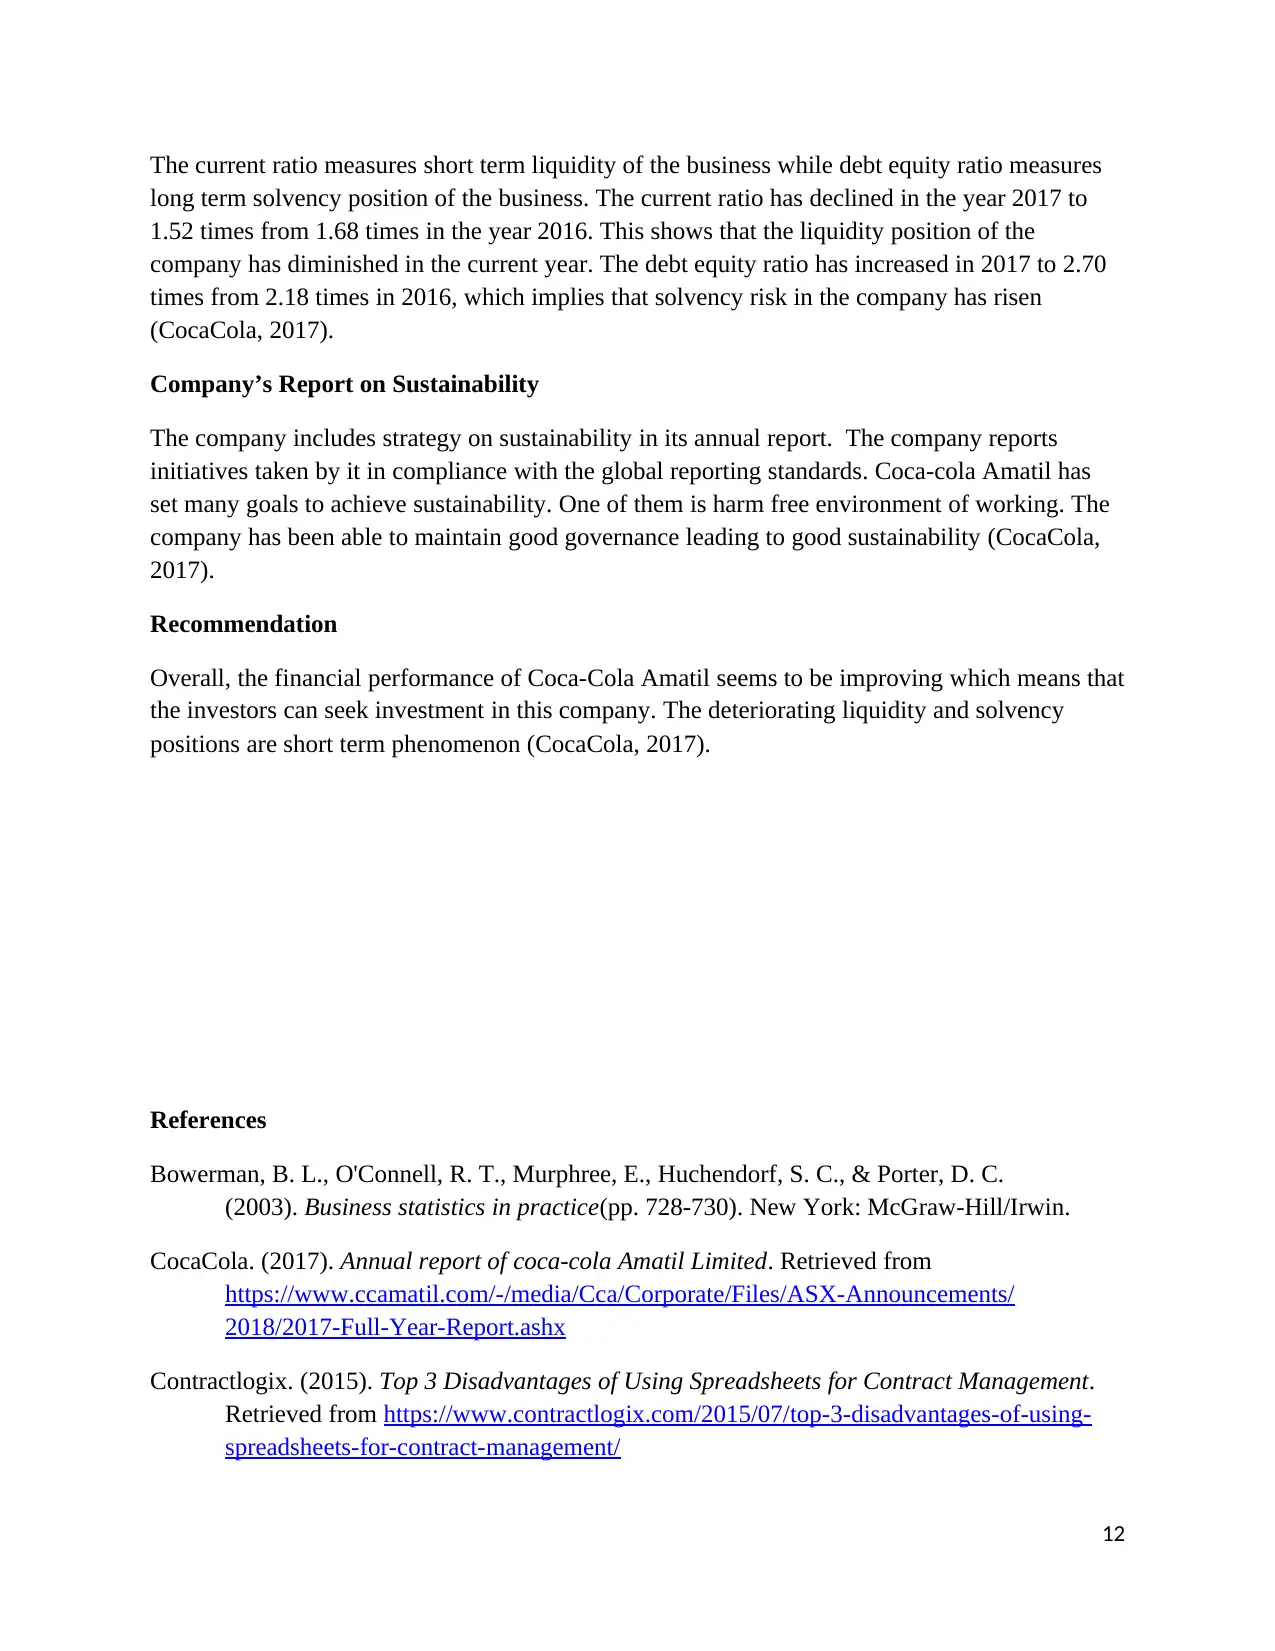
This report presents a comprehensive analysis of financial concepts and applications. Part A explores the continued use of spreadsheets in accounting despite the availability of specialized software, outlining their advantages and disadvantages, along with the importance of separating data and report sections. It demonstrates the use of IF functions and cell referencing within spreadsheets. Part B focuses on inventory management, comparing perpetual and periodic inventory systems and recommending the most suitable system for Fashion Haven. It then calculates ending inventory and cost of goods sold using average cost, LIFO, and FIFO methods. Part C examines bank reconciliation, detailing transactions impacting cash balances and journal entries. Part D provides a financial analysis of Coca-Cola Amatil Limited for 2017, including an inspection of bad debts, an analysis of key financial ratios (profitability, liquidity, and solvency), and a review of the company's sustainability initiatives, concluding with an investment recommendation.
Document Page
Assessment Item 2
1
tabler-icon-diamond-filled.svg

Paraphrase This Document

Need a fresh take? Get an instant paraphrase of this document with our AI Paraphraser
Document Page
Part-A
Requirement-1
In the present days, there has many accounting softwares arrived in the market; however,
the utility of Excel still persists. The Excel spreadsheet provides variety of functions and
modality which is the most crucial advantage of using Excel in business management. The other
accounting softwares are made customized to cater specific business needs. So, the utility of
excel increases due to its flexibility and variety of functions being available for use.
The use of Excel is vulnerable to security threats and this is biggest disadvantages of using excel
in business. Sometimes it is also time consuming for data maintenance as compared to fast
customized softwares (Contractlogix, 2015).
Requirement-2
The separation of data section from the report section is very necessary when designing a
spreadsheet. If the data section is not kept separate, it will be difficult for one to manipulate data
to get different results. One needs to keep data section separate so that changes could be
accommodated in the report automatically (Bowerman et al. 2003).
Requirement-3
Use of If function normal view
S. No. Data If data is more than or equals to 100, then good, else better
A 100 Good
B 50 Better
A 200 Good
B 99 Better
C 120 Good
Use of If function formula view
9
10
11
12
13
14
B C D
S. No. Data
A 100 =IF(C10>=100,"Good",better)
B 50 =IF(C11>=100,"Good","better")
A 200 =IF(C12>=100,"Good","better")
B 99 =IF(C13>=100,"Good","better")
C 120 =IF(C14>=100,"Good","better")
2
Document Page
Part-B
Introduction
This report presents the discussion on perpetual and periodic inventory system with a view to
find out suitability of each system. Further, the report also covers inventory valuation and cost of
goods sold computation for Fashion Haven.
Perpetual and Periodic Inventory Systems
The perpetual system of inventory record keeping is based on the premise that recording the
transactions of sale and purchase and adjusting inventory on a routine basis is important. Thus,
the inventory figures are adjusted on a daily basis or on the basis of some fixed routine in the
perpetual inventory system. The periodic system is different from the perpetual. In the periodic
system, the inventory figures are adjusted after the end of a definite period rather than routinely.
In this system, the inventory is physically counted preferably at the quarter end and then
adjustments are made to compute value of closing inventory and cost of gods sold (Stevenson,
Hojati, & Cao, 2007).
It depends upon the business peculiarities to find the system suitable out of perpetual and
periodic. The perpetual system is necessary for the business where volume of transactions is
large with multiple products being dealt with. On the contrary, the period system is helpful
where one or two products are being dealt and volume is low. Fashion Haven is a retail stores
that deals with various types of clothes. Thus, considering the nature of business, perpetual
system of inventory is recommended for Fashion Haven (Latosiíiski & Bartoszewicz, 2017).
Calculation of Ending Inventory and Cost of Goods Sold
Normal View
Data section
Date Item
Quantit
y
Unit
cost
May 1 Opening balance 21 105
5 Purchase 5 102
7 Purchase 15 97
17 Purchase 35 95
31 Inventory on hand 16
Sales revenue for May 10,800
Average cost method
Date Item
Quantit
y
Unit
cost Product
May 1 Opening balance 21
105.00 2,205.0
3
Document Page
0
5 Purchase 5 102.00 510.00
7 Purchase 15 97.00
1,455.0
0
17 Purchase 35 95.00
3,325.0
0
Total purchases 76
7,495.0
0
Cost per unit 98.62
31 Inventory on hand 16
Cost of inventory
1,577.8
9
Cost of goods sold 60
5,917.1
1
LIFO cost method
Date Item
Quantit
y
Unit
cost Product
May 1 Opening balance 21 105.00
2,205.0
0
5 Purchase 5 102.00 510.00
7 Purchase 15 97.00
1,455.0
0
17 Purchase 35 95.00
3,325.0
0
Total purchases 76
7,495.0
0
31 Inventory on hand 16
Cost of inventory
1,680.0
0
Cost of goods sold 60
5,815.0
0
4
tabler-icon-diamond-filled.svg

Paraphrase This Document

Need a fresh take? Get an instant paraphrase of this document with our AI Paraphraser
Document Page
FIFO cost method
Date Item
Quantit
y
Unit
cost Product
May 1 Opening balance 21 105.00
2,205.0
0
5 Purchase 5 102.00 510.00
7 Purchase 15 97.00
1,455.0
0
17 Purchase 35 95.00
3,325.0
0
Total purchases 76
7,495.0
0
31 Inventory on hand 16
1,520.0
0
Cost of inventory 60
5,975.0
0
5
Document Page
Formula View
6
Document Page
19
20
21
22
23
24
25
26
27
28
29
30
31
32
33
34
35
36
37
38
39
40
41
42
43
44
45
46
47
48
49
50
51
52
53
54
55
56
57
58
59
C D E F G H
Data section
Date Item Quantity Unit cost
May 1 Opening balance 21 105
5 Purchase 5 102
7 Purchase 15 97
17 Purchase 35 95
31 Inventory on hand 16
Sales revenue for May 10800
Average cost method
Date Item Quantity Unit cost Product
May 1 Opening balance =F21 =G21 =F30*G30
5 Purchase =F22 =G22 =F31*G31
7 Purchase =F23 =G23 =F32*G32
17 Purchase =F24 =G24 =F33*G33
Total purchases =SUM(F30:F33) =SUM(H30:H33)
Cost per unit =H34/F34
31 Inventory on hand =F25
Cost of inventory =H35*F36
Cost of goods sold =F34-F36 =F38*H35
LIFO cost method
Date Item Quantity Unit cost Product
May 1 Opening balance =F21 =G21 =F42*G42
5 Purchase =F22 =G31 =F43*G43
7 Purchase =F23 =G32 =F44*G44
17 Purchase =F24 =G33 =F45*G45
Total purchases =SUM(F42:F45) =SUM(H42:H45)
31 Inventory on hand =F36
Cost of inventory =F47*G42
Cost of goods sold =F46-F47 =H46-H48
FIFO cost method
Date Item Quantity Unit cost Product
May 1 Opening balance =F42 =G42 =F53*G53
5 Purchase =F43 =G43 =F54*G54
7 Purchase =F44 =G44 =F55*G55
17 Purchase =F45 =G45 =F56*G56
Total purchases =SUM(F53:F56) =SUM(H53:H56)
31 Inventory on hand =F47 =F58*G56
Cost of inventory =F57-F58 =H57-H58
Recommendation
7
tabler-icon-diamond-filled.svg

Paraphrase This Document

Need a fresh take? Get an instant paraphrase of this document with our AI Paraphraser
Document Page
The cost of inventory is $1,577.89, $1,680, and $1,520 under average cost method, LIFO, and
FIFO method respectively. Fashion Haven is in the business of retail sales of clothes which is
highly dynamic in nature and keeps changing with innovation. Thus, the company should follow
FIFO system of inventory valuation.
Part-C
Requirement-1
The wrong deduction from the bank account of $520 is the transaction which will decrease the
cash balance on preparing reconciliation. Similarly, outstanding cheque of $520 will decrease the
balance of bank (Sian & Roberts, 2009).
Requirement-2
8
Document Page
Requirement-3
Debit Credit
Cash
1,050.
00
Dividend received
1,050.
00
Cash
12,502.
00
Accounts receivables
12,502.
00
9
Document Page
Accounts receivables
1,920.
00
Cash
1,920.
00
Rates paid
2,520.
00
Cash
2,520.
00
Bank service charge
250.
00
Cash
250.
00
Cash
12,030.
00
Accounts payable
12,030.
00
Adjustment Wrong deduction
520.
00
Cash
520.
00
Cash
122.
00
Interest revenues
122.
00
Part-D
Introduction
This report deals with financial analysis of Coca-Cola Amatil Limited for the year 2017 with a
view to make investment decision. The report also covers specific coverage of bad debts and
sustainability initiatives taken by the company.
Inspection of Bad Debts
As enunciated in the accounting policy of the company, the bad debts are recognized based on
the identification of such situation giving rise to insolvency of the party. The trade receivables
are verified for loss of recovery in amounts on a periodic basis. In the year 2017, the company
did not recognize the bad debt at all (CocaCola, 2017).
10
tabler-icon-diamond-filled.svg

Paraphrase This Document

Need a fresh take? Get an instant paraphrase of this document with our AI Paraphraser
Document Page
However, there is a method of bad debt recognition namely percentage to sales method. The
company may follow a method where amount of bad debt expense would be determined based
on certain predetermined rate applied on the credit sales.
Analysis of the Company’s Financial Information
There are three crucial aspects of financial analysis such as profitability, liquidity, and solvency.
In order assess profitability of Coca-cola Amatil, the net margin ratio has been computed. The
net margin ratio depicts profits as a percentage to revenues and thus, it gives an essential insight
into the firm’s profitability. The chart given below shows that net margin ratio was higher in the
year 2017 as compared to 2016 (CocaCola, 2017). This signifies that the company is performing
well.
Further, in order to assess liquidity and solvency, two ratios such as current ratio and debt equity
ratio have been computed as show in the chart given below:
11
Document Page
The current ratio measures short term liquidity of the business while debt equity ratio measures
long term solvency position of the business. The current ratio has declined in the year 2017 to
1.52 times from 1.68 times in the year 2016. This shows that the liquidity position of the
company has diminished in the current year. The debt equity ratio has increased in 2017 to 2.70
times from 2.18 times in 2016, which implies that solvency risk in the company has risen
(CocaCola, 2017).
Company’s Report on Sustainability
The company includes strategy on sustainability in its annual report. The company reports
initiatives taken by it in compliance with the global reporting standards. Coca-cola Amatil has
set many goals to achieve sustainability. One of them is harm free environment of working. The
company has been able to maintain good governance leading to good sustainability (CocaCola,
2017).
Recommendation
Overall, the financial performance of Coca-Cola Amatil seems to be improving which means that
the investors can seek investment in this company. The deteriorating liquidity and solvency
positions are short term phenomenon (CocaCola, 2017).
References
Bowerman, B. L., O'Connell, R. T., Murphree, E., Huchendorf, S. C., & Porter, D. C.
(2003). Business statistics in practice(pp. 728-730). New York: McGraw-Hill/Irwin.
CocaCola. (2017). Annual report of coca-cola Amatil Limited. Retrieved from
https://www.ccamatil.com/-/media/Cca/Corporate/Files/ASX-Announcements/
2018/2017-Full-Year-Report.ashx
Contractlogix. (2015). Top 3 Disadvantages of Using Spreadsheets for Contract Management.
Retrieved from https://www.contractlogix.com/2015/07/top-3-disadvantages-of-using-
spreadsheets-for-contract-management/
12
chevron_up_icon
1 out of 13
circle_padding
hide_on_mobile
zoom_out_icon
[object Object]