Financial Performance, Funding, and Pricing in Travel and Tourism
VerifiedAdded on 2019/12/28
|13
|4626
|201
Report
AI Summary
This report delves into the financial aspects of the travel and tourism industry, focusing on cost-volume-profit (CVP) analysis, pricing strategies, and financial performance evaluation. It examines how Merlin Entertainment Plc (MEP) can utilize CVP analysis, including break-even analysis, contribution margin, profit margin, and profit volume ratio, to make informed decisions. The report also explores various pricing methods, such as cost-oriented, competition-based, and demand-based pricing, to optimize revenue generation. Furthermore, it analyzes the impact of factors like selling price, cost of goods, sales volume, and market fluctuations on profitability. The report also includes financial statement analysis, utilizing ratio analysis to assess the performance of The Restaurant Group (TRG) and identifies different funding sources available to companies in the sector.
Finance and Funding in Travel and Tourism
1
1
Paraphrase This Document
Need a fresh take? Get an instant paraphrase of this document with our AI Paraphraser
Table of Contents
INTRODUCTION................................................................................................................................3
TASK 1.................................................................................................................................................3
1.1....................................................................................................................................................3
1.2....................................................................................................................................................4
1.3....................................................................................................................................................6
TASK 2.................................................................................................................................................7
TASK 3.................................................................................................................................................7
3.1....................................................................................................................................................7
TASK 4.................................................................................................................................................9
4.1....................................................................................................................................................9
CONCLUSION..................................................................................................................................10
REFERENCES...................................................................................................................................11
2
INTRODUCTION
Travel and tourism sector is service-oriented enterprises operates in hospitality industry which
objective is to deliver wide range of services like lodging, travelling, entertainment and many
others. All the establishments that operate in the sector require procuring adequate quantity of funds
and managing it adequately so as to generate maximum return and fulfil financial objectives.
Moreover, with the changing market conditions and customer preferences, it becomes essential for
the entities to make sure proper funds availability, so that, they can respond quickly market
challenges and manage risk as well. The aim of the present project report is to acquire knowledge
and skills that will assist management to make best quality of decisions for the smooth functioning.
Moreover, the significance of cost, volume and profit analysis will be demonstrated, through which,
travel and tourism companies can manage their operations successfully. Along with this, the report
will also explain various pricing methods by which Merlin Entertainment Plc can decide their
product prices for revenue collection. At the end, assignment will interpret annual statement of The
Restaurant Group (TRG) to examine and evaluate the operational performance and financial
strength. Along with this, report will also explain different type of funding sources whereby
companies can raise money to meet their capital requirement.
TASK 1
1.1
According to the given scenario, Merlin Entertainment Plc (MEP) is a United Kingdom based
entertainment company which is operation around 115 attractions in 23 countries across four
continents. It is running its operations through three segments that are Midway Attraction,
LEGOLAND Parks and Resort Theme Parks. Out of these, first segment conduct limited number of
operations as it is located in city centers and resorts, while, LEGOLAND Park comprises LEGO
themed accommodation, rides and shows as well. Similarly, Resort Themes Parks encompasses
rides, accommodation and shows.
With the volatility in consumer demand, tough competition, high pricing pressure, MEP’s
managers are responsible to manage their business cost and maximize their return. Cost-Volume-
profit (CVP) analysis is an effective technique which companies can use to measure the impact of
volatility in cost and volume on their operational expenditures and net yield (Altinay and et.al.,
2015). CVP technique works as an important managerial way that will assist MEP’s managers to
examine the relationship between business cost and their overall return. With the help of this, they
can identify that how changes in cost of goods production and distribution will bring changes in net
3
⊘ This is a preview!⊘
Do you want full access?
Subscribe today to unlock all pages.
Trusted by 1+ million students worldwide
profitability. Cutting-down of both fixed and variable cost and larger sales volume are the basic
ways to improve net earnings. CVP analysis is of great importance because through applying this
model in business practice, MEP can determine the most profitable combination so as to generate
greater yield (Quattrone, 2016). This mechanism assists companies in making effective short-term
decisions and reach targets easily. The significance of CVP tool for MEP is outlined below:
Break-even analysis: The most important benefit of CVP analysis is that it will assist MEP to
determine their break-even point (BEP). It represents the situation at where cost becomes similar to
the total revenue that is a sign of maximum and optimal utilization of available business resources.
It is necessary for the company to know their BEP because through this, they can identify that how
much units they are essential require to sale to cover their total cost and thereby eliminate the
possibility of loss. Every additional unit after this level contributes towards more profitability while
if MEP made less sales than it will bear loss.
Contribution: According to marginal costing practices in cost accounting, contribution
represents the different between total turnover and variable cost. Thus, it does not take into account
fixed cost because MEP will have to bear such expenditures even at the time of nil production. In
such regards, variable expenditures are those which will be increase simultaneously with the
increase in sales volume (WisCombe and et.al., 2016). However, fixed expenditure remains constant
and does not tend to vary according to the change in output. With regards to MEP, its variable cost
comprises meal cost, cost of entertainment services, accommodation facilities etc. Through
employing CVP analysis, it can determine their contribution margin by subtracting total variable
cost from the total sales. Thus, by controlling of variable expenditures and larger turnover, MEP
will be able to maximize their contribution to a great extent.
Profit margin: Contribution less of total fixed cost represents net yield or profit. Referring
MEP, insurance, depreciation, rent of premises etc. are the fixed cost which business needs to bear
even when it does not produce a single unit of product or service (Camilleri, 2015). CVP analysis
enables entrepreneur to determine their net yield by deducting their total of fixed and variable cost
from total turnover.
Profit volume ratio: PVR measure the contribution percentage over the total sales revenues.
Higher the contribution % is a good sign of business return because it indicates that MEP has
maintained an effective control over variable cost so as to enlarge their contribution.
1.2
Not only the determination of cost is sufficient, but also, it is essential for MEP to set correct
selling price for their goods and services offered to the consumers. It is because; very high product
4
Paraphrase This Document
Need a fresh take? Get an instant paraphrase of this document with our AI Paraphraser
price will result in loss of customers whereas very little charges will negatively impact total sales
revenue and profitability as well. Thus, prices must be decided to an acceptable or affordable level
at which consumers will be willing to buy services and at the same time, company also can gather
sufficient return at such prices (Chang, 2013). There are wide ranges of pricing techniques and
methods available to the MEP to determine their prices at which they will offer services to the
audiences, presented here as under:
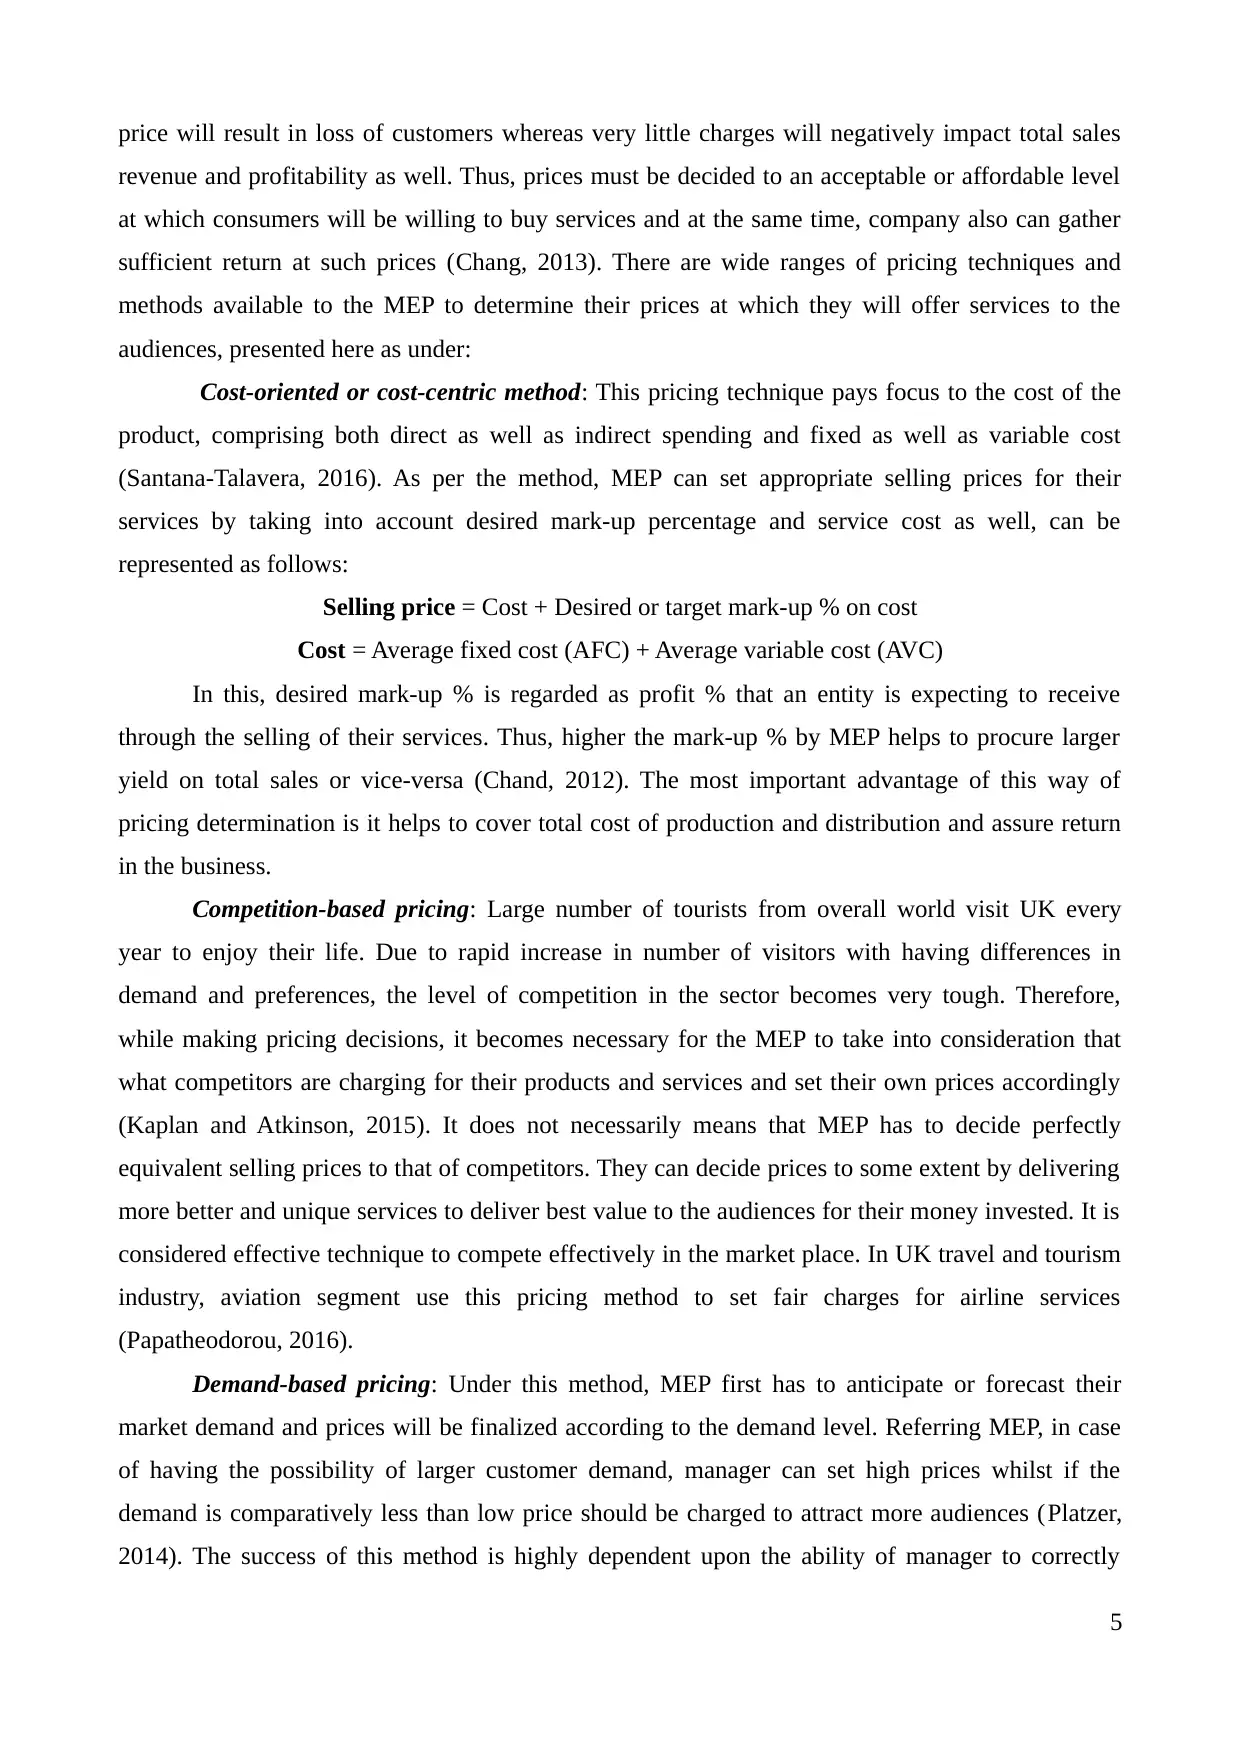
Cost-oriented or cost-centric method: This pricing technique pays focus to the cost of the
product, comprising both direct as well as indirect spending and fixed as well as variable cost
(Santana-Talavera, 2016). As per the method, MEP can set appropriate selling prices for their
services by taking into account desired mark-up percentage and service cost as well, can be
represented as follows:
Selling price = Cost + Desired or target mark-up % on cost
Cost = Average fixed cost (AFC) + Average variable cost (AVC)
In this, desired mark-up % is regarded as profit % that an entity is expecting to receive
through the selling of their services. Thus, higher the mark-up % by MEP helps to procure larger
yield on total sales or vice-versa (Chand, 2012). The most important advantage of this way of
pricing determination is it helps to cover total cost of production and distribution and assure return
in the business.
Competition-based pricing: Large number of tourists from overall world visit UK every
year to enjoy their life. Due to rapid increase in number of visitors with having differences in
demand and preferences, the level of competition in the sector becomes very tough. Therefore,
while making pricing decisions, it becomes necessary for the MEP to take into consideration that
what competitors are charging for their products and services and set their own prices accordingly
(Kaplan and Atkinson, 2015). It does not necessarily means that MEP has to decide perfectly
equivalent selling prices to that of competitors. They can decide prices to some extent by delivering
more better and unique services to deliver best value to the audiences for their money invested. It is
considered effective technique to compete effectively in the market place. In UK travel and tourism
industry, aviation segment use this pricing method to set fair charges for airline services
(Papatheodorou, 2016).
Demand-based pricing: Under this method, MEP first has to anticipate or forecast their
market demand and prices will be finalized according to the demand level. Referring MEP, in case
of having the possibility of larger customer demand, manager can set high prices whilst if the
demand is comparatively less than low price should be charged to attract more audiences (Platzer,
2014). The success of this method is highly dependent upon the ability of manager to correctly
5
revenue and profitability as well. Thus, prices must be decided to an acceptable or affordable level
at which consumers will be willing to buy services and at the same time, company also can gather
sufficient return at such prices (Chang, 2013). There are wide ranges of pricing techniques and
methods available to the MEP to determine their prices at which they will offer services to the
audiences, presented here as under:
Cost-oriented or cost-centric method: This pricing technique pays focus to the cost of the
product, comprising both direct as well as indirect spending and fixed as well as variable cost
(Santana-Talavera, 2016). As per the method, MEP can set appropriate selling prices for their
services by taking into account desired mark-up percentage and service cost as well, can be
represented as follows:
Selling price = Cost + Desired or target mark-up % on cost
Cost = Average fixed cost (AFC) + Average variable cost (AVC)
In this, desired mark-up % is regarded as profit % that an entity is expecting to receive
through the selling of their services. Thus, higher the mark-up % by MEP helps to procure larger
yield on total sales or vice-versa (Chand, 2012). The most important advantage of this way of
pricing determination is it helps to cover total cost of production and distribution and assure return
in the business.
Competition-based pricing: Large number of tourists from overall world visit UK every
year to enjoy their life. Due to rapid increase in number of visitors with having differences in
demand and preferences, the level of competition in the sector becomes very tough. Therefore,
while making pricing decisions, it becomes necessary for the MEP to take into consideration that
what competitors are charging for their products and services and set their own prices accordingly
(Kaplan and Atkinson, 2015). It does not necessarily means that MEP has to decide perfectly
equivalent selling prices to that of competitors. They can decide prices to some extent by delivering
more better and unique services to deliver best value to the audiences for their money invested. It is
considered effective technique to compete effectively in the market place. In UK travel and tourism
industry, aviation segment use this pricing method to set fair charges for airline services
(Papatheodorou, 2016).
Demand-based pricing: Under this method, MEP first has to anticipate or forecast their
market demand and prices will be finalized according to the demand level. Referring MEP, in case
of having the possibility of larger customer demand, manager can set high prices whilst if the
demand is comparatively less than low price should be charged to attract more audiences (Platzer,
2014). The success of this method is highly dependent upon the ability of manager to correctly
5
estimate the demand in forthcoming years. In UK hospitality industry, many of travel and tourism
companies use this method to decide their product prices. It is considered as best technique for MEP
which enable establishment to maximize their net return if customers are willing to pay high
charges for their products and services.
1.3
There are numerous factors which impact either positively or negatively the corporate yield.
Some of the most important components along with their affects on business return are described
underneath:
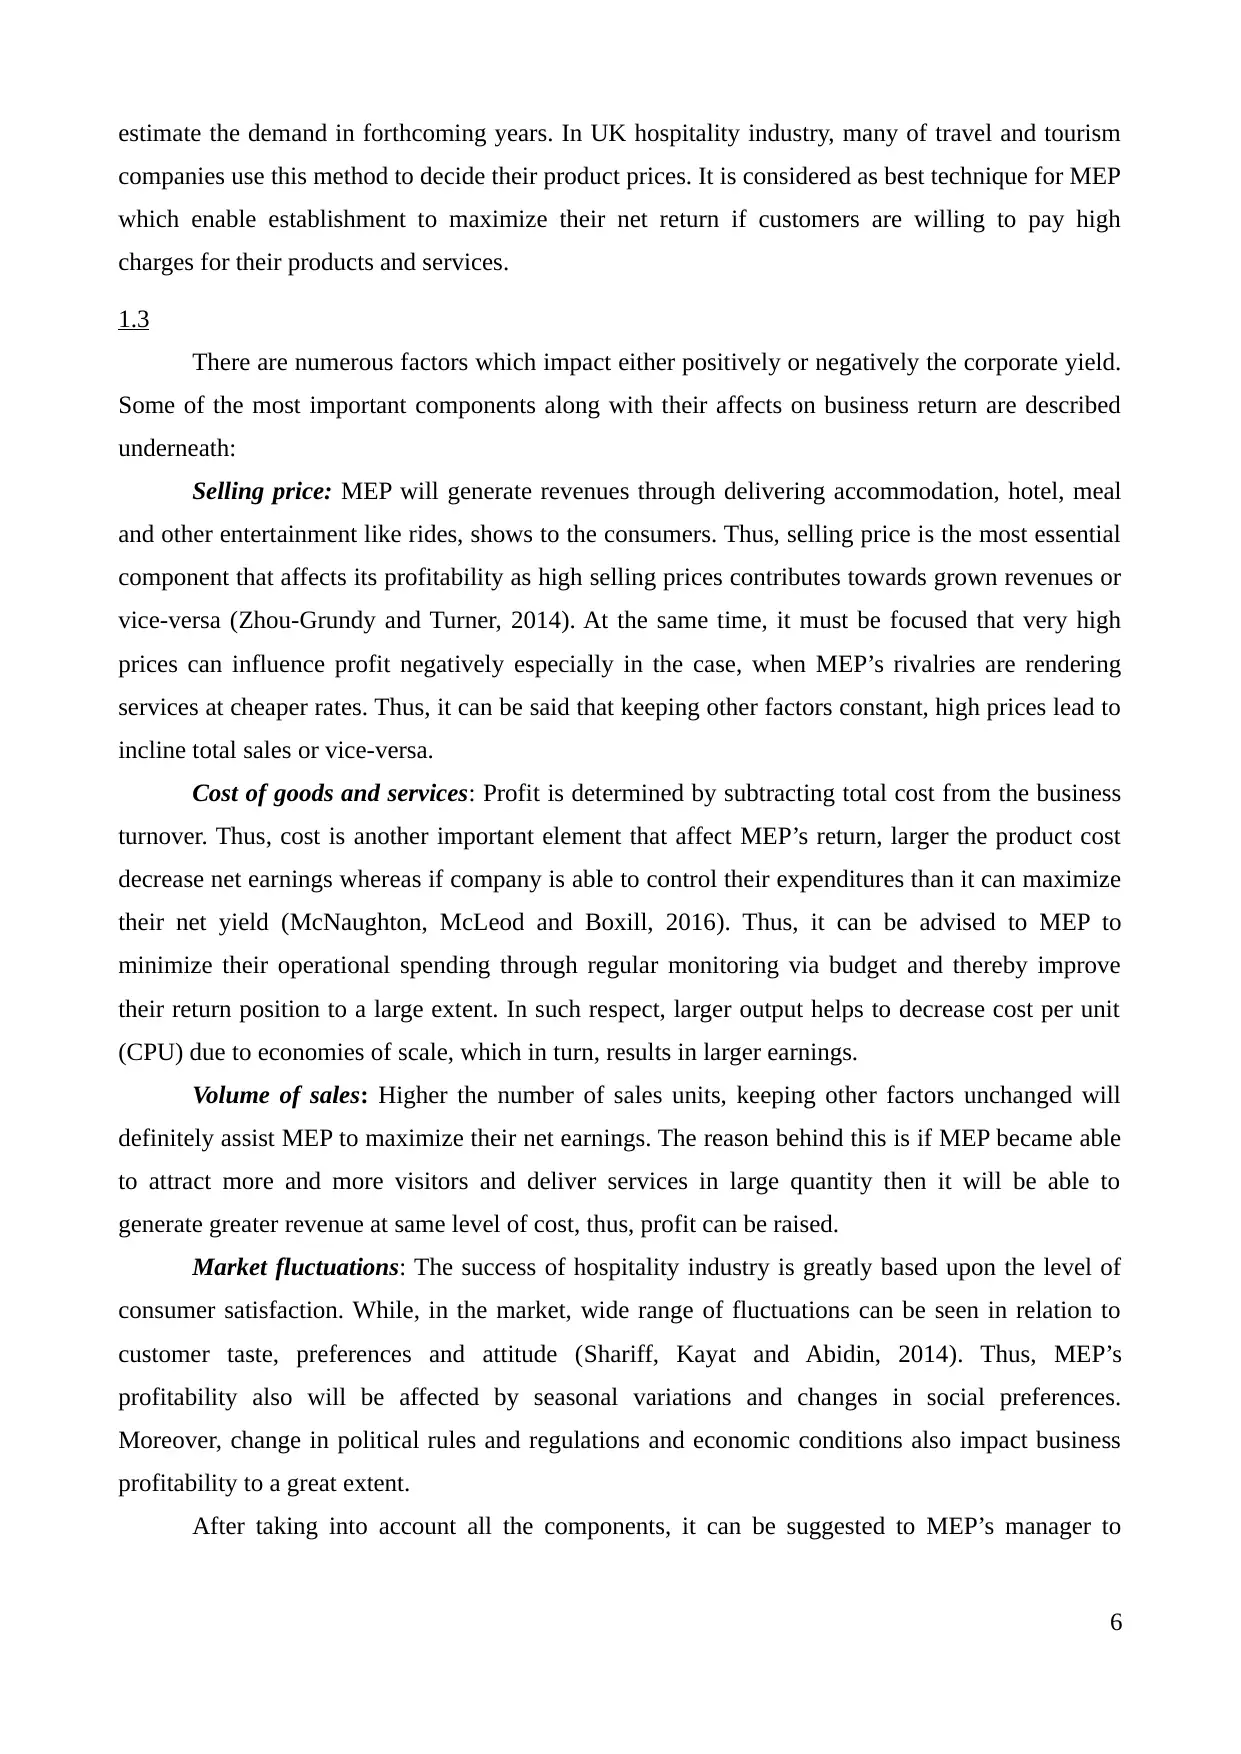
Selling price: MEP will generate revenues through delivering accommodation, hotel, meal
and other entertainment like rides, shows to the consumers. Thus, selling price is the most essential
component that affects its profitability as high selling prices contributes towards grown revenues or
vice-versa (Zhou-Grundy and Turner, 2014). At the same time, it must be focused that very high
prices can influence profit negatively especially in the case, when MEP’s rivalries are rendering
services at cheaper rates. Thus, it can be said that keeping other factors constant, high prices lead to
incline total sales or vice-versa.
Cost of goods and services: Profit is determined by subtracting total cost from the business
turnover. Thus, cost is another important element that affect MEP’s return, larger the product cost
decrease net earnings whereas if company is able to control their expenditures than it can maximize
their net yield (McNaughton, McLeod and Boxill, 2016). Thus, it can be advised to MEP to
minimize their operational spending through regular monitoring via budget and thereby improve
their return position to a large extent. In such respect, larger output helps to decrease cost per unit
(CPU) due to economies of scale, which in turn, results in larger earnings.
Volume of sales: Higher the number of sales units, keeping other factors unchanged will
definitely assist MEP to maximize their net earnings. The reason behind this is if MEP became able
to attract more and more visitors and deliver services in large quantity then it will be able to
generate greater revenue at same level of cost, thus, profit can be raised.
Market fluctuations: The success of hospitality industry is greatly based upon the level of
consumer satisfaction. While, in the market, wide range of fluctuations can be seen in relation to
customer taste, preferences and attitude (Shariff, Kayat and Abidin, 2014). Thus, MEP’s
profitability also will be affected by seasonal variations and changes in social preferences.
Moreover, change in political rules and regulations and economic conditions also impact business
profitability to a great extent.
After taking into account all the components, it can be suggested to MEP’s manager to
6
companies use this method to decide their product prices. It is considered as best technique for MEP
which enable establishment to maximize their net return if customers are willing to pay high
charges for their products and services.
1.3
There are numerous factors which impact either positively or negatively the corporate yield.
Some of the most important components along with their affects on business return are described
underneath:
Selling price: MEP will generate revenues through delivering accommodation, hotel, meal
and other entertainment like rides, shows to the consumers. Thus, selling price is the most essential
component that affects its profitability as high selling prices contributes towards grown revenues or
vice-versa (Zhou-Grundy and Turner, 2014). At the same time, it must be focused that very high
prices can influence profit negatively especially in the case, when MEP’s rivalries are rendering
services at cheaper rates. Thus, it can be said that keeping other factors constant, high prices lead to
incline total sales or vice-versa.
Cost of goods and services: Profit is determined by subtracting total cost from the business
turnover. Thus, cost is another important element that affect MEP’s return, larger the product cost
decrease net earnings whereas if company is able to control their expenditures than it can maximize
their net yield (McNaughton, McLeod and Boxill, 2016). Thus, it can be advised to MEP to
minimize their operational spending through regular monitoring via budget and thereby improve
their return position to a large extent. In such respect, larger output helps to decrease cost per unit
(CPU) due to economies of scale, which in turn, results in larger earnings.
Volume of sales: Higher the number of sales units, keeping other factors unchanged will
definitely assist MEP to maximize their net earnings. The reason behind this is if MEP became able
to attract more and more visitors and deliver services in large quantity then it will be able to
generate greater revenue at same level of cost, thus, profit can be raised.
Market fluctuations: The success of hospitality industry is greatly based upon the level of
consumer satisfaction. While, in the market, wide range of fluctuations can be seen in relation to
customer taste, preferences and attitude (Shariff, Kayat and Abidin, 2014). Thus, MEP’s
profitability also will be affected by seasonal variations and changes in social preferences.
Moreover, change in political rules and regulations and economic conditions also impact business
profitability to a great extent.
After taking into account all the components, it can be suggested to MEP’s manager to
6
⊘ This is a preview!⊘
Do you want full access?
Subscribe today to unlock all pages.
Trusted by 1+ million students worldwide
maximize their sales volume and selling prices (up to an acceptable level) and control their routine
expenditures to minimize their cost and enhance their yield.
TASK 2
Attached in PPT.
TASK 3
3.1
After preparation of financial statements, MEP needs to compare their business performance
and financial status with that of previous year to identify that whether they brought significant level
of improvements or not. Ratio analysis is considered as the best way to compare the financial
success over the period because, in this technique, manager can compute different type of ratios like
profitability, solvency, liquidity and efficiency based upon the result of business activities. In such
respect, statement of comprehensive income (SOCI) gives information about collected revenues and
incurred expenditures for a fixed time period whereas statement of financial position (balance sheet)
provide information about financial strength (Pratt, 2013). However, on the other side, cash flow
statement summarizes information about cash inflow and outflow through operating, financing and
investing activities. As per the scenario, TRG is operating over 470 restaurants and pubs and
Frankie and Benny’s, Chiquito, Coast to Coast and Granfunkel’s are its top most popular brands that
contribute highest to its revenues. Moreover, restaurant also operates Concession division that trade
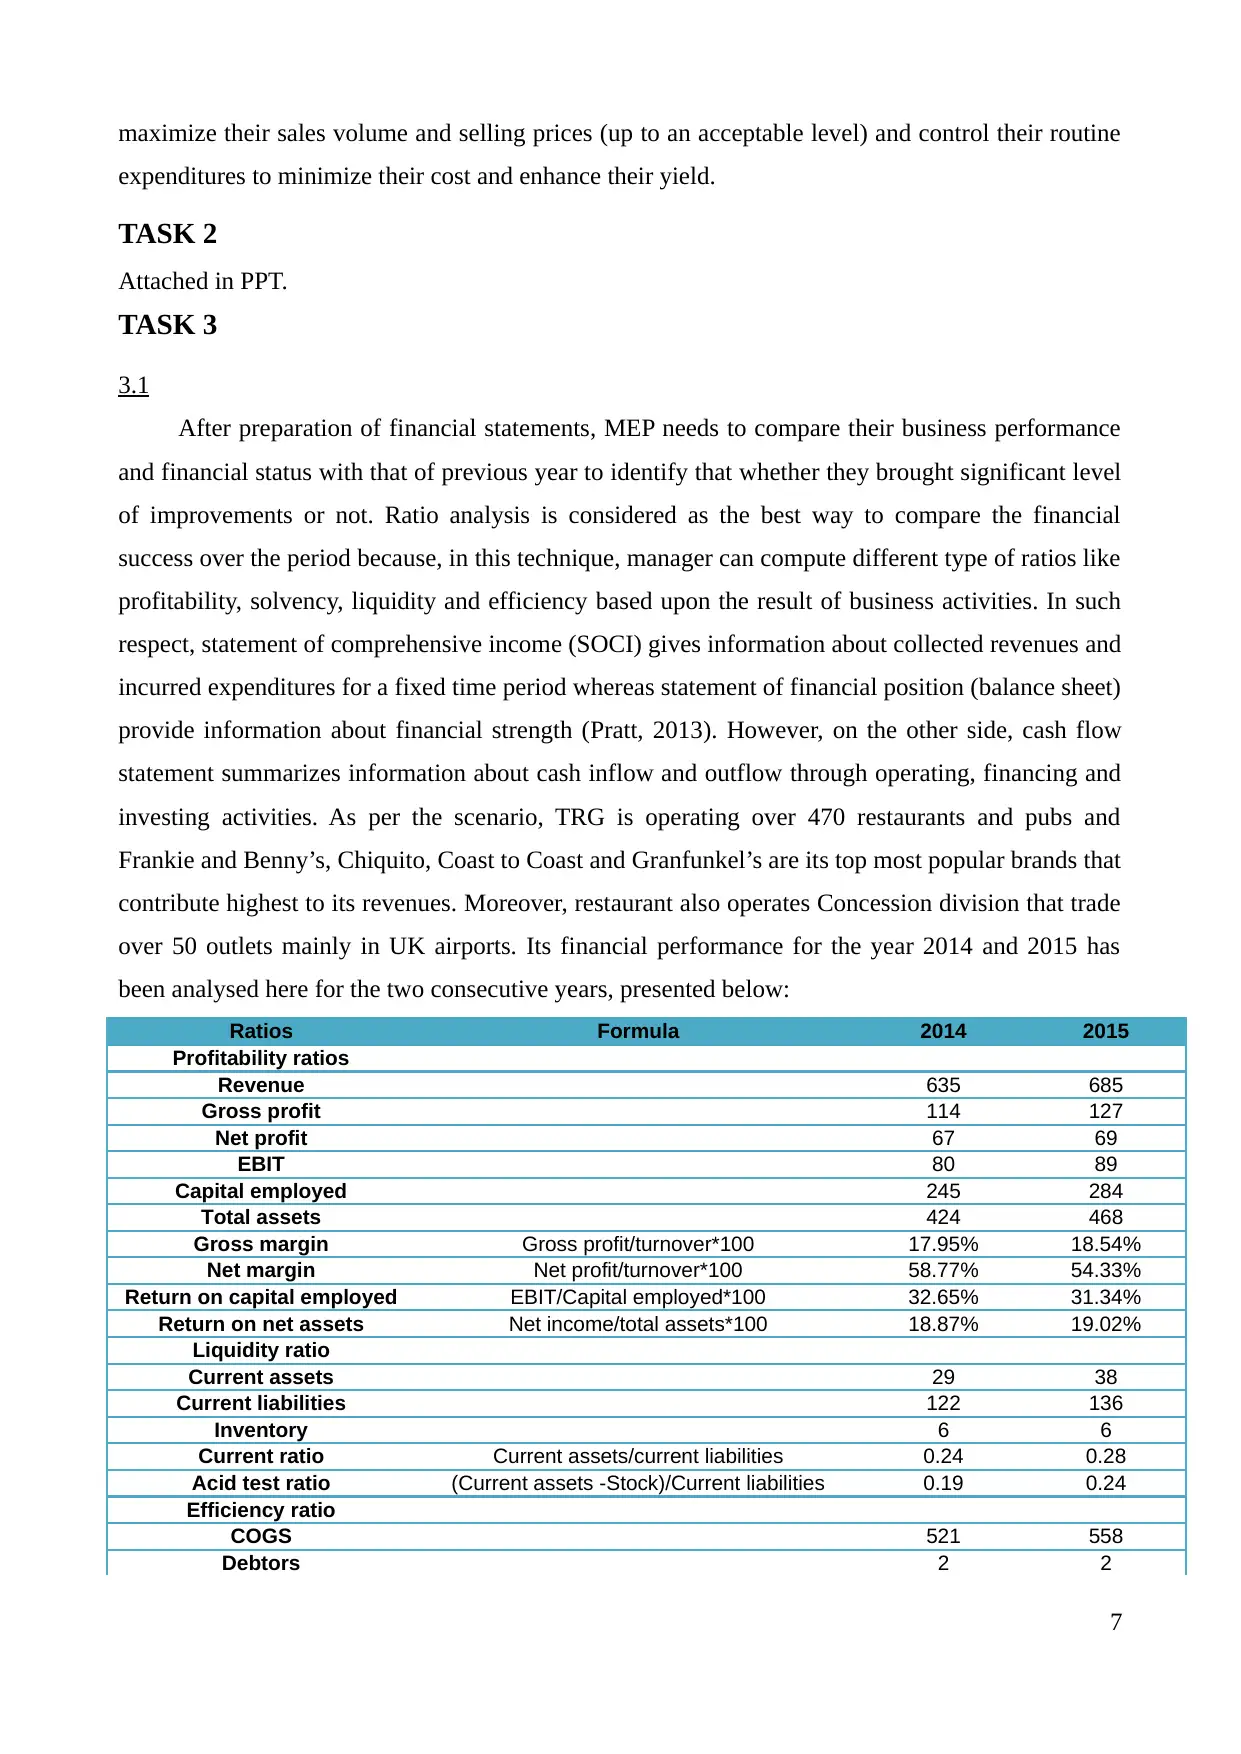
over 50 outlets mainly in UK airports. Its financial performance for the year 2014 and 2015 has
been analysed here for the two consecutive years, presented below:
Ratios Formula 2014 2015
Profitability ratios
Revenue 635 685
Gross profit 114 127
Net profit 67 69
EBIT 80 89
Capital employed 245 284
Total assets 424 468
Gross margin Gross profit/turnover*100 17.95% 18.54%
Net margin Net profit/turnover*100 58.77% 54.33%
Return on capital employed EBIT/Capital employed*100 32.65% 31.34%
Return on net assets Net income/total assets*100 18.87% 19.02%
Liquidity ratio
Current assets 29 38
Current liabilities 122 136
Inventory 6 6
Current ratio Current assets/current liabilities 0.24 0.28
Acid test ratio (Current assets -Stock)/Current liabilities 0.19 0.24
Efficiency ratio
COGS 521 558
Debtors 2 2
7
expenditures to minimize their cost and enhance their yield.
TASK 2
Attached in PPT.
TASK 3
3.1
After preparation of financial statements, MEP needs to compare their business performance
and financial status with that of previous year to identify that whether they brought significant level
of improvements or not. Ratio analysis is considered as the best way to compare the financial
success over the period because, in this technique, manager can compute different type of ratios like
profitability, solvency, liquidity and efficiency based upon the result of business activities. In such
respect, statement of comprehensive income (SOCI) gives information about collected revenues and
incurred expenditures for a fixed time period whereas statement of financial position (balance sheet)
provide information about financial strength (Pratt, 2013). However, on the other side, cash flow
statement summarizes information about cash inflow and outflow through operating, financing and
investing activities. As per the scenario, TRG is operating over 470 restaurants and pubs and
Frankie and Benny’s, Chiquito, Coast to Coast and Granfunkel’s are its top most popular brands that
contribute highest to its revenues. Moreover, restaurant also operates Concession division that trade
over 50 outlets mainly in UK airports. Its financial performance for the year 2014 and 2015 has
been analysed here for the two consecutive years, presented below:
Ratios Formula 2014 2015
Profitability ratios
Revenue 635 685
Gross profit 114 127
Net profit 67 69
EBIT 80 89
Capital employed 245 284
Total assets 424 468
Gross margin Gross profit/turnover*100 17.95% 18.54%
Net margin Net profit/turnover*100 58.77% 54.33%
Return on capital employed EBIT/Capital employed*100 32.65% 31.34%
Return on net assets Net income/total assets*100 18.87% 19.02%
Liquidity ratio
Current assets 29 38
Current liabilities 122 136
Inventory 6 6
Current ratio Current assets/current liabilities 0.24 0.28
Acid test ratio (Current assets -Stock)/Current liabilities 0.19 0.24
Efficiency ratio
COGS 521 558
Debtors 2 2
7
Paraphrase This Document
Need a fresh take? Get an instant paraphrase of this document with our AI Paraphraser
Creditors 51 56
Stock turnover ratio Cost of goods sold/Inventory 86.83 93
Debtors receivable period Trade debtors/Revenues*365 1.15 1.07
Creditors payment period Trade payables/Cost of sales*365 35.73 36.63
Solvency ratio
Debt 39 31
Equity 245 284
Capital gearing (Long-term liabilities/Equity capital employed 0.16 0.11
Profitability narratives:
This ratio helps to examine that whether TRG has improved their operational performance
or not (Karande and Chakraborty, 2012). Gross margin (GM) got increased from 17.95% to 18.54%
due to high proportionate increase in sales by 7.87% and effective control over direct cost are the
reason behind this. While, on the other hand, its net margin (NM) shows a little bit decrease from
10.55% to 10.07% due to high indirect expenditures demonstrates that in 2015, TRG generated less
return through operations. However, ROCE got decreased from 32.65% to 31.34% and return on
total assets improved from 18.87% to 19.02% which reflects that in 2015, TRG group collected less
profit on total capital employed and high on total assets.
Liquidity narratives:
This ratio enables TRG to determine that whether they are able or not to meet out their
short-term liabilities like creditors (Drake, 2016). Current ratio (CR) has been improved from 0.24
to 0.28 whilst acid test ratio goes increased from 0.19 to 0.24 reflects that in 2015, TRG has
improved its ability to pay suppliers on right time. But still, both the ratios are far away from the
idle ratio of 2:1 and 1:1. Henceforth, it is considered better to advice restaurant’s managers to
enhance their current assets i.e. inventory, receivable and cash position and pay off their few of the
current liabilities.
Efficiency narratives:
This ratio measures that how much managers are able to utilize optimally business assets so
as to generate greater turnover (Kumbirai and Webb, 2013). TRG’s stock turnover ratio got
improved from 86.83 to 93 which isa sign of high managerial efficiency to effectively use business
inventory. While, on the other side, debtors receivable period got decreased from 1.15 to 1.07 days
demonstrating that TRG is generating quicker cash from their receivables. Moreover, high creditors’
payment period from 35.73 to 36.73 days reveal that restaurant managers are paying suppliers
delayed for the better availability of cash in the business.
Solvency narratives:
Managers need to manage their financial risk through constructing the best mix of both debt
and equity in their capital structure (Pratt, 2013). Declined capital gearing (debt-to-equity ratio)
8
from 0.16:1 to 0.11:1 is a sign of less financial risk because of repayment of debt and more
collection of equity capital amounted to 8 and 39. But still, 0.5:1 is considered as idle ratio that
reflects that TRG must use 50% debt resources in their capital structure to manage their financial
risk. Henceforth, it is considered advisable that TRG must collect more debt to meet their capital
requirement and thereby maintain solvency position.
TASK 4
4.1
Poster
As already stated earlier, that the level of competition in UK hospitality sector is very high,
9
````````` `````````````````````````````````````
Travel and Tourism capital
projects
Cross Railway project
Tourism Information Point
Small scale
tourism/environmental
improvement
Construction of heritage sites
Integrated footpath
development
Long-term capital sources
Debt financing
Equity financing
Governmental funding
Short-term and medium-
term resources
Overdraft
Ploughing back of profits
Short-term bank loan
Hire purchase system
Leasing
Squeezing operations
Non-Governmental Public
Bodies (NGPB)
Department of Culture
Office of Deputy Prime
Minister
European Social Fund
Regional Development Fund
Role of Non-Governmental
Public Bodies (NGPB)
Encouraging sector
Formulating policies
Meeting financial need
Through grants and subsidies
⊘ This is a preview!⊘
Do you want full access?
Subscribe today to unlock all pages.
Trusted by 1+ million students worldwide
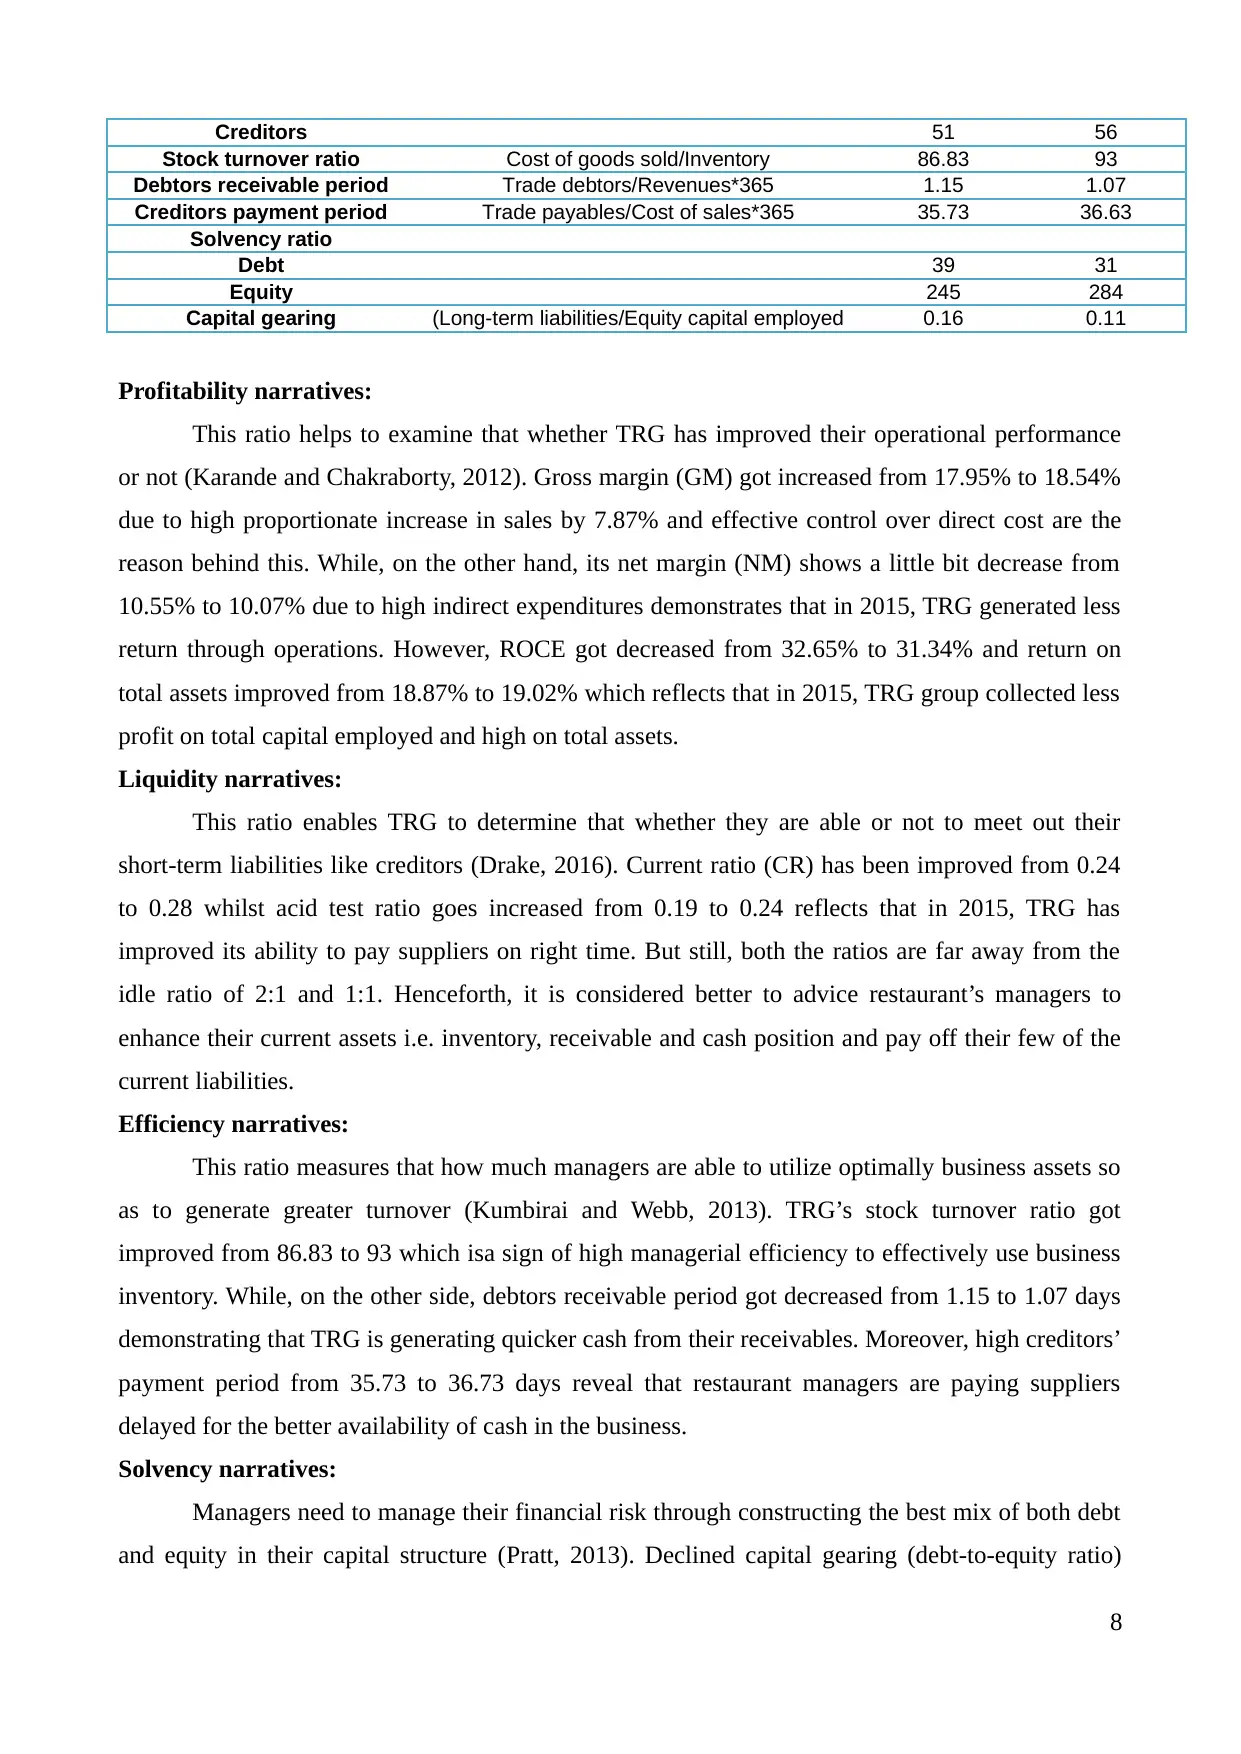
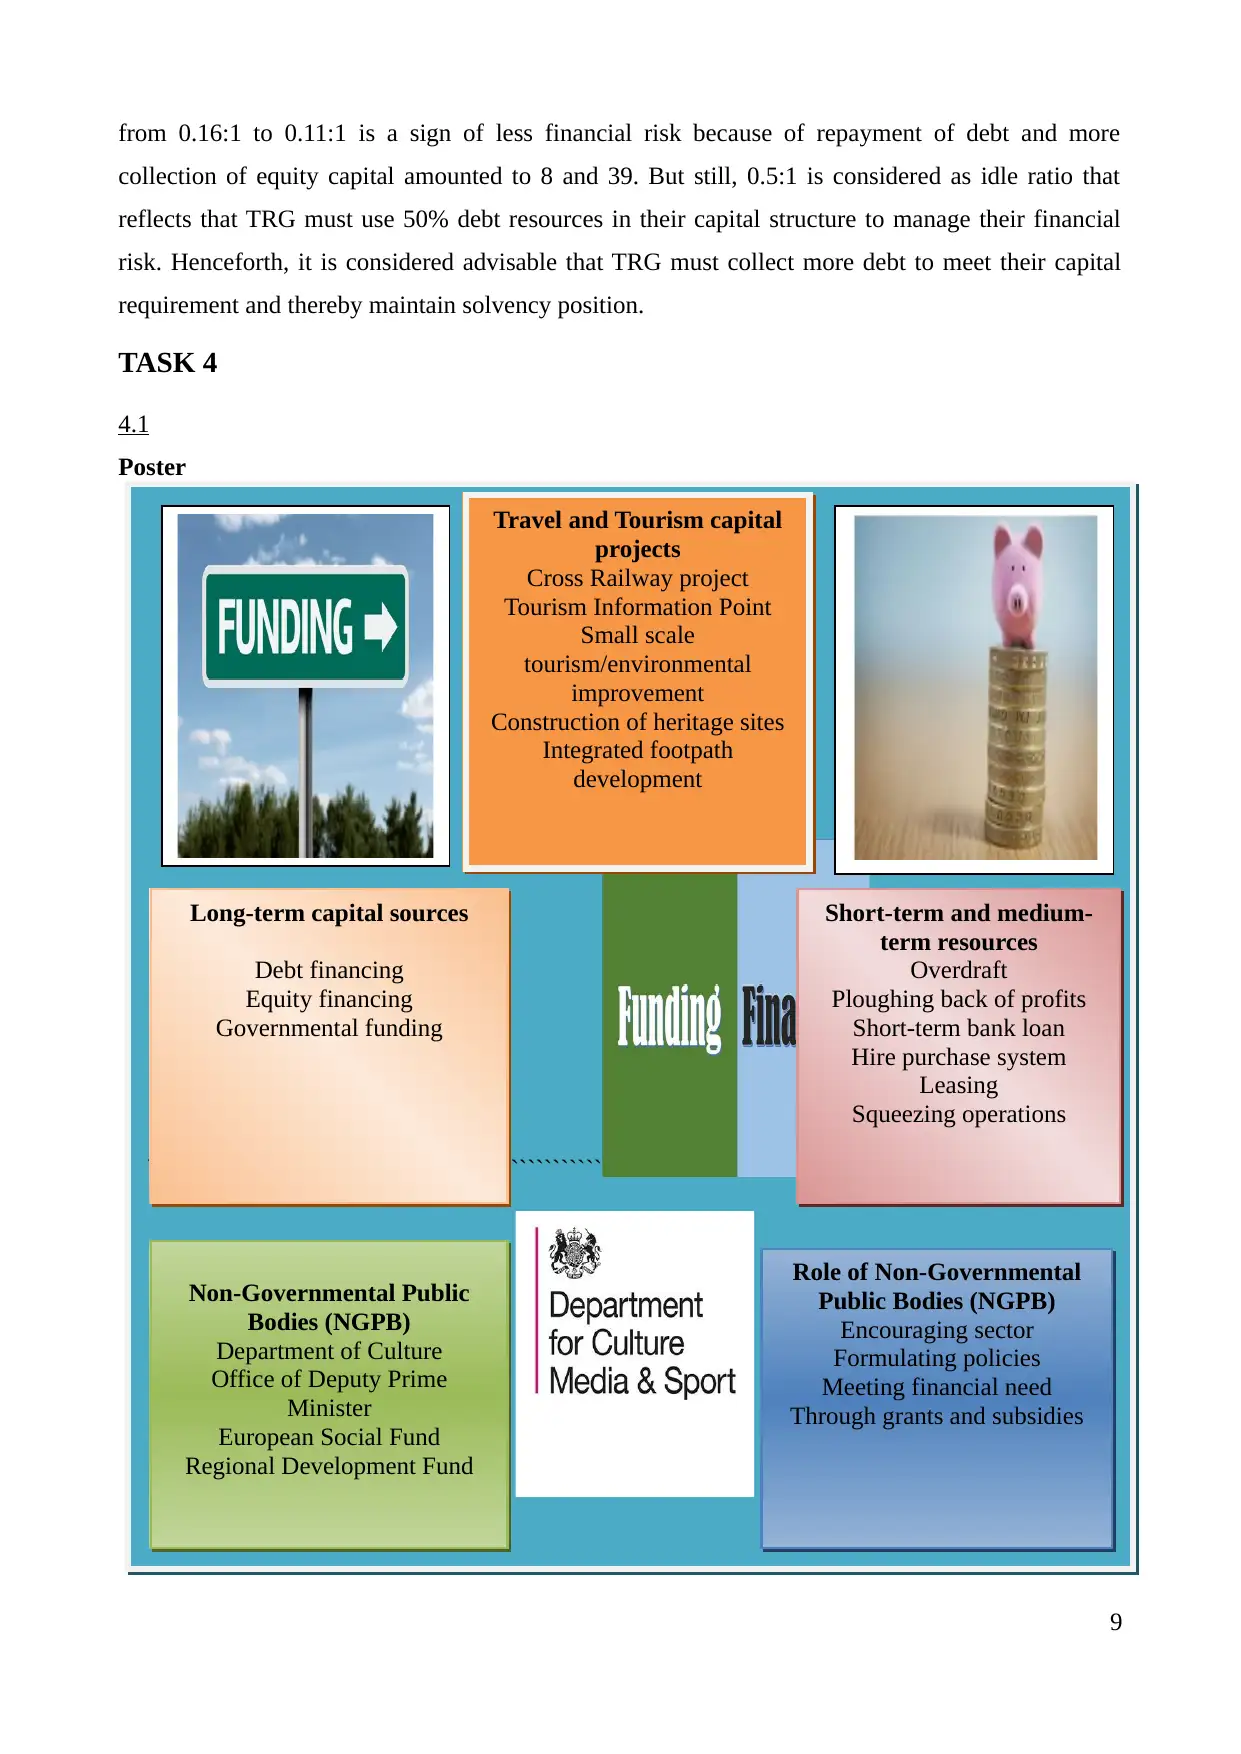
thus, it becomes essential for the organizations to gather sufficient capital from different sources to
meet their capital requirement effectively (Bebbington and Thomson, 2013). In order to funding
various capital projects like Cross Railway project, Tourism Information Point, small scale
tourism/environmental improvement, construction of heritage sites, integrated footpath
development, it seems necessary for the firms to gather adequate funds from the most suitable
finance source, There are wide range of finance sources available to travel and tourism companies
to meet their financial requirement, describing underneath:
Debt funding: In UK, commercial banks and financial institutions provide short-term,
medium-term and long-term funding services to the entrepreneurs at an interest rate. In order to
fulfil financial need for capital projects, travel and tourism organizations can apply for long-term
loans and raise their money by providing them collateral security or mortgage assets (Jackson,
Keune and Salzsieder, 2013). On the amount of loans, company will be liable to pay interest
periodically, otherwise, bank have authority to seize the assets so as to get back their funds. While,
it is considered as cheaper source of finance because taxation authority deduct interest amount when
determine corporate tax obligations. Moreover, it also provide convinces to the entities regarding
the repayment of debt in equal periodical instalments.
Equity funding: Entrepreneurs can also gather money through offering both the preference
and equity shares to the public. On the preference share capital, organizations will be liable to pay
fixed rate of dividend to the shareholders, however, on equity share capital; the rate of dividend is
not fixed (Vernimmen and et.al., 2014). Moreover, at the time of loss, company may decide to not
distribute dividend to the ordinary shareholders. Higher the public subscription enables businesses
to meet their financial requirement to a great extent. But still, it has one negative impact that is
shareholders have right to take part in business decisions, through which, they can interfere in
managerial decisions and minimize their freedom.
Government funding: In UK, regulatory bodies like Department of Culture, Media and
Sport, Office of Deputy Prime Minister, European Social Fund and Regional Development Fund
play an important role. The main objective of all the Non-Governmental Public Bodies (NGPB) is
to encourage and promote the growth of the sector (Vernimmen and et.al., 2014). In order to meet
this objective, they also provide financial assistance to the corporations by providing them grant and
subsidies i.e. tax subsidy. Thus, companies can meet their capital need by receiving governmental
grants to financing their capital projects. It must be noticed that the amount of grant must be used
for the specific purpose and within prescribed time limit; otherwise, it will be lapse.
Apart from this, overdraft, squeezing operations, hire purchase, leasing, ploughing back of
profits are the other financial sources available, through which, entities can meet their short-term
10
Paraphrase This Document
Need a fresh take? Get an instant paraphrase of this document with our AI Paraphraser
and medium-term capital need.
CONCLUSION
Report concluded the fact that CVP analysis works as an effective technique that assist Merlin
Entertainment Plc to identify the impact of different cost on their total return. Through employing
this technique, manager can make qualitative short-term decisions by making more and more sales
beyond BEP level. Moreover, its managers can evaluate and examine financial statements and can
use standard costing to meet targets via formulating better policies and decisions as well. Along
with this, application of ratio analysis technique inferred that The Restaurant Group’s profitability,
solvency and liquidity position is not effectively managed, therefore, financial manager has to make
better decisions for the performing much well in forthcoming years. At the end, report concluded
that debt, equity and governmental funding are the sources of finance available to travel and tourism
companies to raise availability of money for the capital projects. Out of these, the cost of debt is
considered cheaper than equity because government consider interest payments on loans as
deductible expenses, which in turn, minimizes tax obligations. While, equity capital does not
impose fixed financial burden as dividend rate is not fixed. Henceforth, it can be suggested that
companies has to decide an optimum mix of both the debt and equity in their capital structure to
accomplish their financial requirement.
11
REFERENCES
Books and Journals
Altinay, L. and et.al., 2015. Social entrepreneurship in tourism. In The 5th Advances in Hospitality
& Tourism Marketing and Management (AHTMM) Conference, Beppu, Japan, 18-21 June
2015.). Washington State University. 16(3). pp. 453-461.
Bebbington, J. and Thomson, I., 2013. Sustainable development, management and accounting:
Boundary crossing. Management Accounting Research. 4(24). pp. 277-283.
Camilleri, M. A., 2015. Nurturing travel and tourism enterprises for economic growth and
competitiveness. Tourism and Hospitality Research. 13(3). p.1467358415621947.
Chang, H. C., 2013. Environmental management accounting in the Taiwanese higher education
sector: issues and opportunities. International Journal of Sustainability in Higher
Education. 14(2). pp. 133-145.
Jackson, S. B., Keune, T. M. and Salzsieder, L., 2013. Debt, equity, and capital investment. Journal
of Accounting and Economics. 56(2). pp. 291-310.
Kaplan, R. S. and Atkinson, A. A., 2015. Advanced management accounting. PHI Learning.
Karande, P. and Chakraborty, S., 2012. Application of multi-objective optimization on the basis of
ratio analysis (MOORA) method for materials selection. Materials & Design. 37(3). pp.317-
324.
Kumbirai, M. and Webb, R., 2013. A financial ratio analysis of commercial bank performance in
South Africa. African Review of Economics and Finance. 2(1). pp. 30-53.
McNaughton, M., McLeod, M. T. and Boxill, I., 2016. An Actor Network Perspective of Tourism
Open Data. In Tourism and Hospitality Management. Emerald Group Publishing Limited.
12(3). pp. 47-60.
Papatheodorou, A., 2016. Aviation and Tourism: Implications for Leisure Travel. Routledge.
Platzer, M. D., 2014. US Travel and Tourism: Industry Trends and Policy Issues for Congress.
Pratt, J., 2013. Financial accounting in an economic context. Wiley Global Education.
Quattrone, P., 2016. Management accounting goes digital: Will the move make it
wiser?. Management Accounting Research. 31(5). pp. 118-122.
Santana-Talavera, A., 2016. Julio Aramberri: a sociological review of tourism studies. Anatolia.
16(6).pp. 1-7.
Shariff, N. M., Kayat, K. and Abidin, A. Z., 2014. Tourism and hospitality graduates competencies:
Industry perceptions and expectations in the Malaysian perspectives. World Applied
Sciences Journal. 31(11). pp. 1992-2000.
12
⊘ This is a preview!⊘
Do you want full access?
Subscribe today to unlock all pages.
Trusted by 1+ million students worldwide
1 out of 13
Related Documents


Your All-in-One AI-Powered Toolkit for Academic Success.
+13062052269
info@desklib.com
Available 24*7 on WhatsApp / Email
![[object Object]](/_next/static/media/star-bottom.7253800d.svg)
Unlock your academic potential
Copyright © 2020–2026 A2Z Services. All Rights Reserved. Developed and managed by ZUCOL.