Kaplan Business School: FINM4000 Finance Assessment 2 Report
VerifiedAdded on 2022/11/14
|10
|2083
|276
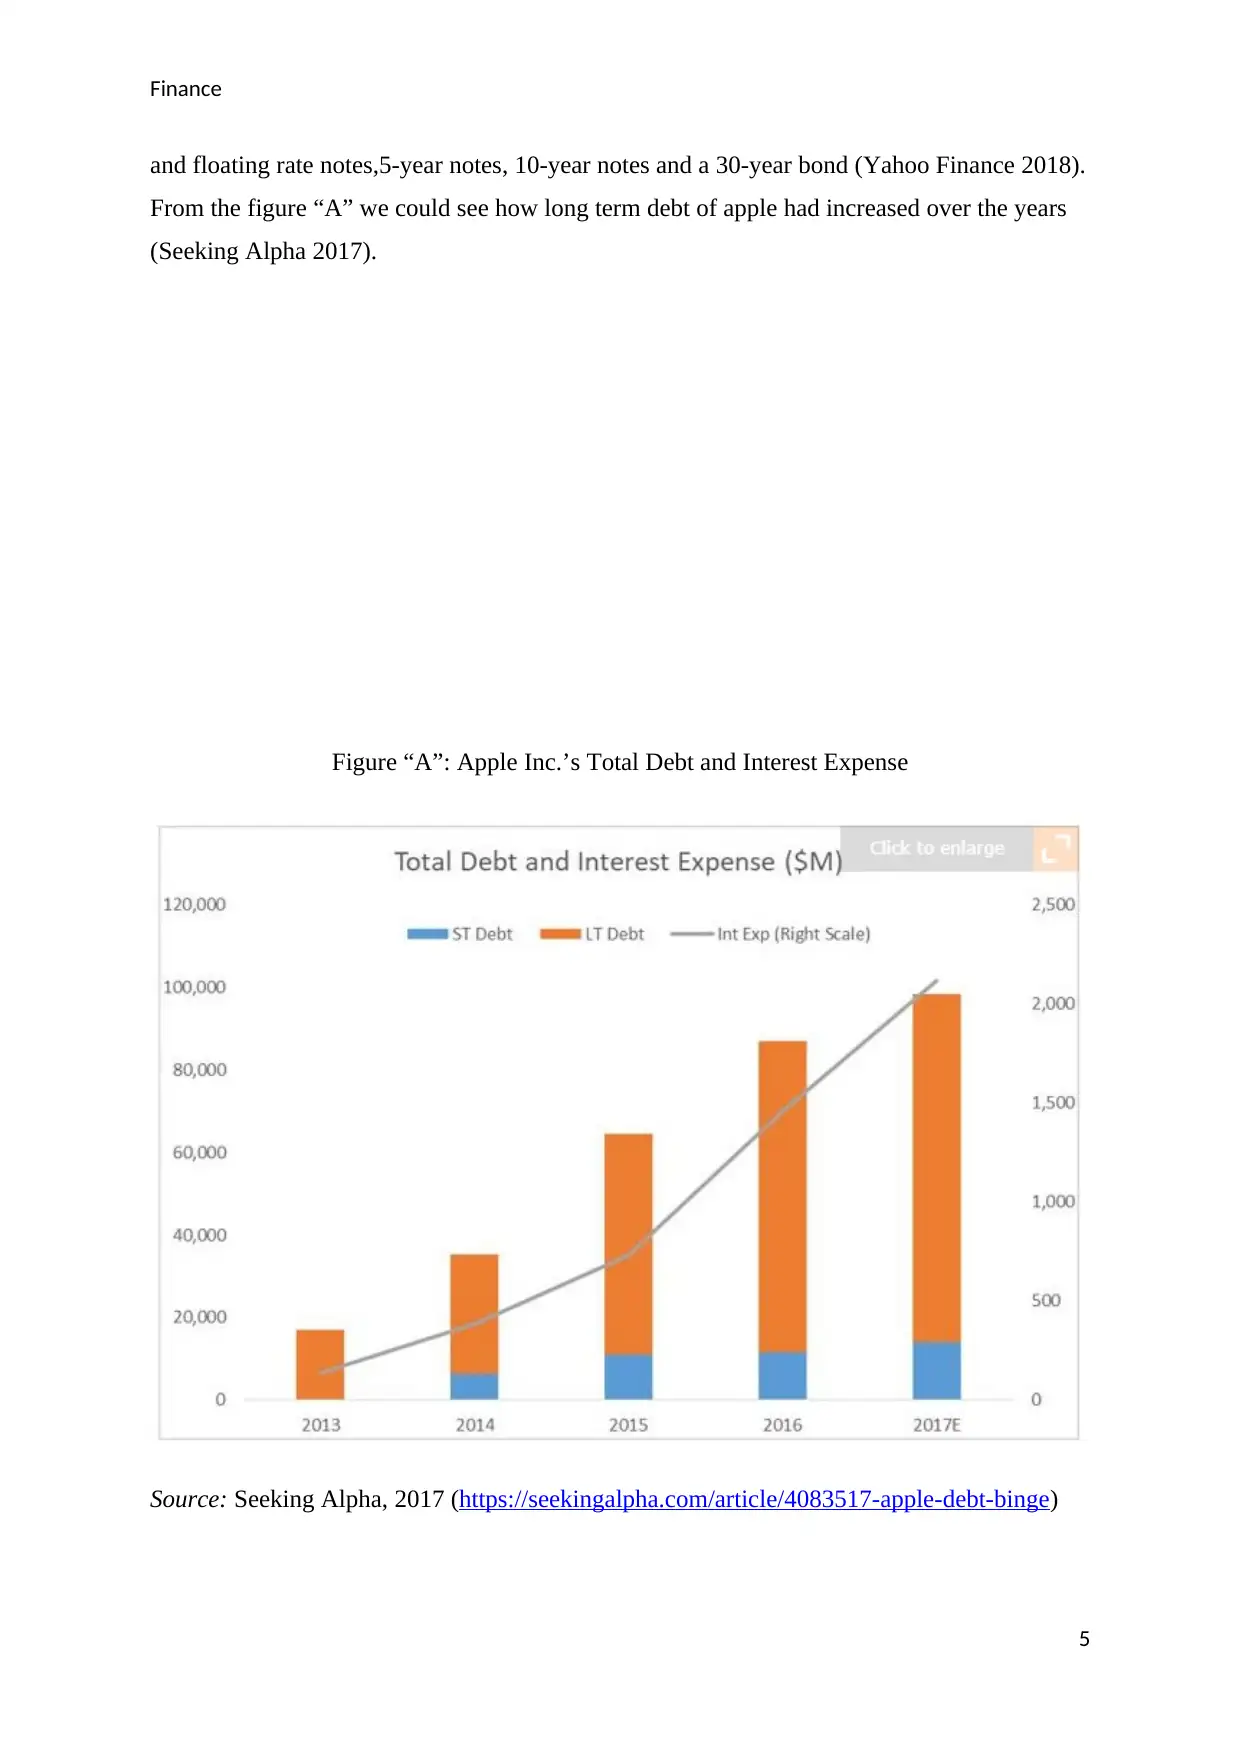
Report
AI Summary
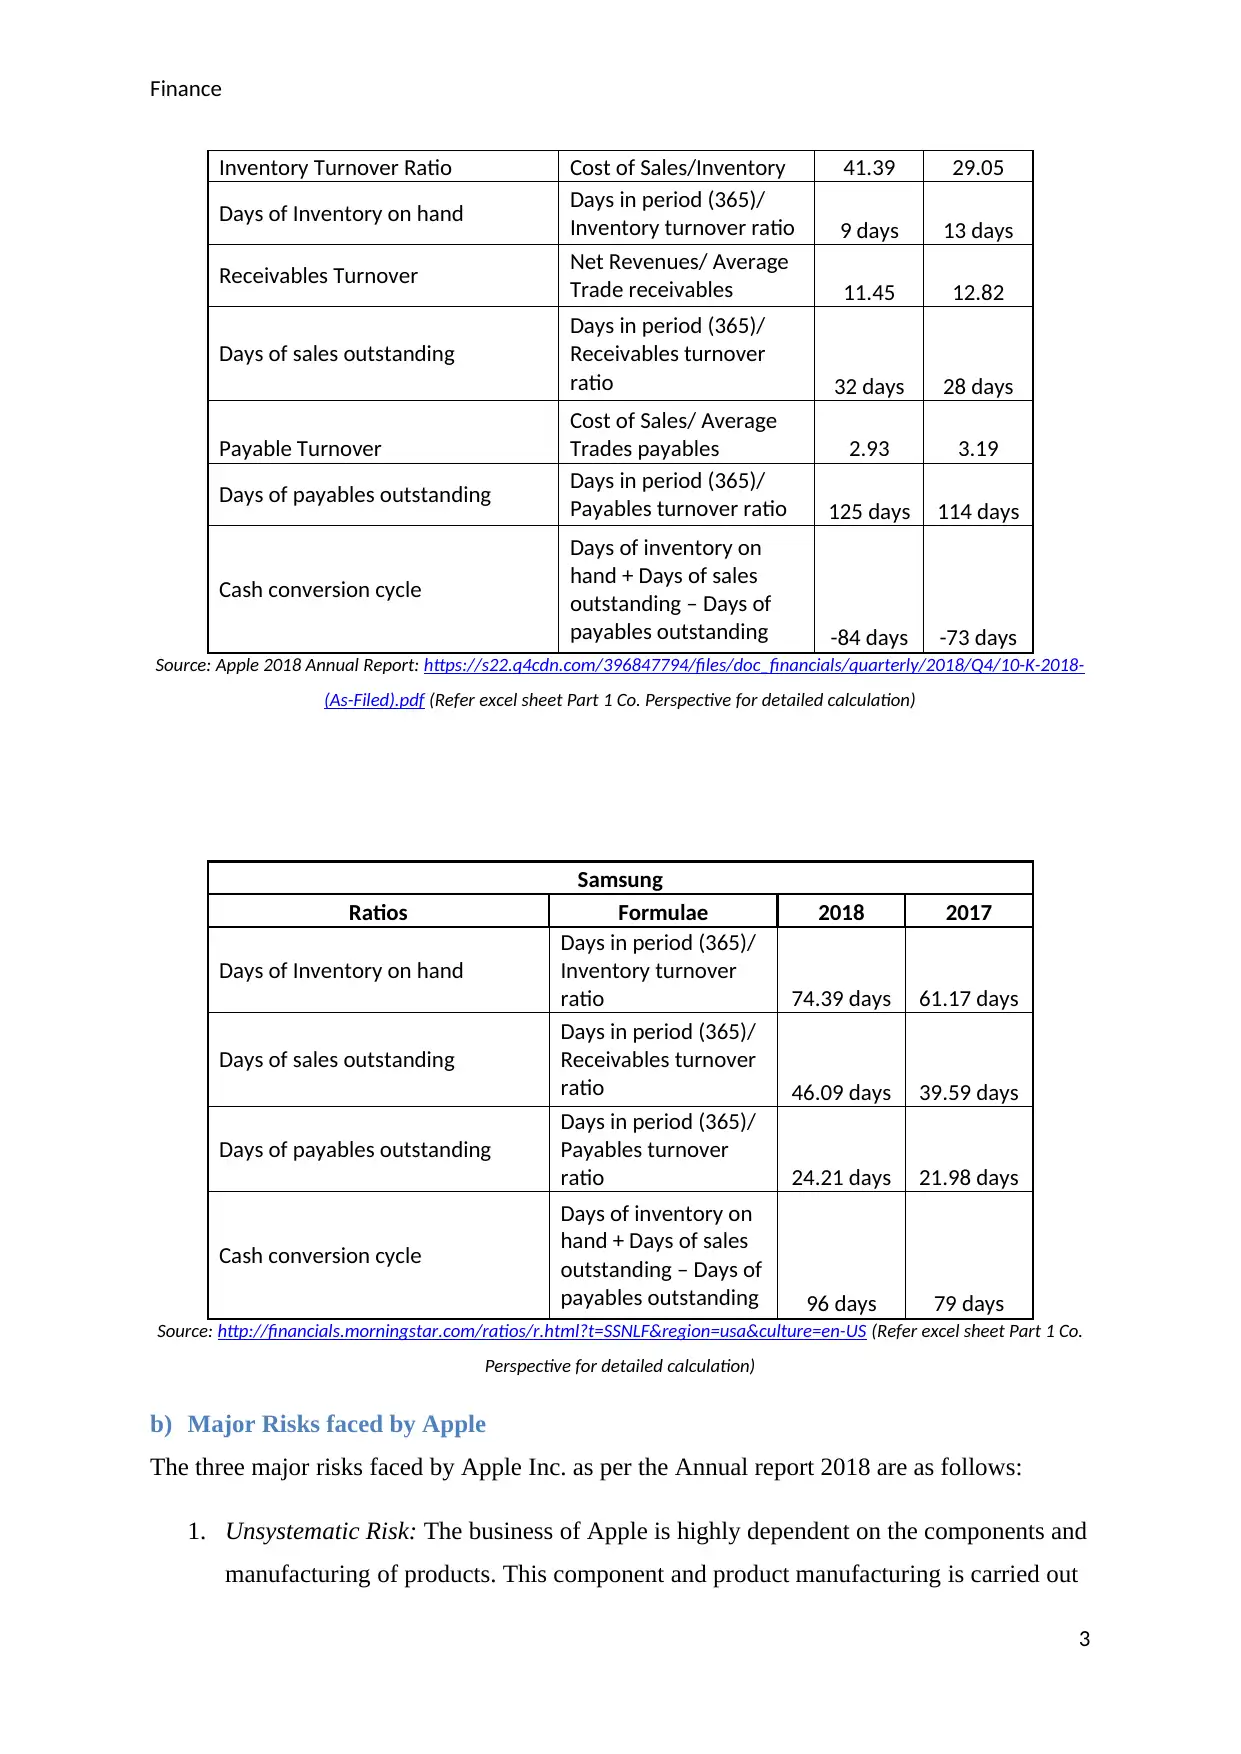
This report analyzes Apple Inc.'s financial performance, focusing on working capital efficiency, risk assessment, and capital budgeting decisions. The analysis begins with an evaluation of Apple's working capital efficiency, comparing its performance to competitors and examining key financial ratios such as inventory turnover, days of sales outstanding, and cash conversion cycle. The report then identifies major risks faced by Apple, including both systematic and unsystematic risks. The analysis extends to Apple's share price performance and long-term debt, including a calculation of bond price and holding period return. The capital budgeting section evaluates the feasibility of a new Apple store, calculating free cash flows, net present value (NPV) at different weighted average cost of capital (WACC) rates, and internal rate of return (IRR). Based on the overall assessment, a decision regarding the new store is recommended. The report utilizes data from Apple's annual reports and other financial sources to support its conclusions. Excel spreadsheets are attached for detailed calculations.

1 out of 10
Related Documents


Your All-in-One AI-Powered Toolkit for Academic Success.
+13062052269
info@desklib.com
Available 24*7 on WhatsApp / Email
![[object Object]](/_next/static/media/star-bottom.7253800d.svg)
Copyright © 2020–2026 A2Z Services. All Rights Reserved. Developed and managed by ZUCOL.