LMAD 4.2: BSBFIM601 Finance Assessment 3.2 Sales and Profit Budget

Verified

Added on  2022/10/12

|10
|419
|20
Report
AI Summary
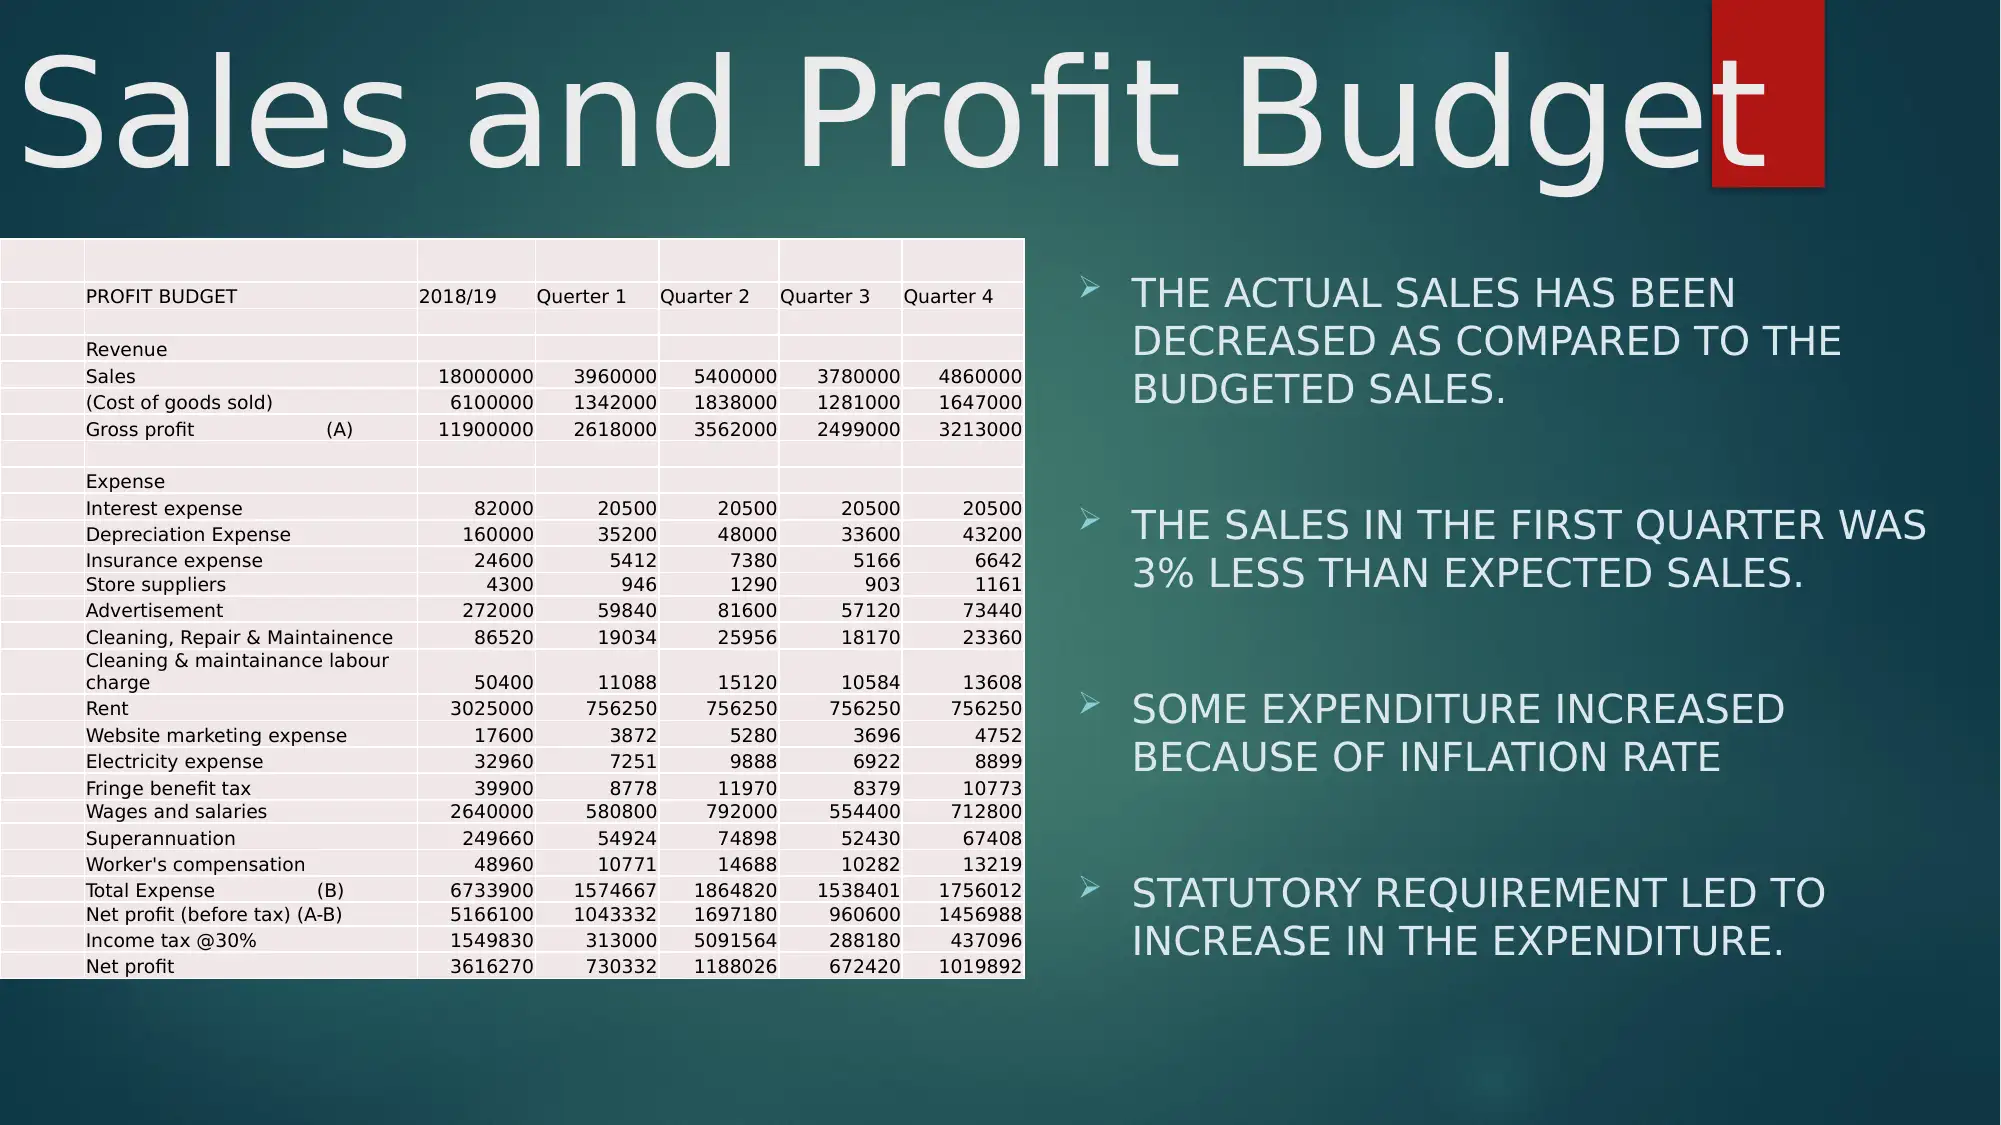
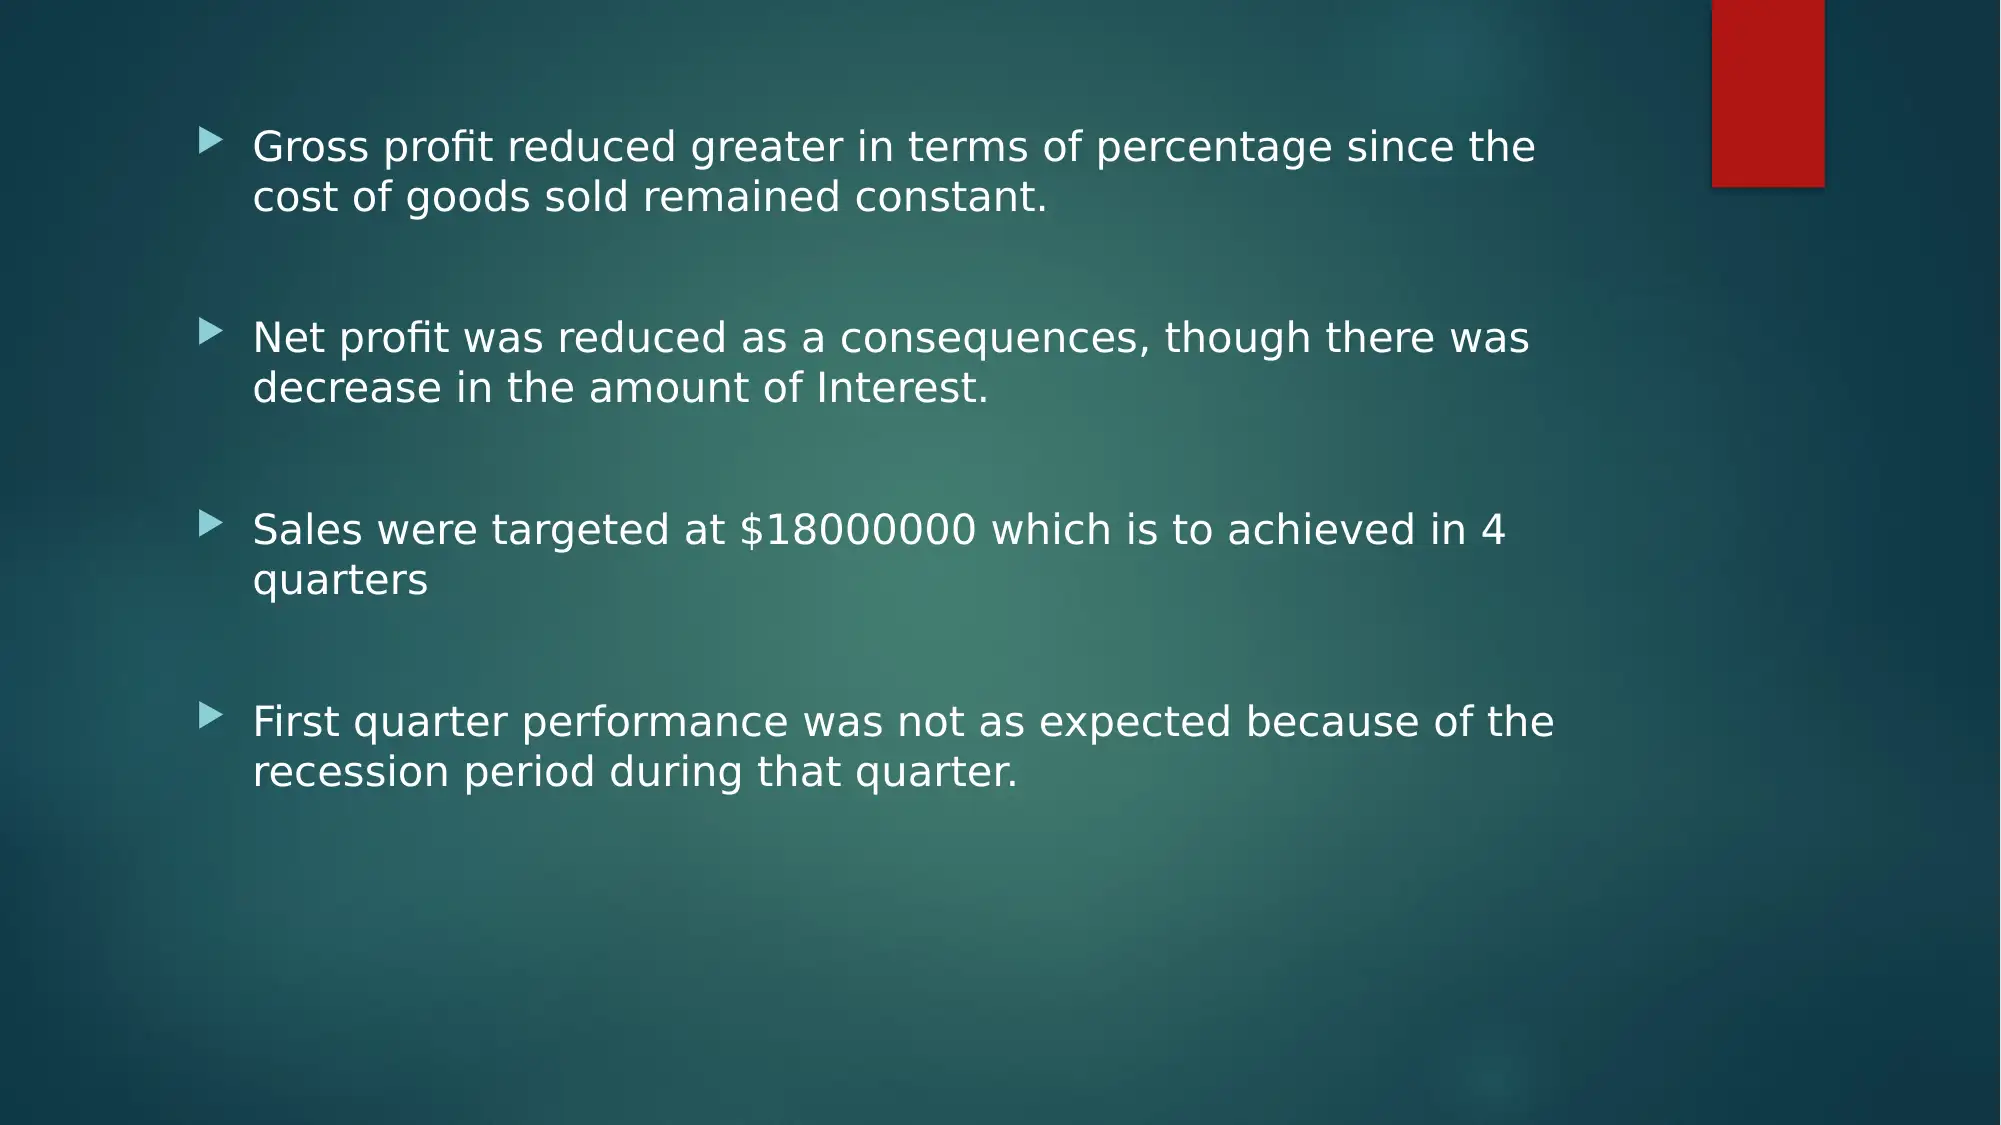
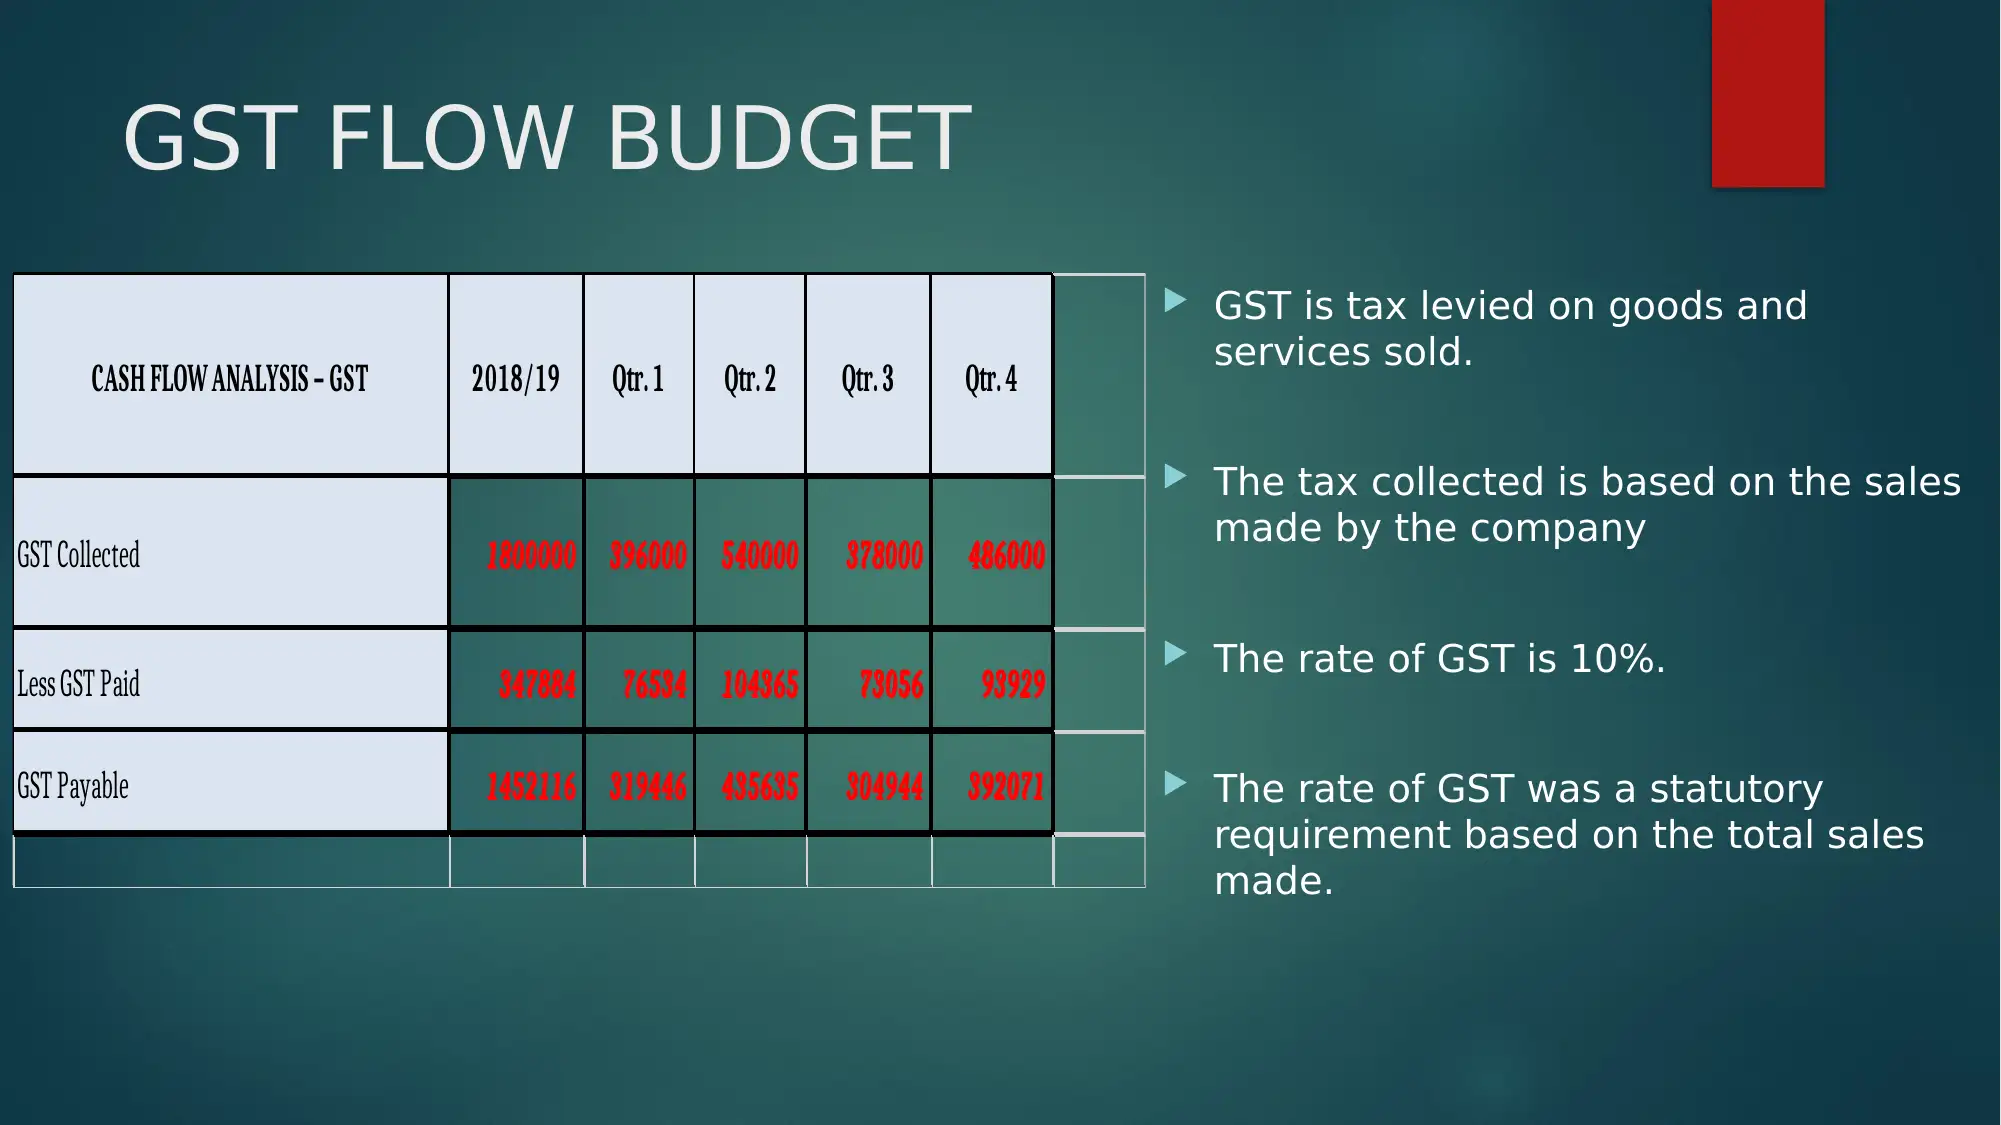
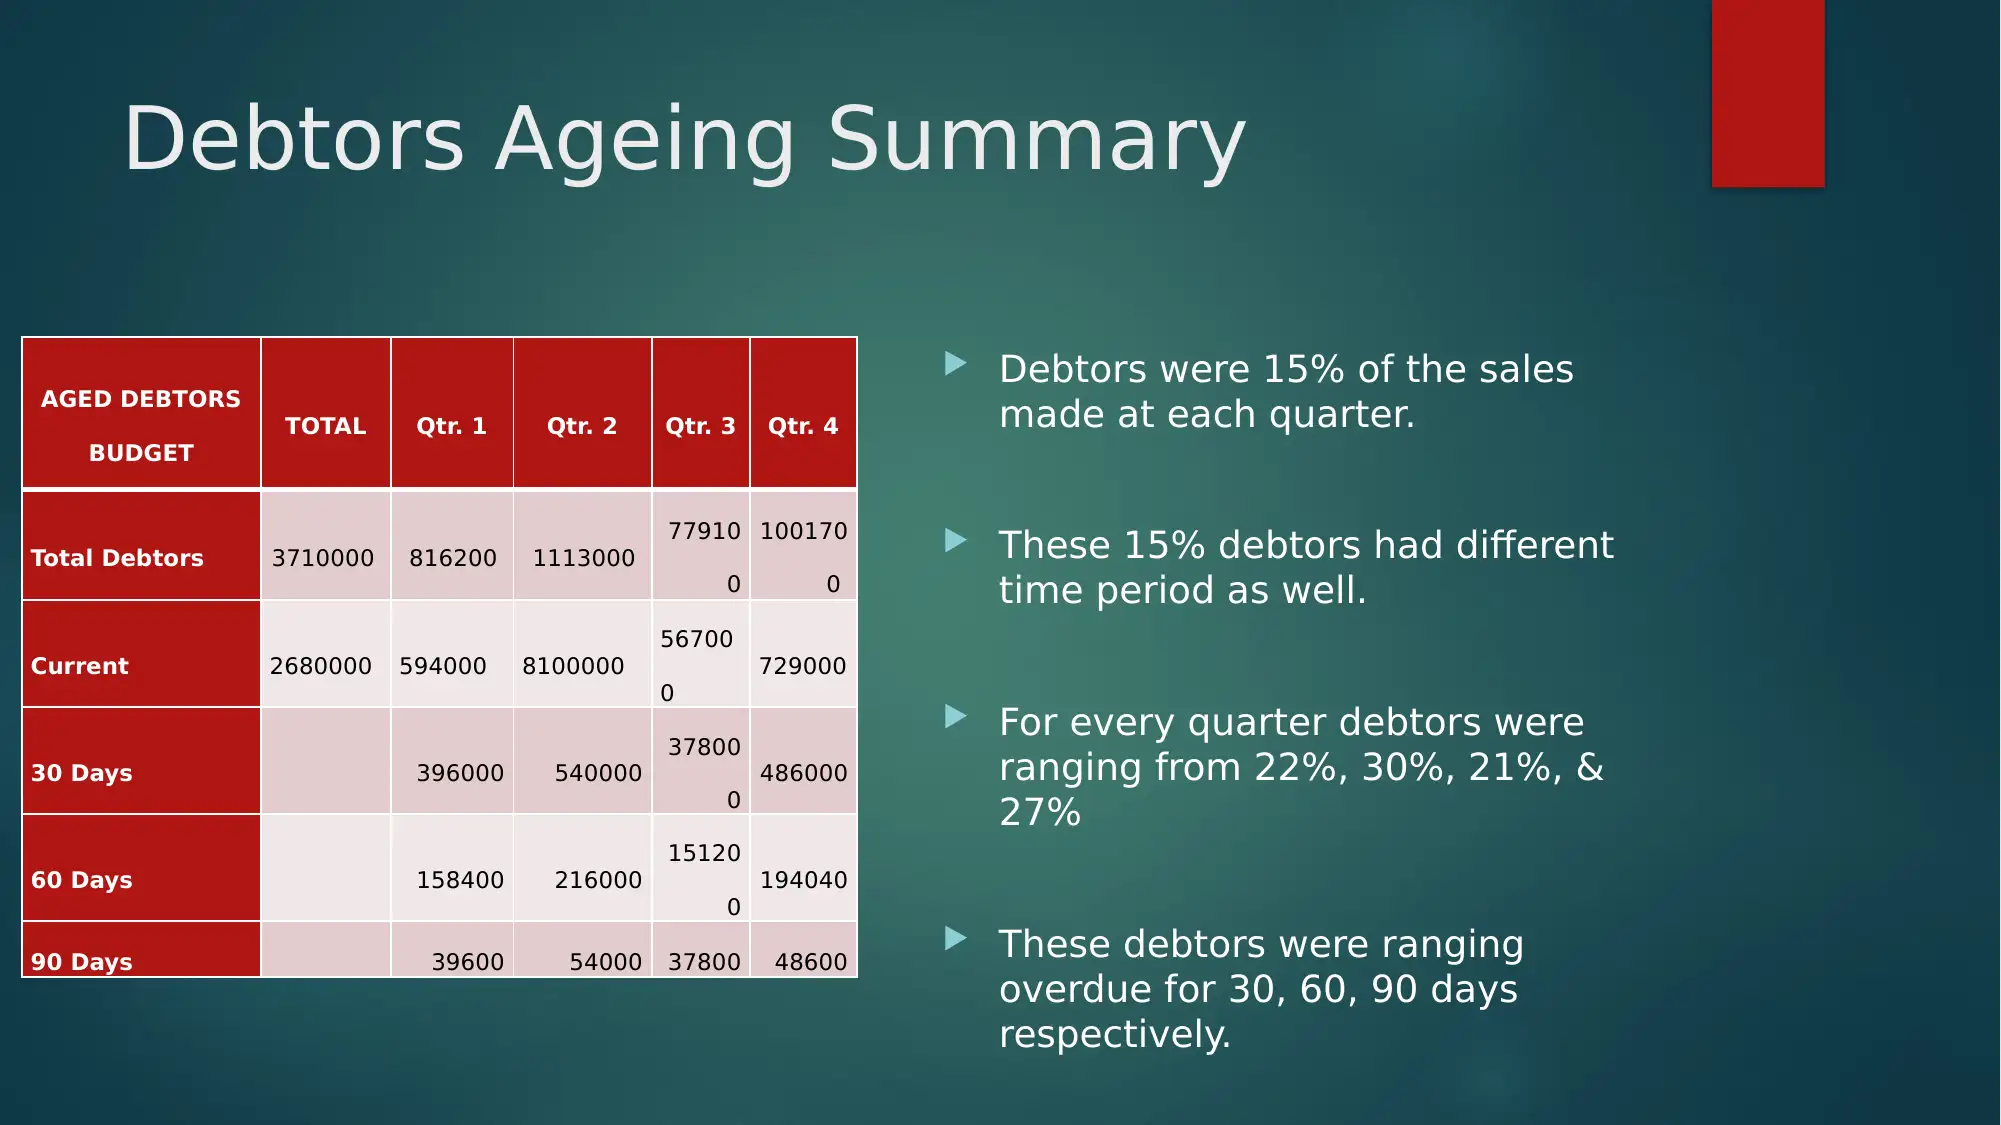
This report presents an analysis of a sales and profit budget, focusing on the discrepancies between budgeted and actual sales figures. The report highlights a decrease in sales during the first quarter, attributed to recessionary pressures and holiday periods, impacting the gross and net profit margins. It examines the GST flow budget, detailing tax collection based on sales, and includes a debtors ageing summary, illustrating the percentage of debtors and their overdue periods. Furthermore, the report assesses the performance of each quarter, discusses financial delegation responsibilities of senior managers and supervisors, and evaluates the impact of external factors such as inflation and statutory requirements on expenditure. The report provides a comprehensive overview of financial performance, cash flow, and the importance of effective financial delegation within an organization. The report also provides recommendations to improve the financial performance.
Document Page
Manage Finance
Assessment 3.2
tabler-icon-diamond-filled.svg

Paraphrase This Document

Need a fresh take? Get an instant paraphrase of this document with our AI Paraphraser
Document Page
Sales and Profit Budget
THE ACTUAL SALES HAS BEEN
DECREASED AS COMPARED TO THE
BUDGETED SALES.
THE SALES IN THE FIRST QUARTER WAS
3% LESS THAN EXPECTED SALES.
SOME EXPENDITURE INCREASED
BECAUSE OF INFLATION RATE
STATUTORY REQUIREMENT LED TO
INCREASE IN THE EXPENDITURE.
PROFIT BUDGET 2018/19 Querter 1 Quarter 2 Quarter 3 Quarter 4
Revenue
Sales 18000000 3960000 5400000 3780000 4860000
(Cost of goods sold) 6100000 1342000 1838000 1281000 1647000
Gross profit (A) 11900000 2618000 3562000 2499000 3213000
Expense
Interest expense 82000 20500 20500 20500 20500
Depreciation Expense 160000 35200 48000 33600 43200
Insurance expense 24600 5412 7380 5166 6642
Store suppliers 4300 946 1290 903 1161
Advertisement 272000 59840 81600 57120 73440
Cleaning, Repair & Maintainence 86520 19034 25956 18170 23360
Cleaning & maintainance labour
charge 50400 11088 15120 10584 13608
Rent 3025000 756250 756250 756250 756250
Website marketing expense 17600 3872 5280 3696 4752
Electricity expense 32960 7251 9888 6922 8899
Fringe benefit tax 39900 8778 11970 8379 10773
Wages and salaries 2640000 580800 792000 554400 712800
Superannuation 249660 54924 74898 52430 67408
Worker's compensation 48960 10771 14688 10282 13219
Total Expense (B) 6733900 1574667 1864820 1538401 1756012
Net profit (before tax) (A-B) 5166100 1043332 1697180 960600 1456988
Income tax @30% 1549830 313000 5091564 288180 437096
Net profit 3616270 730332 1188026 672420 1019892
Document Page
Gross profit reduced greater in terms of percentage since the
cost of goods sold remained constant.
Net profit was reduced as a consequences, though there was
decrease in the amount of Interest.
Sales were targeted at $18000000 which is to achieved in 4
quarters
First quarter performance was not as expected because of the
recession period during that quarter.
Document Page
GST FLOW BUDGET
GST is tax levied on goods and
services sold.
The tax collected is based on the sales
made by the company
The rate of GST is 10%.
The rate of GST was a statutory
requirement based on the total sales
made.
CASH FLOW ANALYSIS – GST 2018/19 Qtr. 1 Qtr. 2 Qtr. 3 Qtr. 4
GST Collected 1800000 396000 540000 378000 486000
Less GST Paid 347884 76534 104365 73056 93929
GST Payable 1452116 319446 435635 304944 392071
CASH FLOW ANALYSIS – GST 2018/19 Qtr. 1 Qtr. 2 Qtr. 3 Qtr. 4
GST Collected 1800000 396000 540000 378000 486000
Less GST Paid 347884 76534 104365 73056 93929
GST Payable 1452116 319446 435635 304944 392071
tabler-icon-diamond-filled.svg

Paraphrase This Document

Need a fresh take? Get an instant paraphrase of this document with our AI Paraphraser
Document Page
Debtors Ageing Summary
AGED DEBTORS
BUDGET
TOTAL Qtr. 1 Qtr. 2 Qtr. 3 Qtr. 4
Total Debtors 3710000 816200 1113000
77910
0
100170
0
Current 2680000 594000 8100000
56700
0
729000
30 Days 396000 540000
37800
0
486000
60 Days 158400 216000
15120
0
194040
90 Days 39600 54000 37800 48600
Debtors were 15% of the sales
made at each quarter.
These 15% debtors had different
time period as well.
For every quarter debtors were
ranging from 22%, 30%, 21%, &
27%
These debtors were ranging
overdue for 30, 60, 90 days
respectively.
Document Page
Performance of each quarter
In the first quarter sales were declining from the budgeted statement.
The reason for declining budget were recession and the holidays that
reduced the sales.
Assuming recession being a temporary phenomenon the sales may
increase and will contrast a positive impact on the company’s
performance.
Even the problem regarding holidays which were maybe because of
the vacation shall be deemed to complete.
Document Page
Financial delegation
Senior manager: The senior managers has considerable
responsibility regarding a lot of discretionary authority.
The senior managers has more discretion and greater financial
authority than other managers.
Responsible for planning and directing the work of groups and that of
the individual
tabler-icon-diamond-filled.svg

Paraphrase This Document

Need a fresh take? Get an instant paraphrase of this document with our AI Paraphraser
Document Page
Responsibility of stores managers are:
Recruiting, supervising and appraising staff
Managing budgets
Maintaining statistical and financial records.
Dealing with customers query and complaints.
Overseeing pricing and stock control.
Document Page
Financial delegation of supervisor:
Setting goals for performance
Ensuring that company’s plan and visions are achieved within
deadline
Organising workflow and ensuring that employees understand
tgheir duties and delegated task.
Monitoring employees productivity and providing constructive
feedback and coaching
Document Page
Thank You
chevron_up_icon
1 out of 10
circle_padding
hide_on_mobile
zoom_out_icon
[object Object]