ACC00716 Finance Assignment: Time Value, Bonds, and Portfolio Analysis
VerifiedAdded on 2022/08/27
|12
|2097
|23
Homework Assignment
AI Summary
This assignment report addresses various time value of money and bond valuation questions related to a specific company, the Commonwealth Bank of Australia (CBA). The report begins with calculations of present value, revenue forecasting, effective annual rates for loan options, quarterly loan payments, and yield to maturity of bonds. It then moves on to a risk and return analysis, calculating the expected return of CBA stock and a hypothetical company using the Capital Asset Pricing Model (CAPM). A portfolio comprising the stocks of both companies is constructed, and its return and beta are calculated. The report also includes a risk assessment comparing the volatility of the CBA stock to the market index, highlighting the portfolio's diversification benefits in mitigating risk and maximizing returns. The assignment uses data sourced from S&P Capital IQ and includes a discussion of the concepts of beta and its significance in risk assessment.

Running head: CBA
CBA
Name of the Student:
Name of the University:
Author Note:
CBA
Name of the Student:
Name of the University:
Author Note:
Paraphrase This Document
Need a fresh take? Get an instant paraphrase of this document with our AI Paraphraser
1CBA
Table of Contents
Introduction:...............................................................................................................................2
Answer to part 1:........................................................................................................................2
Part a:.....................................................................................................................................2
Part b:.....................................................................................................................................3
Part c:.....................................................................................................................................3
Part d:.....................................................................................................................................4
Part e:.....................................................................................................................................4
Part f:......................................................................................................................................5
Answer to part 2:........................................................................................................................5
Part a:.....................................................................................................................................5
Part i:..................................................................................................................................5
Part ii:.................................................................................................................................6
Part b:.....................................................................................................................................7
Answer to part 3:........................................................................................................................7
Bibliographies:.........................................................................................................................10
2CBA
Introduction:
In the following report various Time value of money and bond valuation questions are
answered which had been provided in the assignment. The questions were related to the
Commonwealth Bank of Australia and the first six questions have been answered along with
the screenshot of the solved solution. In question 2, the expected return of the stock is
calculated using the capital assets pricing model and also the expected return of the
hypothetical company is calculated. A portfolio comprising of the stock of these two
companies is constructed and a risk return analysis of the stock and portfolio is conducted in
Question 3.
Answer to part 1:
Part a:
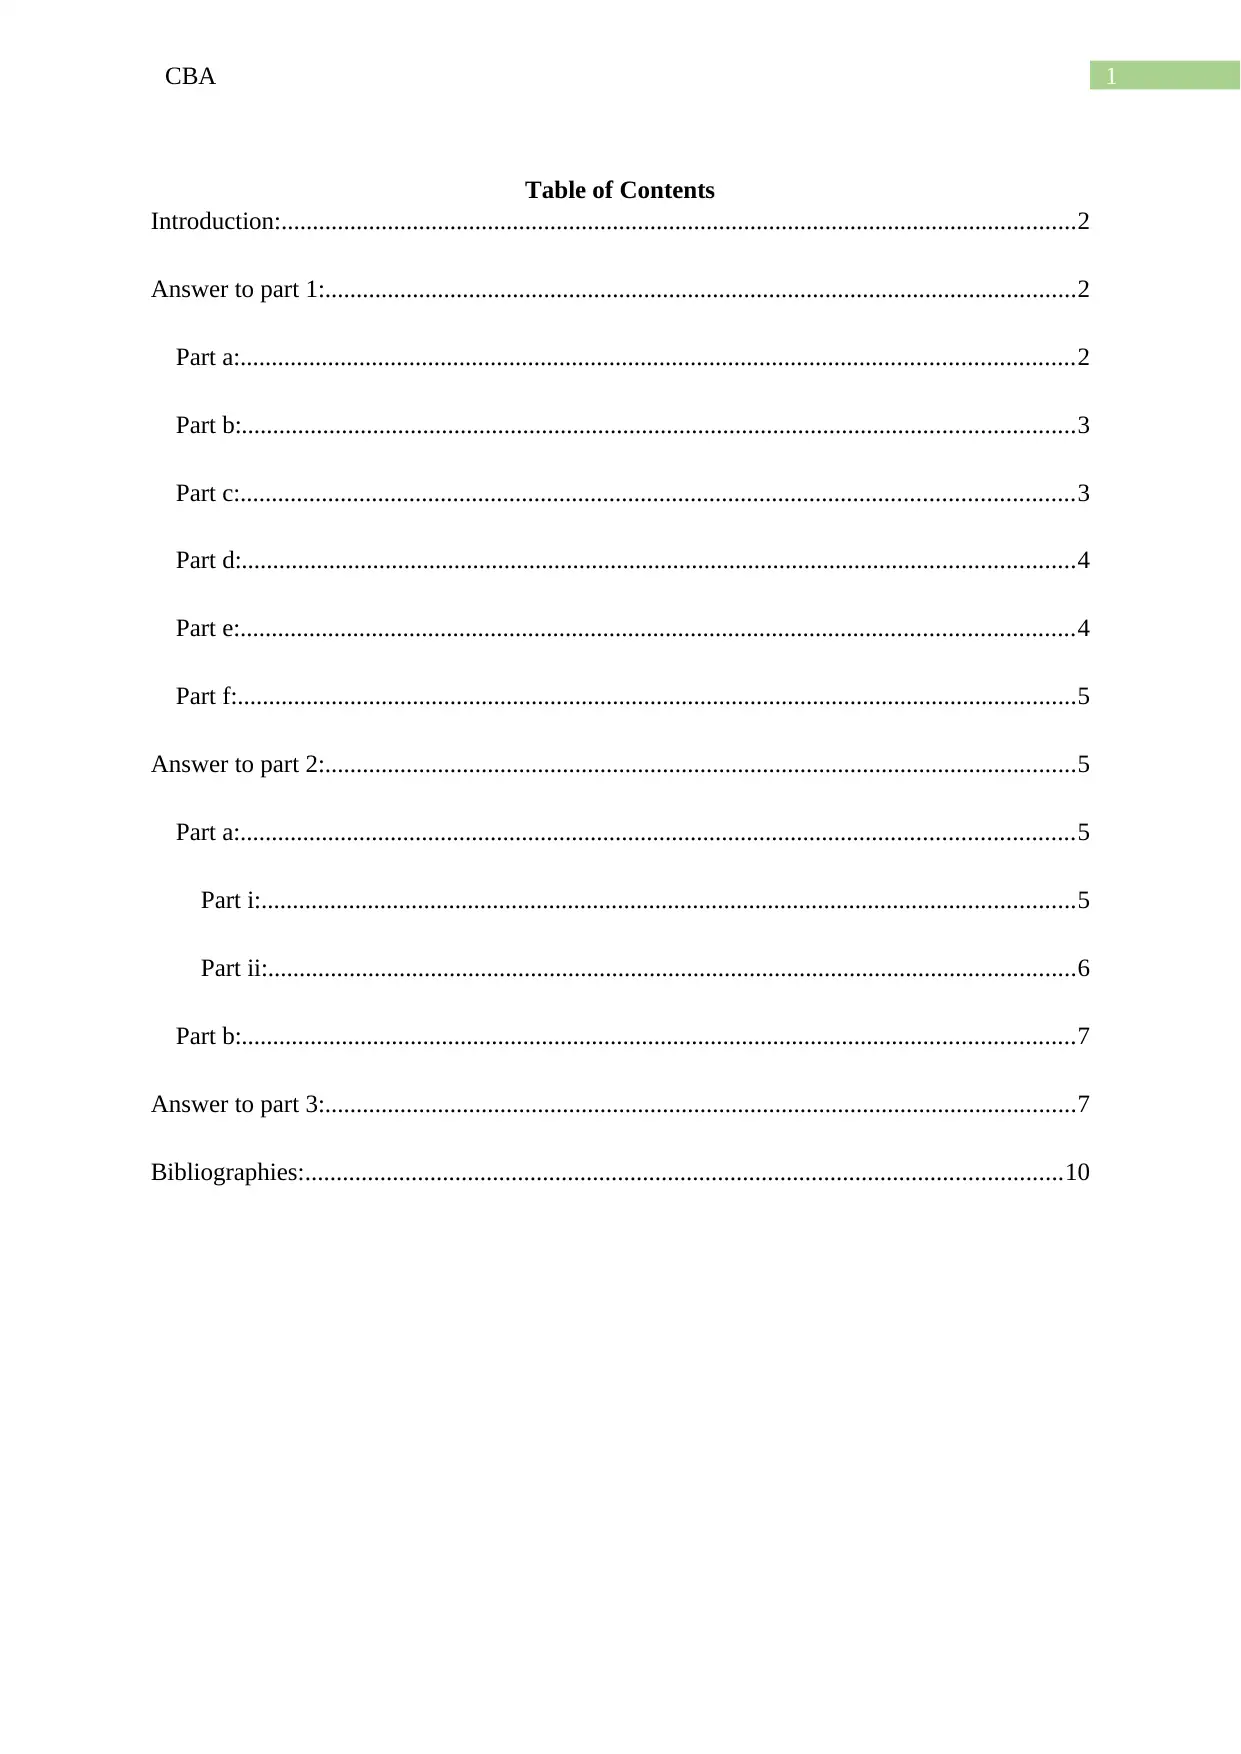
The money which will be received by the case company from the bank is the present
value of the future payments and is $5069.10. The periods is taken as 60 while the per month
amount which is received by the company is $98. The rate at which the amount is to be
discounted is 0.5% which is calculated by dividing the annual rate by 12. The future value of
the amount is taken as 0 (Alford, Luchtenberg and Reddie 2018).
Figure 1: Amount which is to be received from the bank.
Source: By the Author
Introduction:
In the following report various Time value of money and bond valuation questions are
answered which had been provided in the assignment. The questions were related to the
Commonwealth Bank of Australia and the first six questions have been answered along with
the screenshot of the solved solution. In question 2, the expected return of the stock is
calculated using the capital assets pricing model and also the expected return of the
hypothetical company is calculated. A portfolio comprising of the stock of these two
companies is constructed and a risk return analysis of the stock and portfolio is conducted in
Question 3.
Answer to part 1:
Part a:
The money which will be received by the case company from the bank is the present
value of the future payments and is $5069.10. The periods is taken as 60 while the per month
amount which is received by the company is $98. The rate at which the amount is to be
discounted is 0.5% which is calculated by dividing the annual rate by 12. The future value of
the amount is taken as 0 (Alford, Luchtenberg and Reddie 2018).
Figure 1: Amount which is to be received from the bank.
Source: By the Author
⊘ This is a preview!⊘
Do you want full access?
Subscribe today to unlock all pages.
Trusted by 1+ million students worldwide
3CBA
Part b:
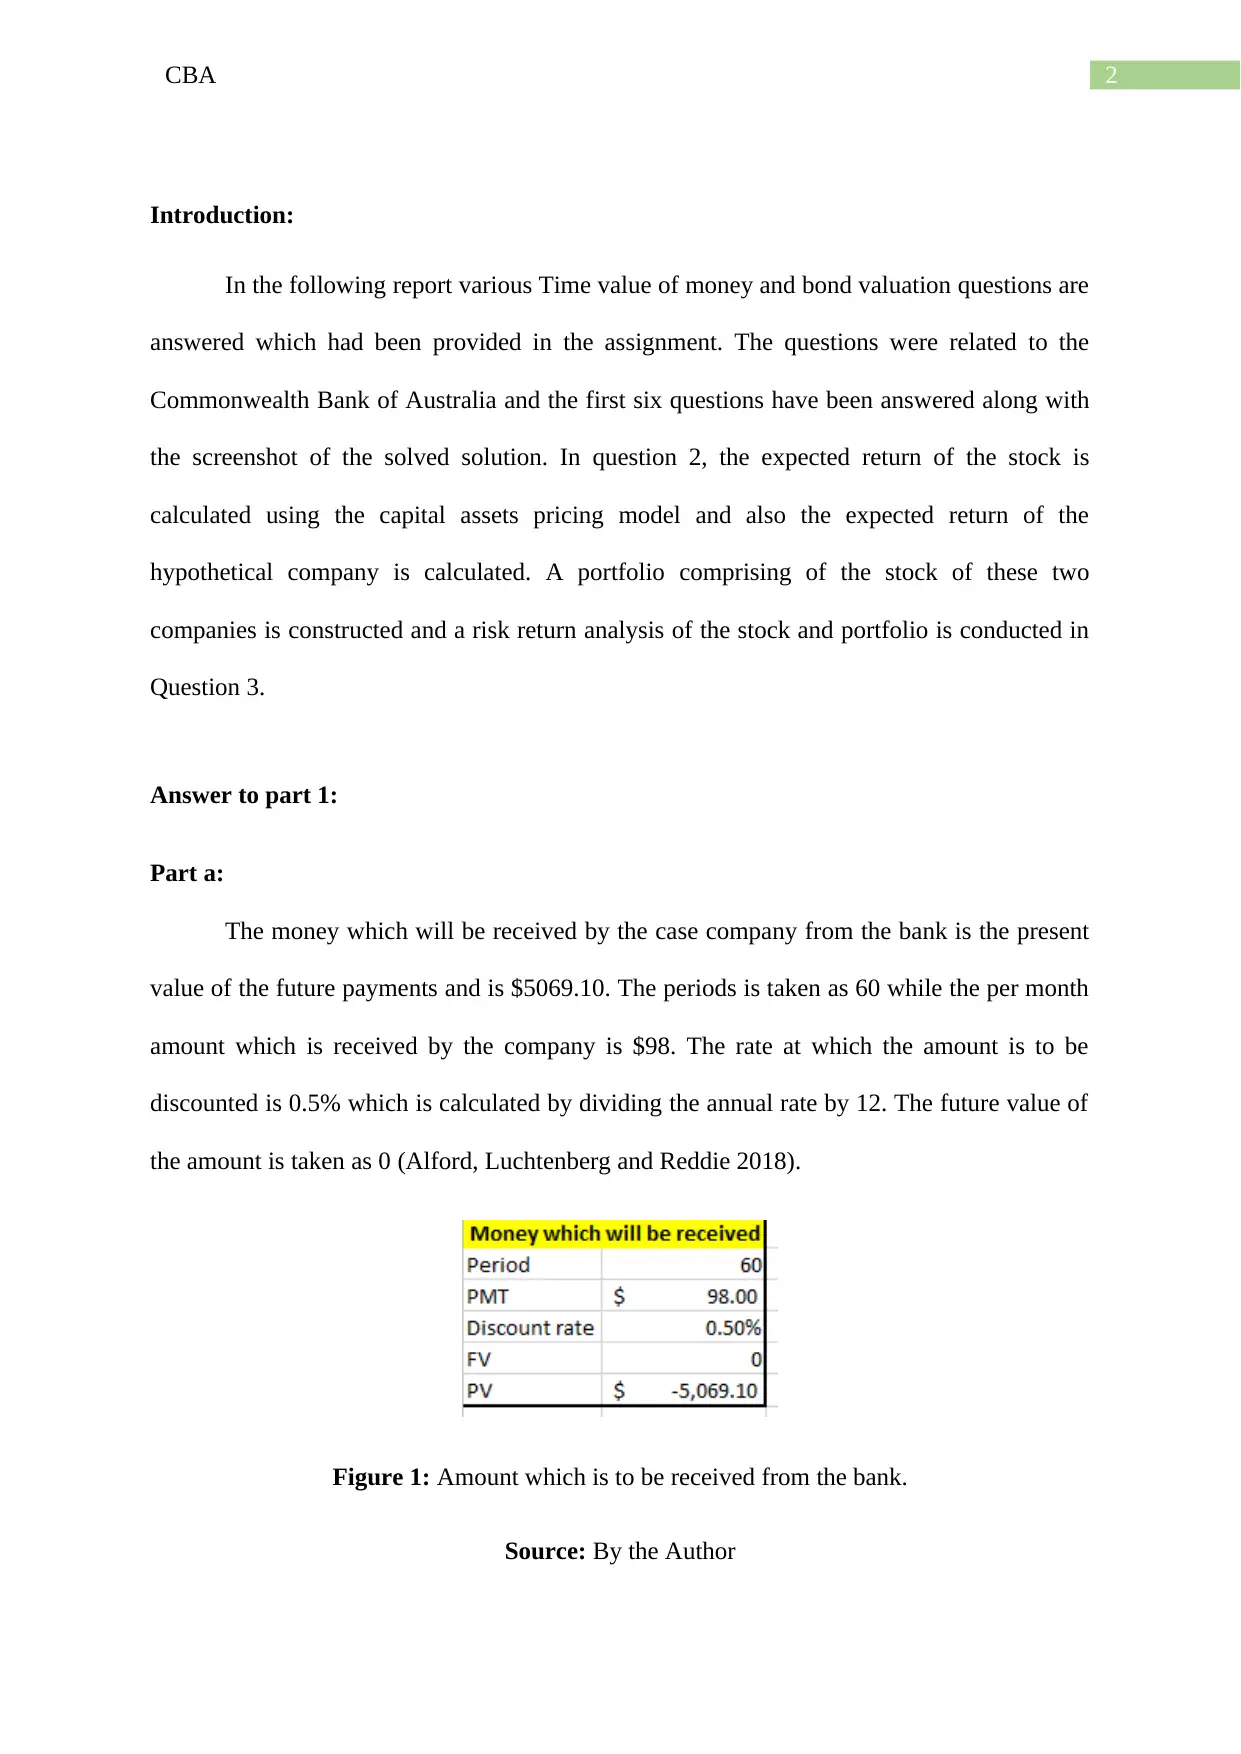
The current revenue for the commonwealth bank of Australia is taken as $22856,
while the growth rate of the revenue is 1.22%. Thus by using the chain method the revenue
for the Bank is calculated for the 7Th year. The projected revenue for the bank in the seventh
year is $24880.81.
Alternative method of calculating the revenue for the seventh year for the bank is to
take the growth rate and is raised to the power of seven which is multiplied with the current
revenue (Chandra 2017).
Figure 2: Forecasted Revenue for CAB at the 7th Year.
Source: By the Author
Part c:
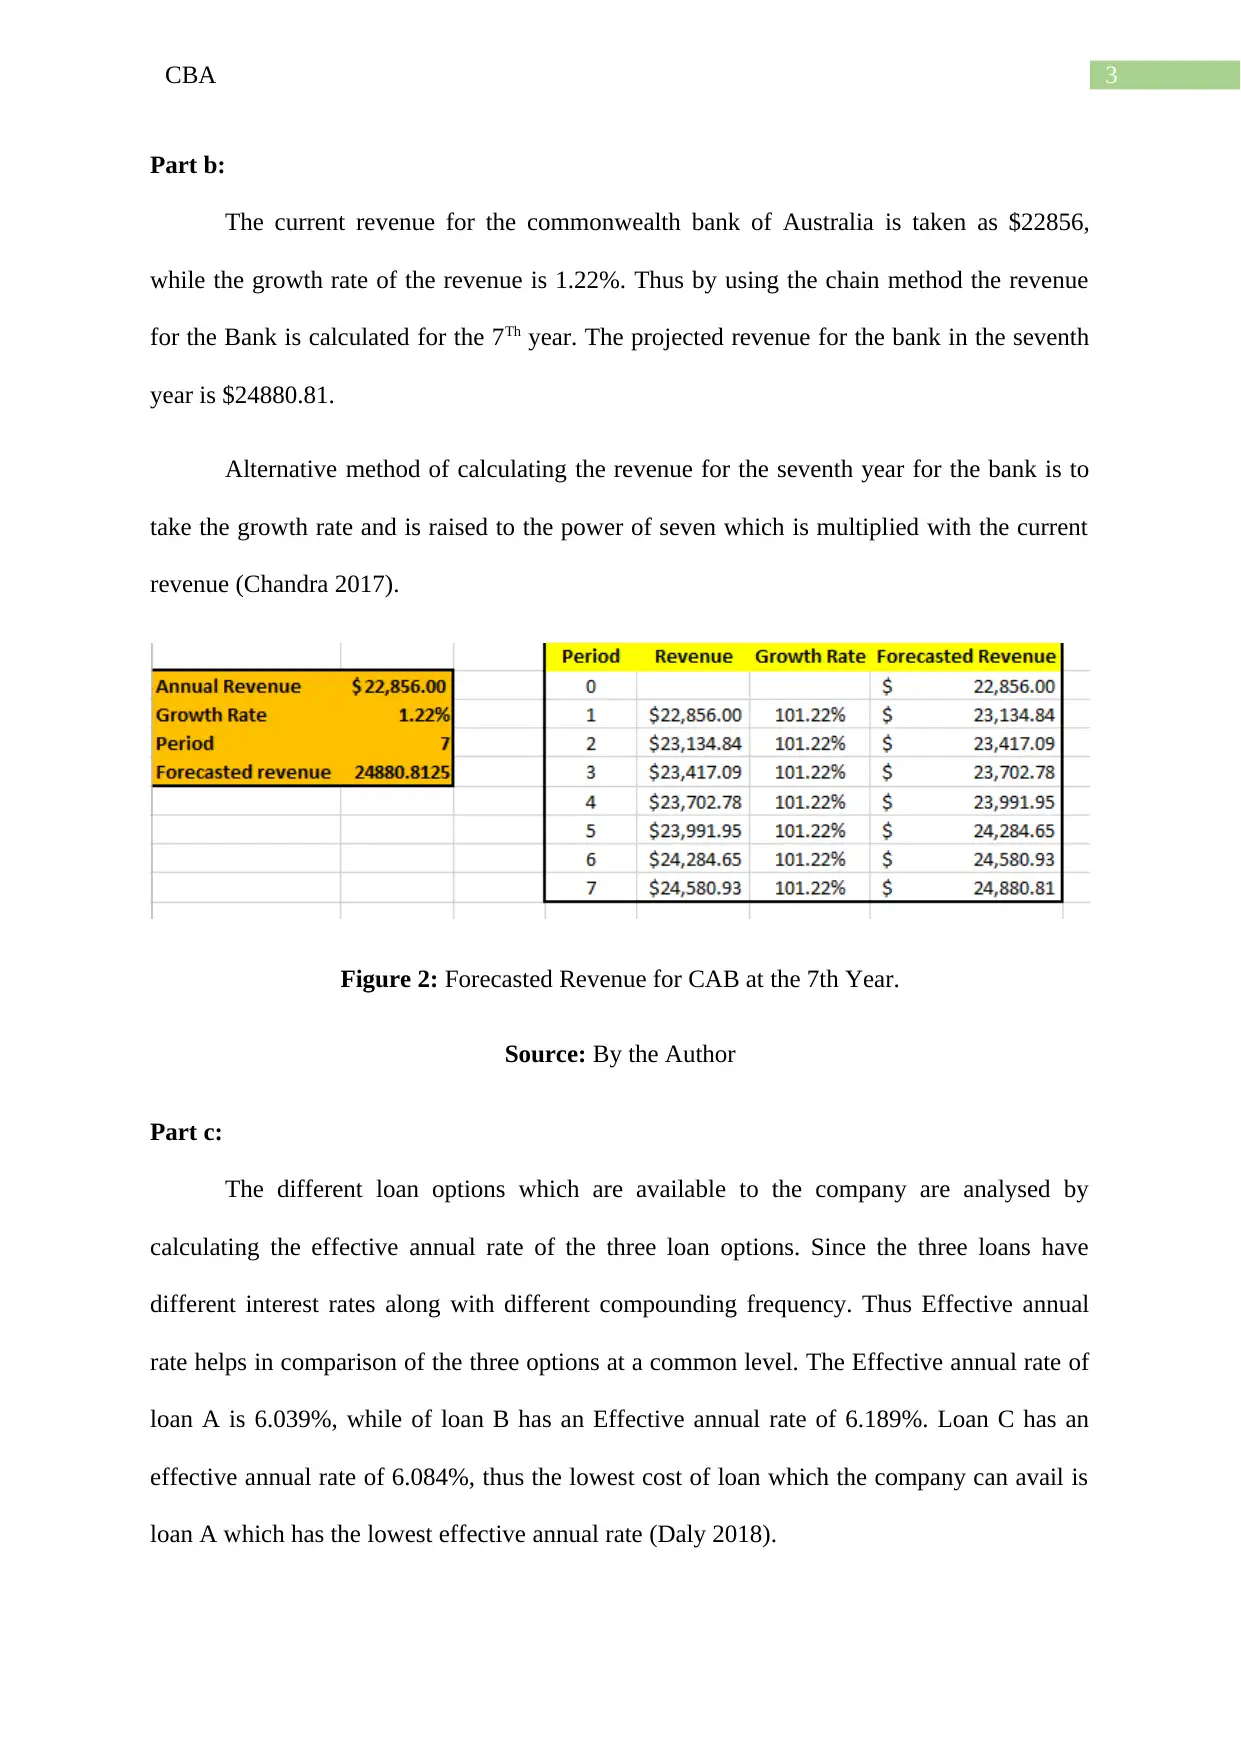
The different loan options which are available to the company are analysed by
calculating the effective annual rate of the three loan options. Since the three loans have
different interest rates along with different compounding frequency. Thus Effective annual
rate helps in comparison of the three options at a common level. The Effective annual rate of
loan A is 6.039%, while of loan B has an Effective annual rate of 6.189%. Loan C has an
effective annual rate of 6.084%, thus the lowest cost of loan which the company can avail is
loan A which has the lowest effective annual rate (Daly 2018).
Part b:
The current revenue for the commonwealth bank of Australia is taken as $22856,
while the growth rate of the revenue is 1.22%. Thus by using the chain method the revenue
for the Bank is calculated for the 7Th year. The projected revenue for the bank in the seventh
year is $24880.81.
Alternative method of calculating the revenue for the seventh year for the bank is to
take the growth rate and is raised to the power of seven which is multiplied with the current
revenue (Chandra 2017).
Figure 2: Forecasted Revenue for CAB at the 7th Year.
Source: By the Author
Part c:
The different loan options which are available to the company are analysed by
calculating the effective annual rate of the three loan options. Since the three loans have
different interest rates along with different compounding frequency. Thus Effective annual
rate helps in comparison of the three options at a common level. The Effective annual rate of
loan A is 6.039%, while of loan B has an Effective annual rate of 6.189%. Loan C has an
effective annual rate of 6.084%, thus the lowest cost of loan which the company can avail is
loan A which has the lowest effective annual rate (Daly 2018).
Paraphrase This Document
Need a fresh take? Get an instant paraphrase of this document with our AI Paraphraser
4CBA
Figure 3: Effective Annual Rate of the three loans
Source: By the Author
Part d:
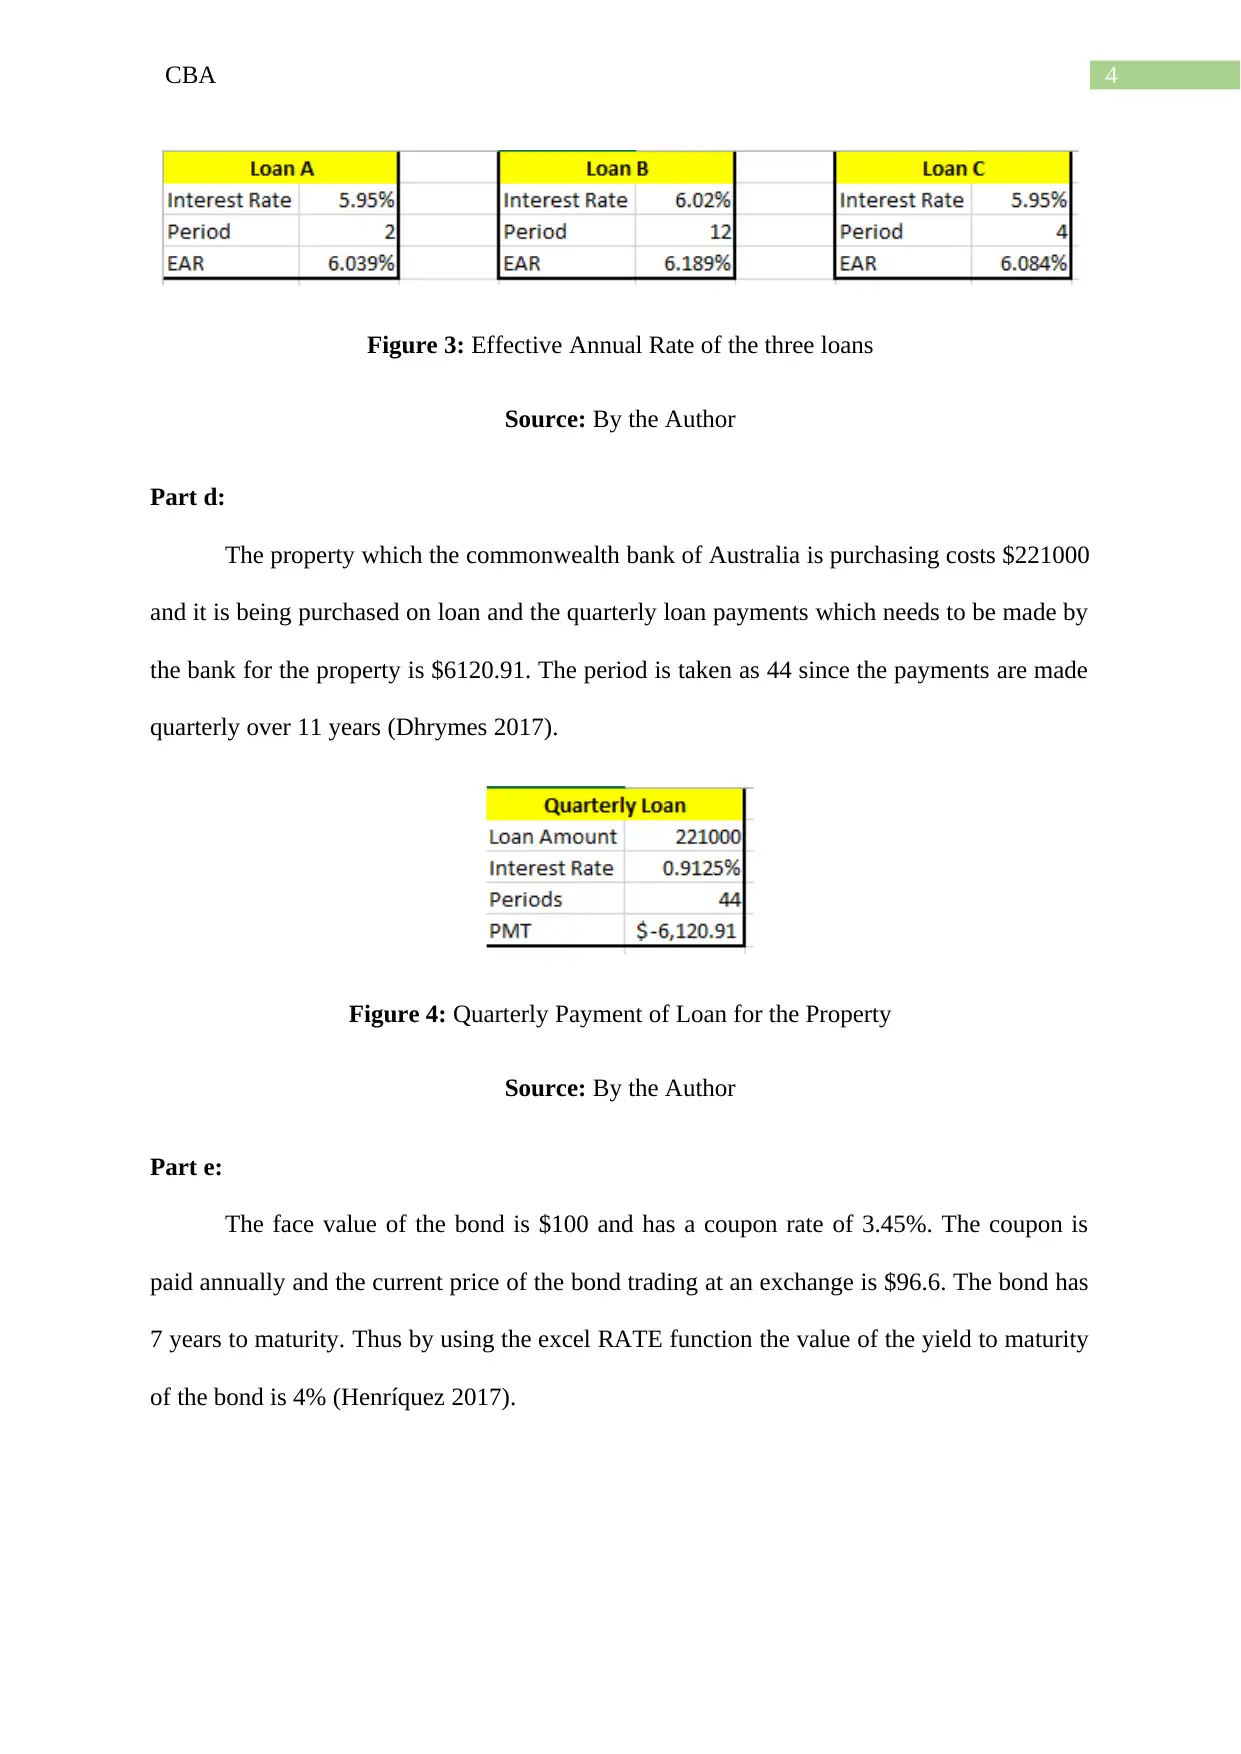
The property which the commonwealth bank of Australia is purchasing costs $221000
and it is being purchased on loan and the quarterly loan payments which needs to be made by
the bank for the property is $6120.91. The period is taken as 44 since the payments are made
quarterly over 11 years (Dhrymes 2017).
Figure 4: Quarterly Payment of Loan for the Property
Source: By the Author
Part e:
The face value of the bond is $100 and has a coupon rate of 3.45%. The coupon is
paid annually and the current price of the bond trading at an exchange is $96.6. The bond has
7 years to maturity. Thus by using the excel RATE function the value of the yield to maturity
of the bond is 4% (Henríquez 2017).
Figure 3: Effective Annual Rate of the three loans
Source: By the Author
Part d:
The property which the commonwealth bank of Australia is purchasing costs $221000
and it is being purchased on loan and the quarterly loan payments which needs to be made by
the bank for the property is $6120.91. The period is taken as 44 since the payments are made
quarterly over 11 years (Dhrymes 2017).
Figure 4: Quarterly Payment of Loan for the Property
Source: By the Author
Part e:
The face value of the bond is $100 and has a coupon rate of 3.45%. The coupon is
paid annually and the current price of the bond trading at an exchange is $96.6. The bond has
7 years to maturity. Thus by using the excel RATE function the value of the yield to maturity
of the bond is 4% (Henríquez 2017).
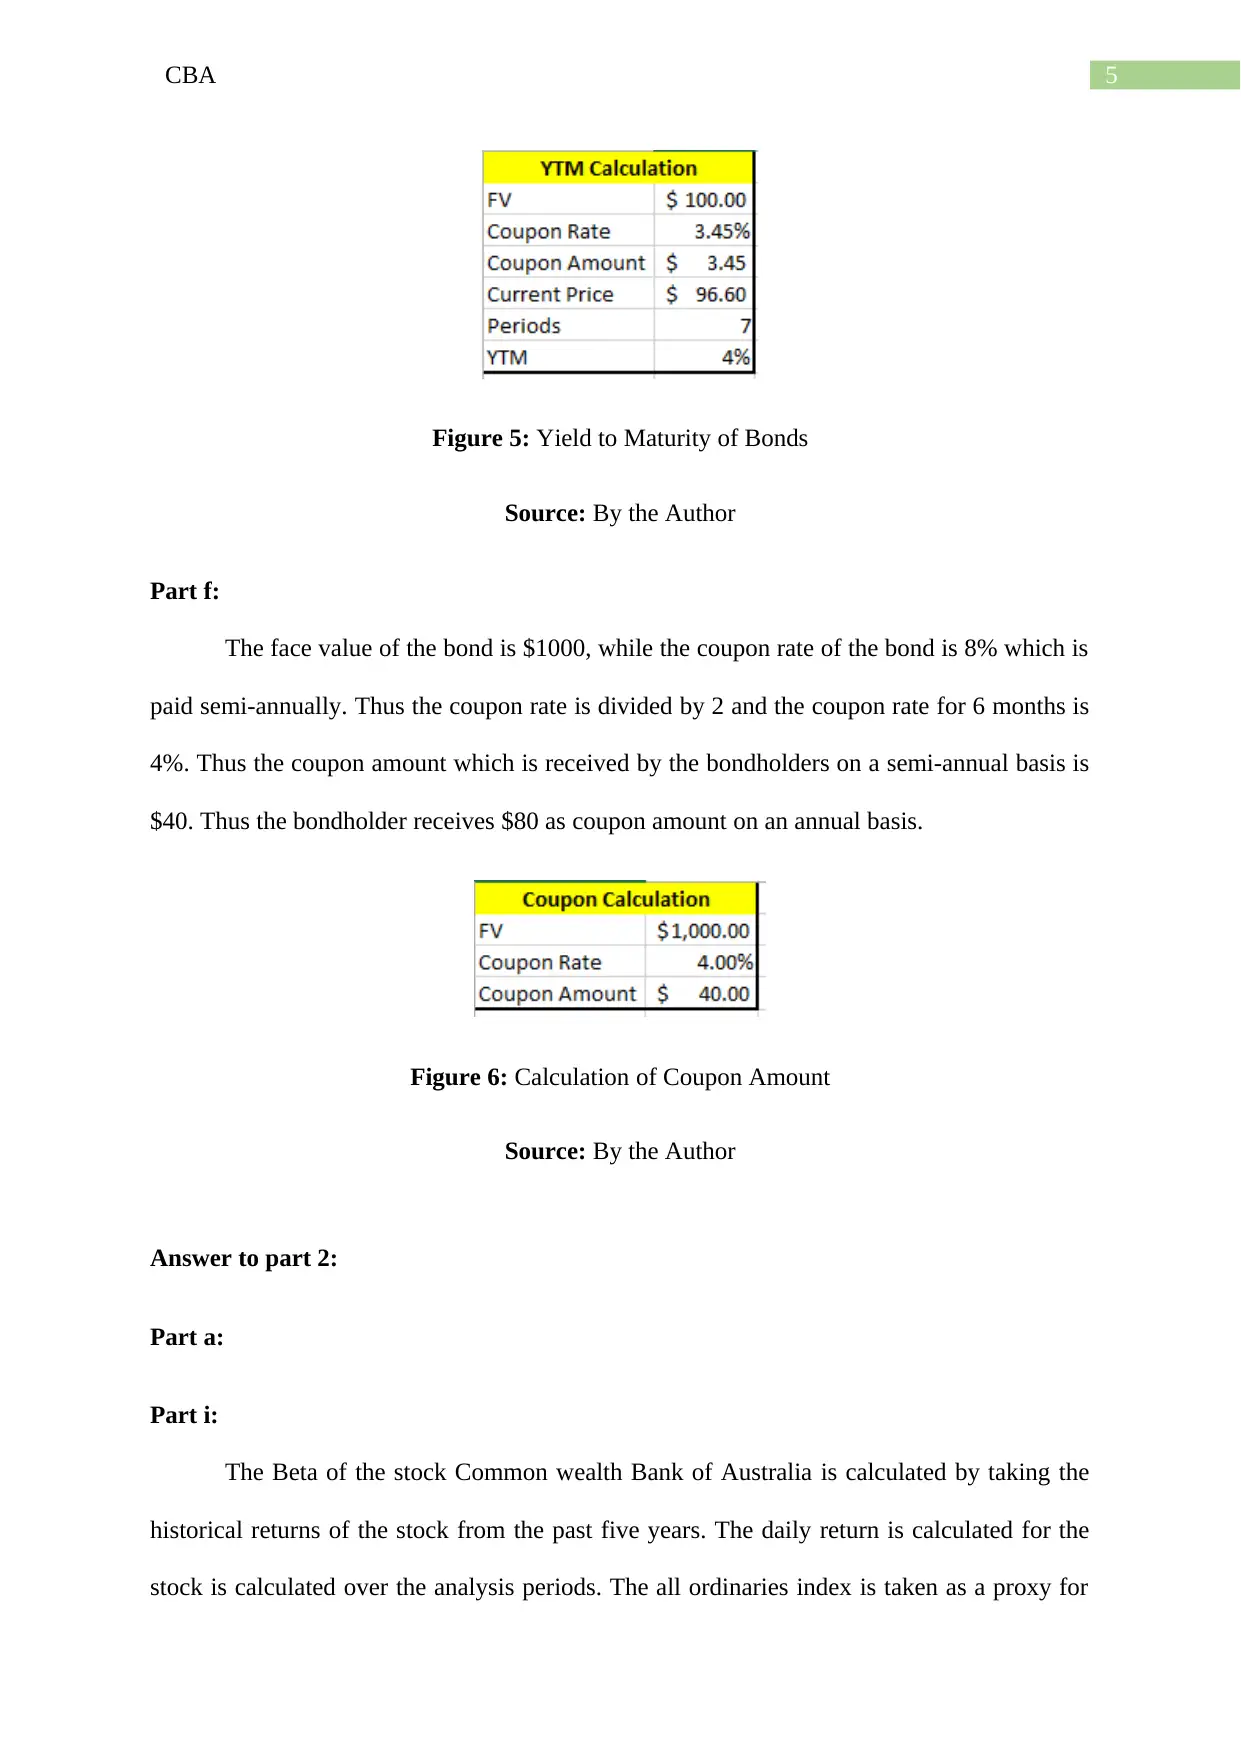
5CBA
Figure 5: Yield to Maturity of Bonds
Source: By the Author
Part f:
The face value of the bond is $1000, while the coupon rate of the bond is 8% which is
paid semi-annually. Thus the coupon rate is divided by 2 and the coupon rate for 6 months is
4%. Thus the coupon amount which is received by the bondholders on a semi-annual basis is
$40. Thus the bondholder receives $80 as coupon amount on an annual basis.
Figure 6: Calculation of Coupon Amount
Source: By the Author
Answer to part 2:
Part a:
Part i:
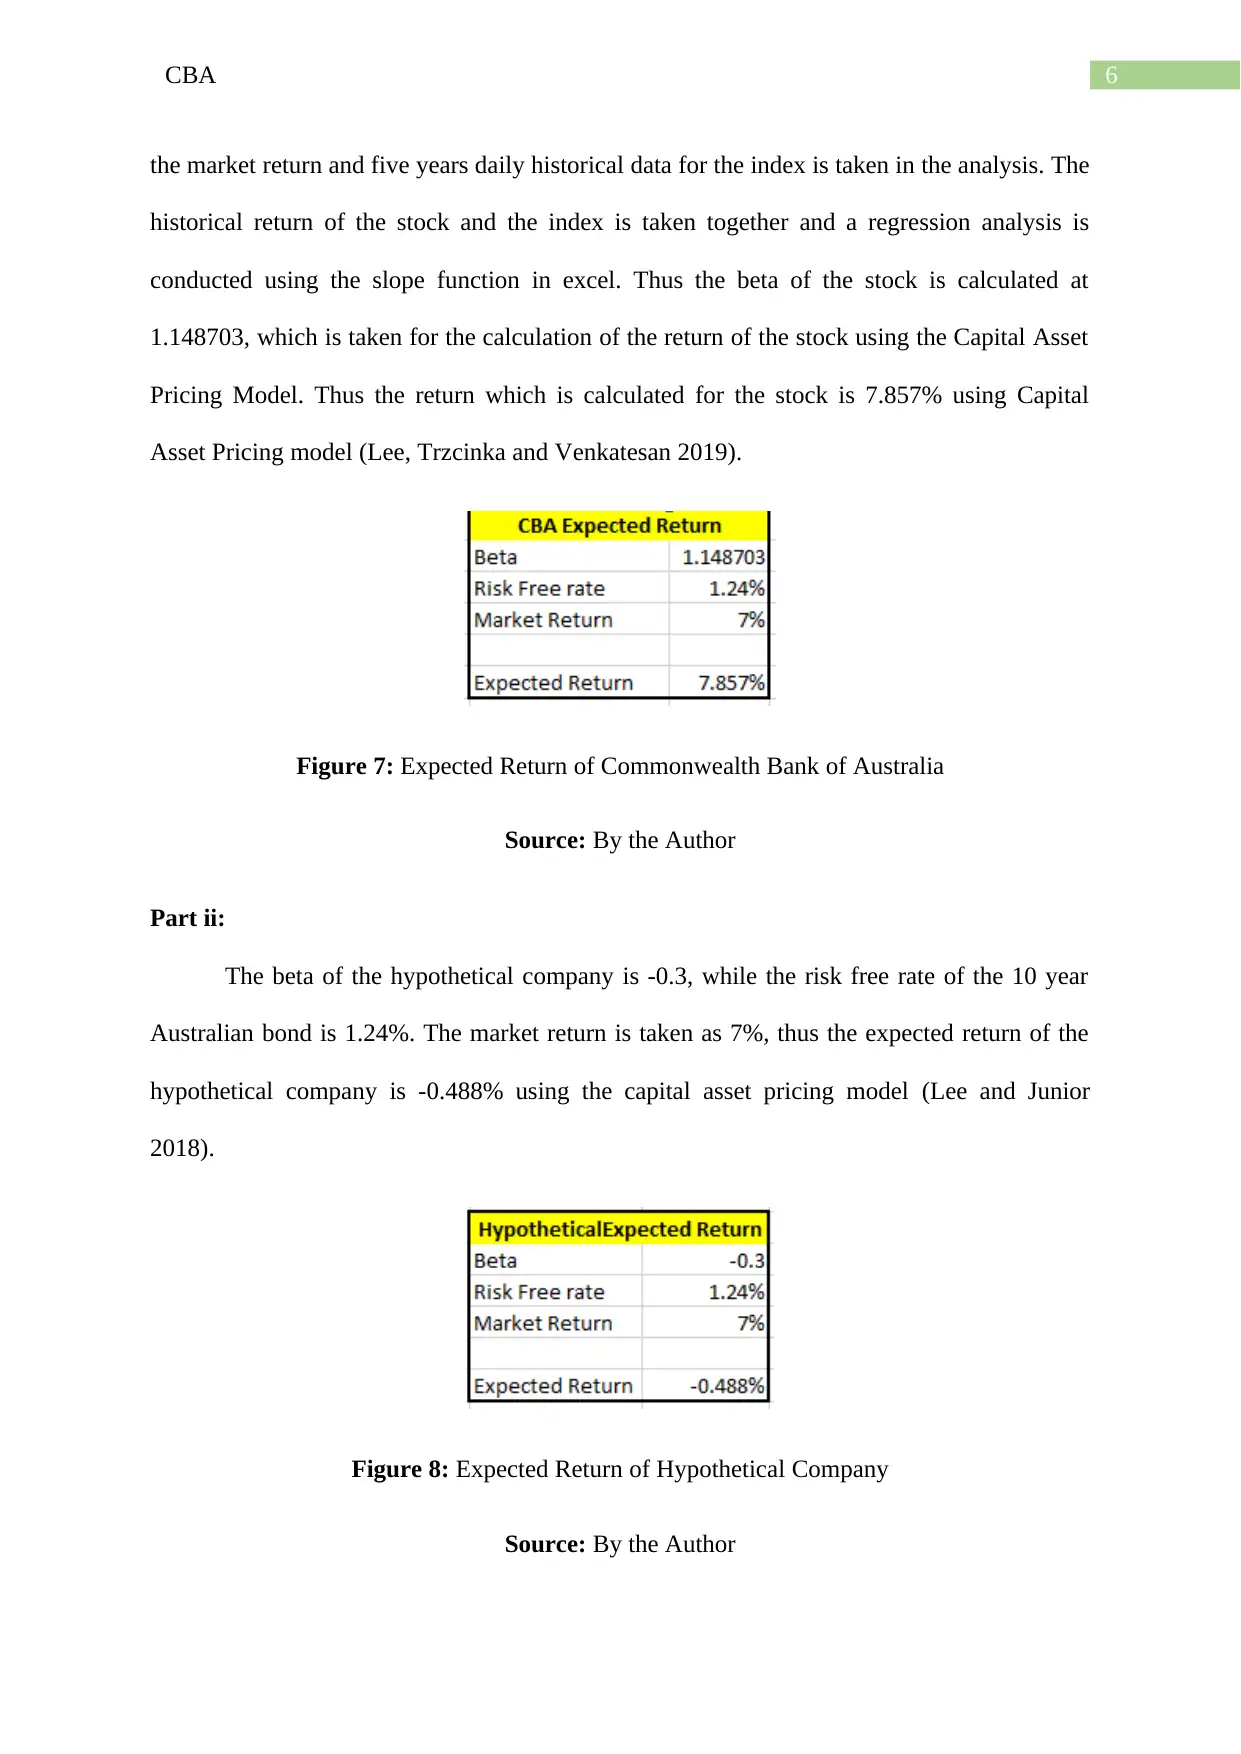
The Beta of the stock Common wealth Bank of Australia is calculated by taking the
historical returns of the stock from the past five years. The daily return is calculated for the
stock is calculated over the analysis periods. The all ordinaries index is taken as a proxy for
Figure 5: Yield to Maturity of Bonds
Source: By the Author
Part f:
The face value of the bond is $1000, while the coupon rate of the bond is 8% which is
paid semi-annually. Thus the coupon rate is divided by 2 and the coupon rate for 6 months is
4%. Thus the coupon amount which is received by the bondholders on a semi-annual basis is
$40. Thus the bondholder receives $80 as coupon amount on an annual basis.
Figure 6: Calculation of Coupon Amount
Source: By the Author
Answer to part 2:
Part a:
Part i:
The Beta of the stock Common wealth Bank of Australia is calculated by taking the
historical returns of the stock from the past five years. The daily return is calculated for the
stock is calculated over the analysis periods. The all ordinaries index is taken as a proxy for
⊘ This is a preview!⊘
Do you want full access?
Subscribe today to unlock all pages.
Trusted by 1+ million students worldwide
6CBA
the market return and five years daily historical data for the index is taken in the analysis. The
historical return of the stock and the index is taken together and a regression analysis is
conducted using the slope function in excel. Thus the beta of the stock is calculated at
1.148703, which is taken for the calculation of the return of the stock using the Capital Asset
Pricing Model. Thus the return which is calculated for the stock is 7.857% using Capital
Asset Pricing model (Lee, Trzcinka and Venkatesan 2019).
Figure 7: Expected Return of Commonwealth Bank of Australia
Source: By the Author
Part ii:
The beta of the hypothetical company is -0.3, while the risk free rate of the 10 year
Australian bond is 1.24%. The market return is taken as 7%, thus the expected return of the
hypothetical company is -0.488% using the capital asset pricing model (Lee and Junior
2018).
Figure 8: Expected Return of Hypothetical Company
Source: By the Author
Paraphrase This Document
Need a fresh take? Get an instant paraphrase of this document with our AI Paraphraser
7CBA
Part b:
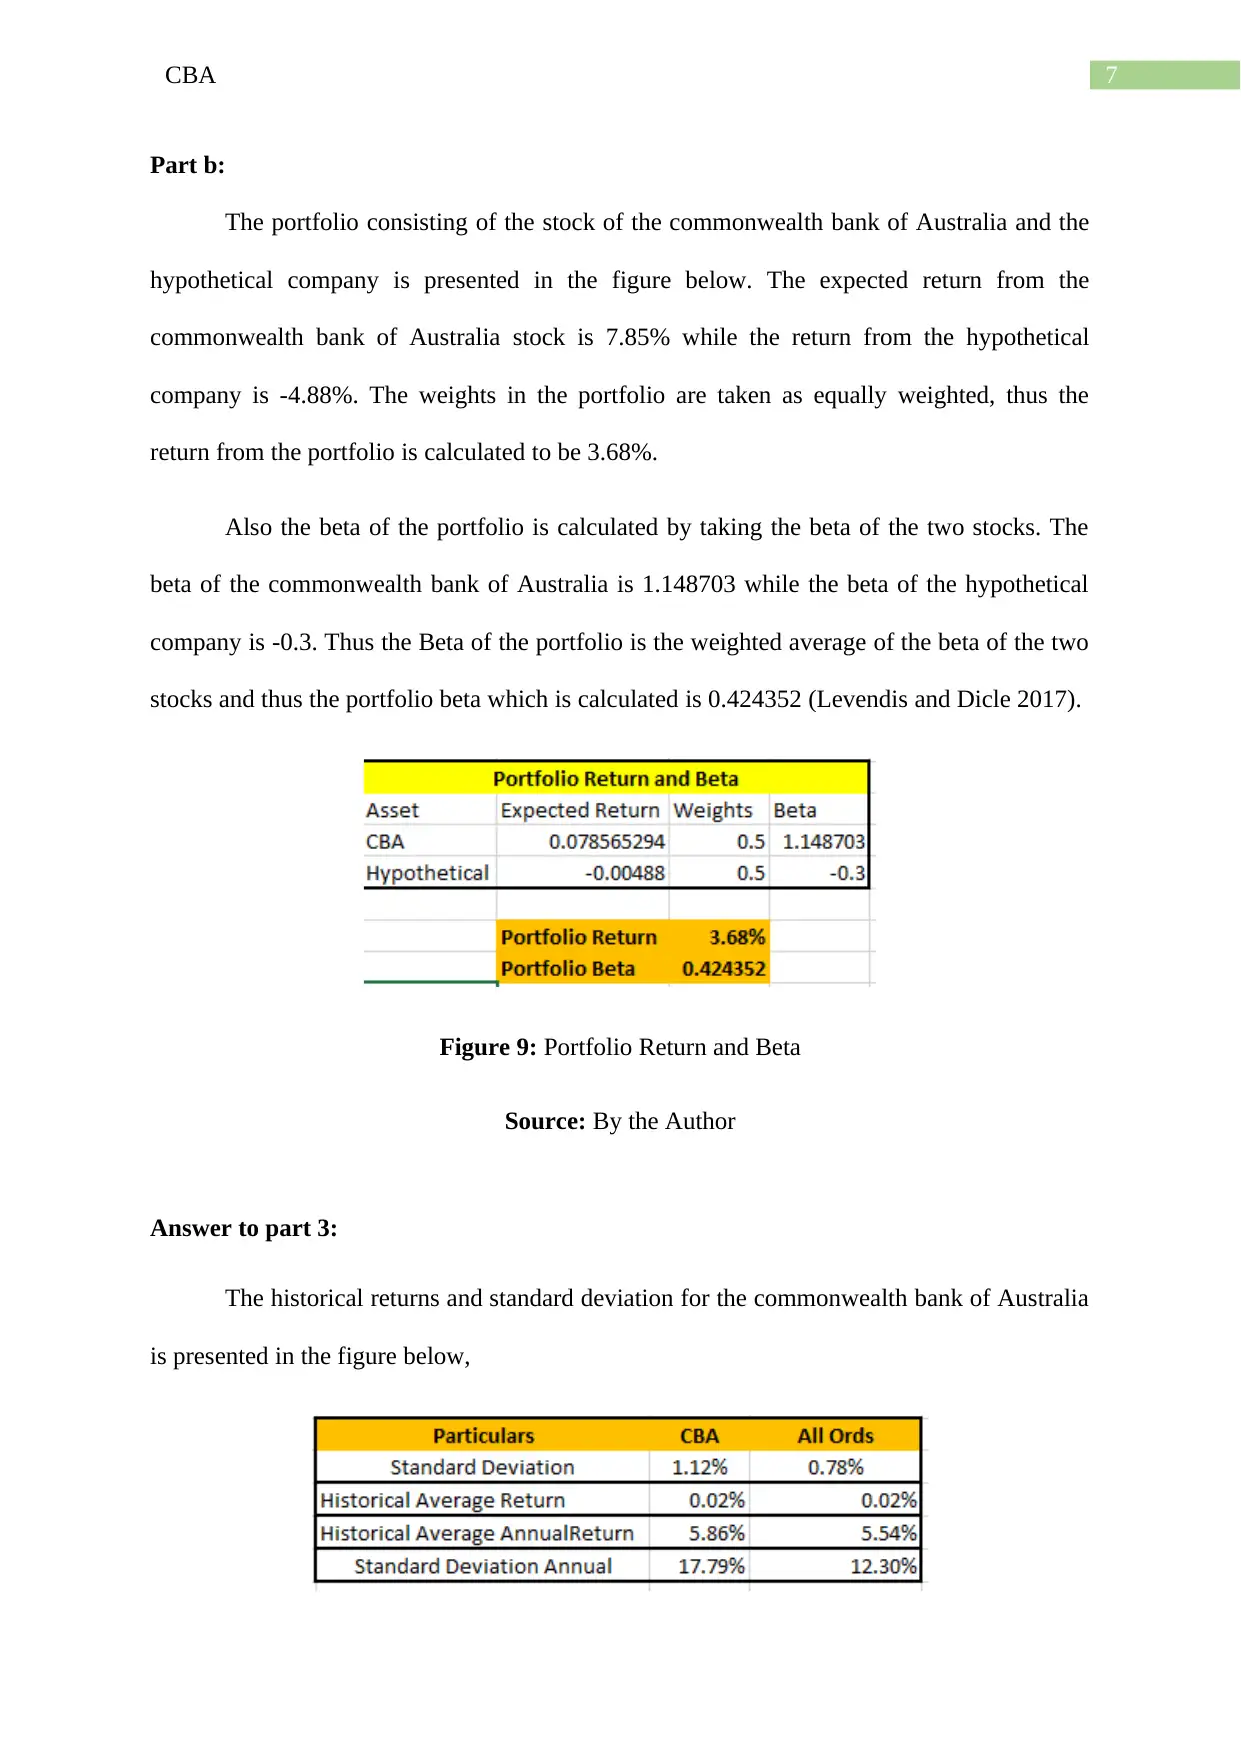
The portfolio consisting of the stock of the commonwealth bank of Australia and the
hypothetical company is presented in the figure below. The expected return from the
commonwealth bank of Australia stock is 7.85% while the return from the hypothetical
company is -4.88%. The weights in the portfolio are taken as equally weighted, thus the
return from the portfolio is calculated to be 3.68%.
Also the beta of the portfolio is calculated by taking the beta of the two stocks. The
beta of the commonwealth bank of Australia is 1.148703 while the beta of the hypothetical
company is -0.3. Thus the Beta of the portfolio is the weighted average of the beta of the two
stocks and thus the portfolio beta which is calculated is 0.424352 (Levendis and Dicle 2017).
Figure 9: Portfolio Return and Beta
Source: By the Author
Answer to part 3:
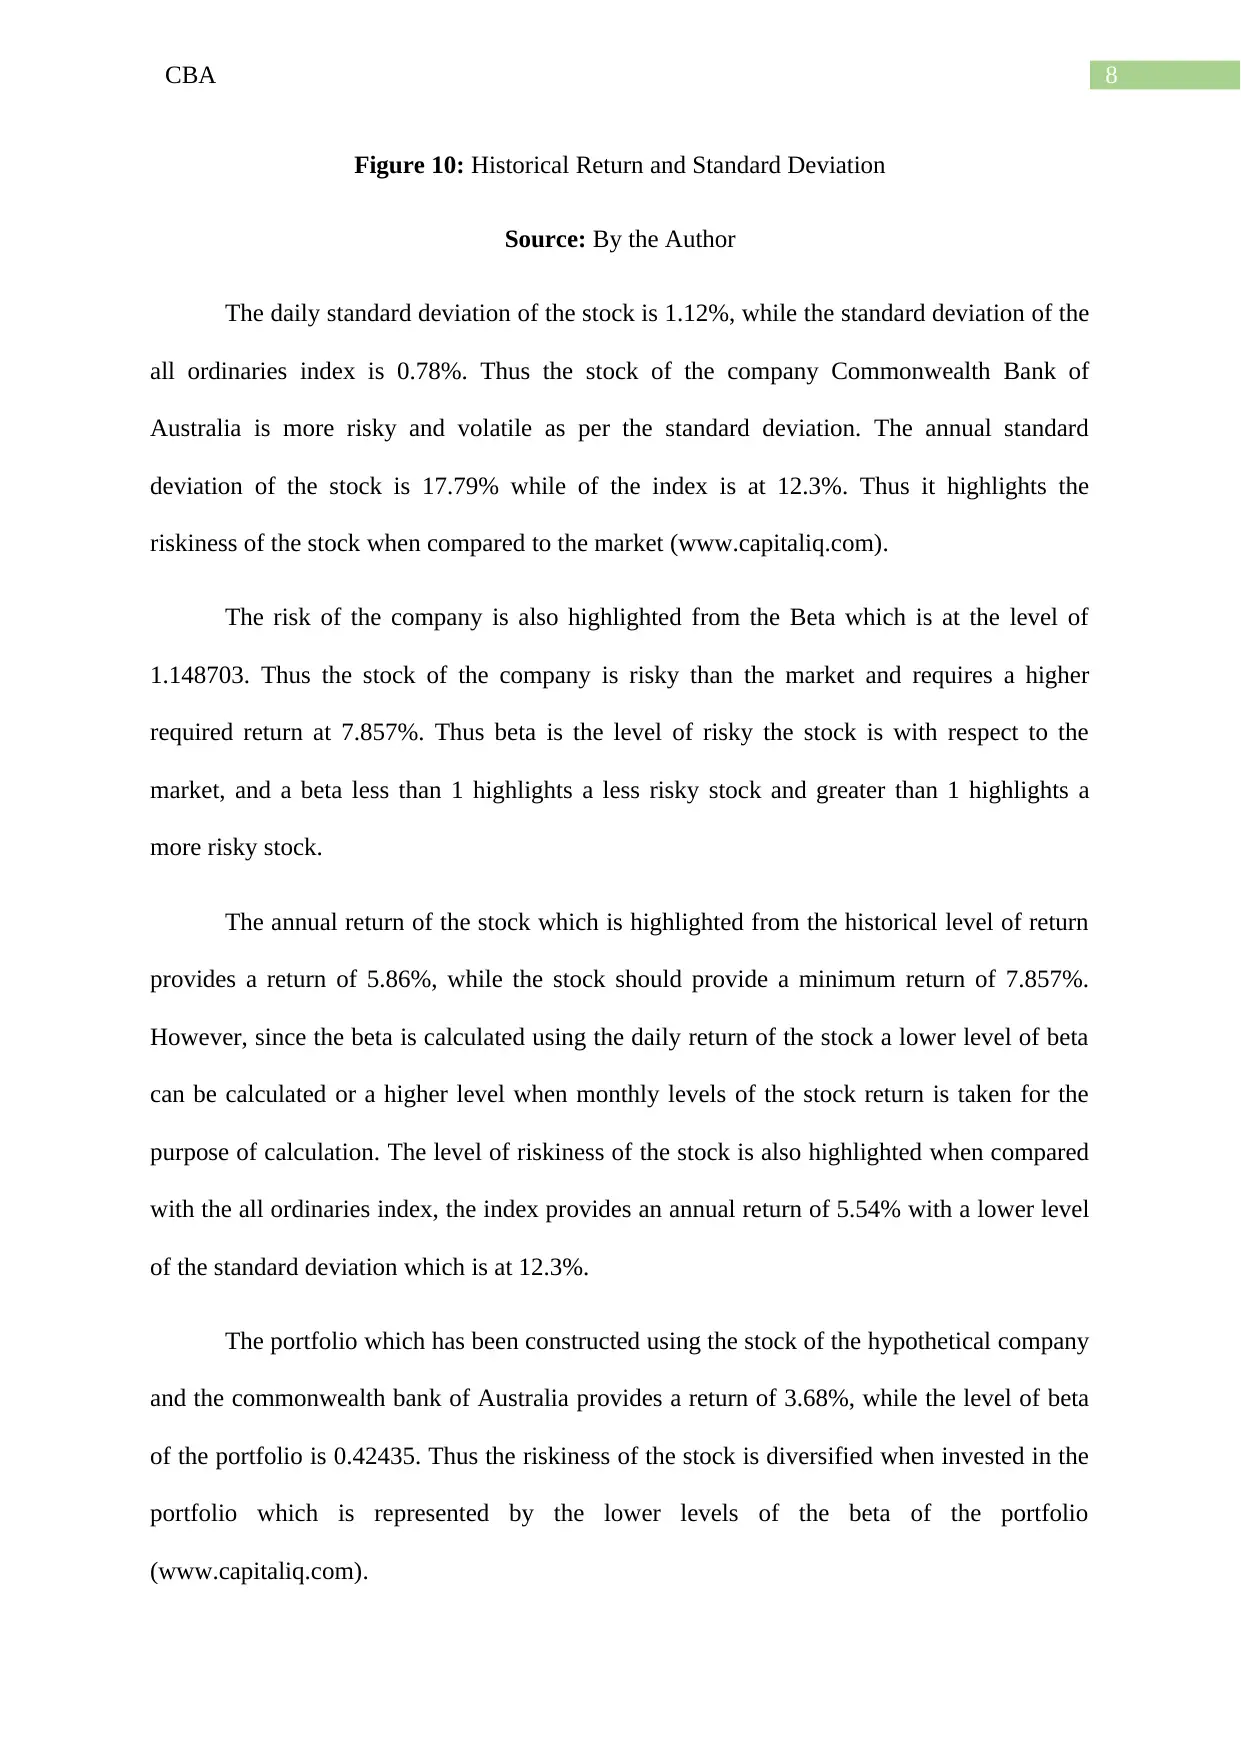
The historical returns and standard deviation for the commonwealth bank of Australia
is presented in the figure below,
Part b:
The portfolio consisting of the stock of the commonwealth bank of Australia and the
hypothetical company is presented in the figure below. The expected return from the
commonwealth bank of Australia stock is 7.85% while the return from the hypothetical
company is -4.88%. The weights in the portfolio are taken as equally weighted, thus the
return from the portfolio is calculated to be 3.68%.
Also the beta of the portfolio is calculated by taking the beta of the two stocks. The
beta of the commonwealth bank of Australia is 1.148703 while the beta of the hypothetical
company is -0.3. Thus the Beta of the portfolio is the weighted average of the beta of the two
stocks and thus the portfolio beta which is calculated is 0.424352 (Levendis and Dicle 2017).
Figure 9: Portfolio Return and Beta
Source: By the Author
Answer to part 3:
The historical returns and standard deviation for the commonwealth bank of Australia
is presented in the figure below,
8CBA
Figure 10: Historical Return and Standard Deviation
Source: By the Author
The daily standard deviation of the stock is 1.12%, while the standard deviation of the
all ordinaries index is 0.78%. Thus the stock of the company Commonwealth Bank of
Australia is more risky and volatile as per the standard deviation. The annual standard
deviation of the stock is 17.79% while of the index is at 12.3%. Thus it highlights the
riskiness of the stock when compared to the market (www.capitaliq.com).
The risk of the company is also highlighted from the Beta which is at the level of
1.148703. Thus the stock of the company is risky than the market and requires a higher
required return at 7.857%. Thus beta is the level of risky the stock is with respect to the
market, and a beta less than 1 highlights a less risky stock and greater than 1 highlights a
more risky stock.
The annual return of the stock which is highlighted from the historical level of return
provides a return of 5.86%, while the stock should provide a minimum return of 7.857%.
However, since the beta is calculated using the daily return of the stock a lower level of beta
can be calculated or a higher level when monthly levels of the stock return is taken for the
purpose of calculation. The level of riskiness of the stock is also highlighted when compared
with the all ordinaries index, the index provides an annual return of 5.54% with a lower level
of the standard deviation which is at 12.3%.
The portfolio which has been constructed using the stock of the hypothetical company
and the commonwealth bank of Australia provides a return of 3.68%, while the level of beta
of the portfolio is 0.42435. Thus the riskiness of the stock is diversified when invested in the
portfolio which is represented by the lower levels of the beta of the portfolio
(www.capitaliq.com).
⊘ This is a preview!⊘
Do you want full access?
Subscribe today to unlock all pages.
Trusted by 1+ million students worldwide
9CBA
Thus as per the benefits of diversification of a portfolio, a portfolio tends to reduce
risk while maximising the return to the investor. Thus if an investor would have invested all
his funds in the commonwealth bank of Australia stock, it would had generated a higher
return but at a high level of risk, which is seen by the high beta. Also if an investor would
have invested all their funds in the hypothetical company the return would had been negative
even when the risk which is denoted by beta is negative. Thus when the investor had invested
their funds in a portfolio comprising of these two assets, it led to reduction in risk, which is
seen by the portfolio beta. Thus the return which is generated by the portfolio is the
maximized return at the lowest level of risk (Shrivastav 2017).
Paraphrase This Document
Need a fresh take? Get an instant paraphrase of this document with our AI Paraphraser
10CBA
References:
Alford, R.M., Luchtenberg, K.F. and Reddie, W.D., 2018. Portfolio Management and
Earnings Management: Evidence from Property and Casualty Insurers. Journal of Accounting
& Finance (2158-3625), 18(4).
Chandra, P., 2017. Investment analysis and portfolio management. McGraw-Hill Education.
Daly, M., 2018. Feasible portfolios under tracking error, β, α and utility
constraints. Investment Management & Financial Innovations, 15(1), p.141.
Dhrymes, P.J., 2017. Portfolio theory: origins, Markowitz and CAPM based selection.
In Portfolio Construction, Measurement, and Efficiency (pp. 39-48). Springer, Cham.
Henríquez, R., Wenzel, G., Olivares, D.E. and Negrete-Pincetic, M., 2017. Participation of
demand response aggregators in electricity markets: Optimal portfolio management. IEEE
Transactions on Smart Grid, 9(5), pp.4861-4871.
Lee, J.H., Trzcinka, C. and Venkatesan, S., 2019. Do Portfolio Manager Contracts Contract
Portfolio Management?. The Journal of Finance.
Lee, S.C. and Eid Junior, W., 2018. Portfolio construction and risk management: theory
versus practice. RAUSP Management Journal, 53(3), pp.345-365.
Levendis, J. and Dicle, M.F., 2017. Calculating a Portfolio's Beta. Journal of Economics and
Finance Education, Forthcoming.
Log In | S&P Capital IQ (2020). Available at:
https://www.capitaliq.com/CIQDotNet/MacroEconomics/InterestRate.aspx?
companyId=50027527 (Accessed: 9 January 2020).
11CBA
Log In | S&P Capital IQ (2020). Available at:
https://www.capitaliq.com/CIQDotNet/MacroEconomics/InterestRate.aspx?
companyId=50027527 (Accessed: 9 January 2020).
Shrivastav, S.M., 2017. CAPM: EMPIRICAL EVIDENCE FROM INDIA. International
Journal Of Core Engineering & Management, 3(10).
Log In | S&P Capital IQ (2020). Available at:
https://www.capitaliq.com/CIQDotNet/MacroEconomics/InterestRate.aspx?
companyId=50027527 (Accessed: 9 January 2020).
Shrivastav, S.M., 2017. CAPM: EMPIRICAL EVIDENCE FROM INDIA. International
Journal Of Core Engineering & Management, 3(10).
⊘ This is a preview!⊘
Do you want full access?
Subscribe today to unlock all pages.
Trusted by 1+ million students worldwide
1 out of 12
Related Documents


Your All-in-One AI-Powered Toolkit for Academic Success.
+13062052269
info@desklib.com
Available 24*7 on WhatsApp / Email
![[object Object]](/_next/static/media/star-bottom.7253800d.svg)
Unlock your academic potential
Copyright © 2020–2026 A2Z Services. All Rights Reserved. Developed and managed by ZUCOL.