ACC00716 Finance Assignment 2: TVM, Risk and Return Analysis for Boral
VerifiedAdded on 2023/01/23
|15
|2509
|86
Homework Assignment
AI Summary
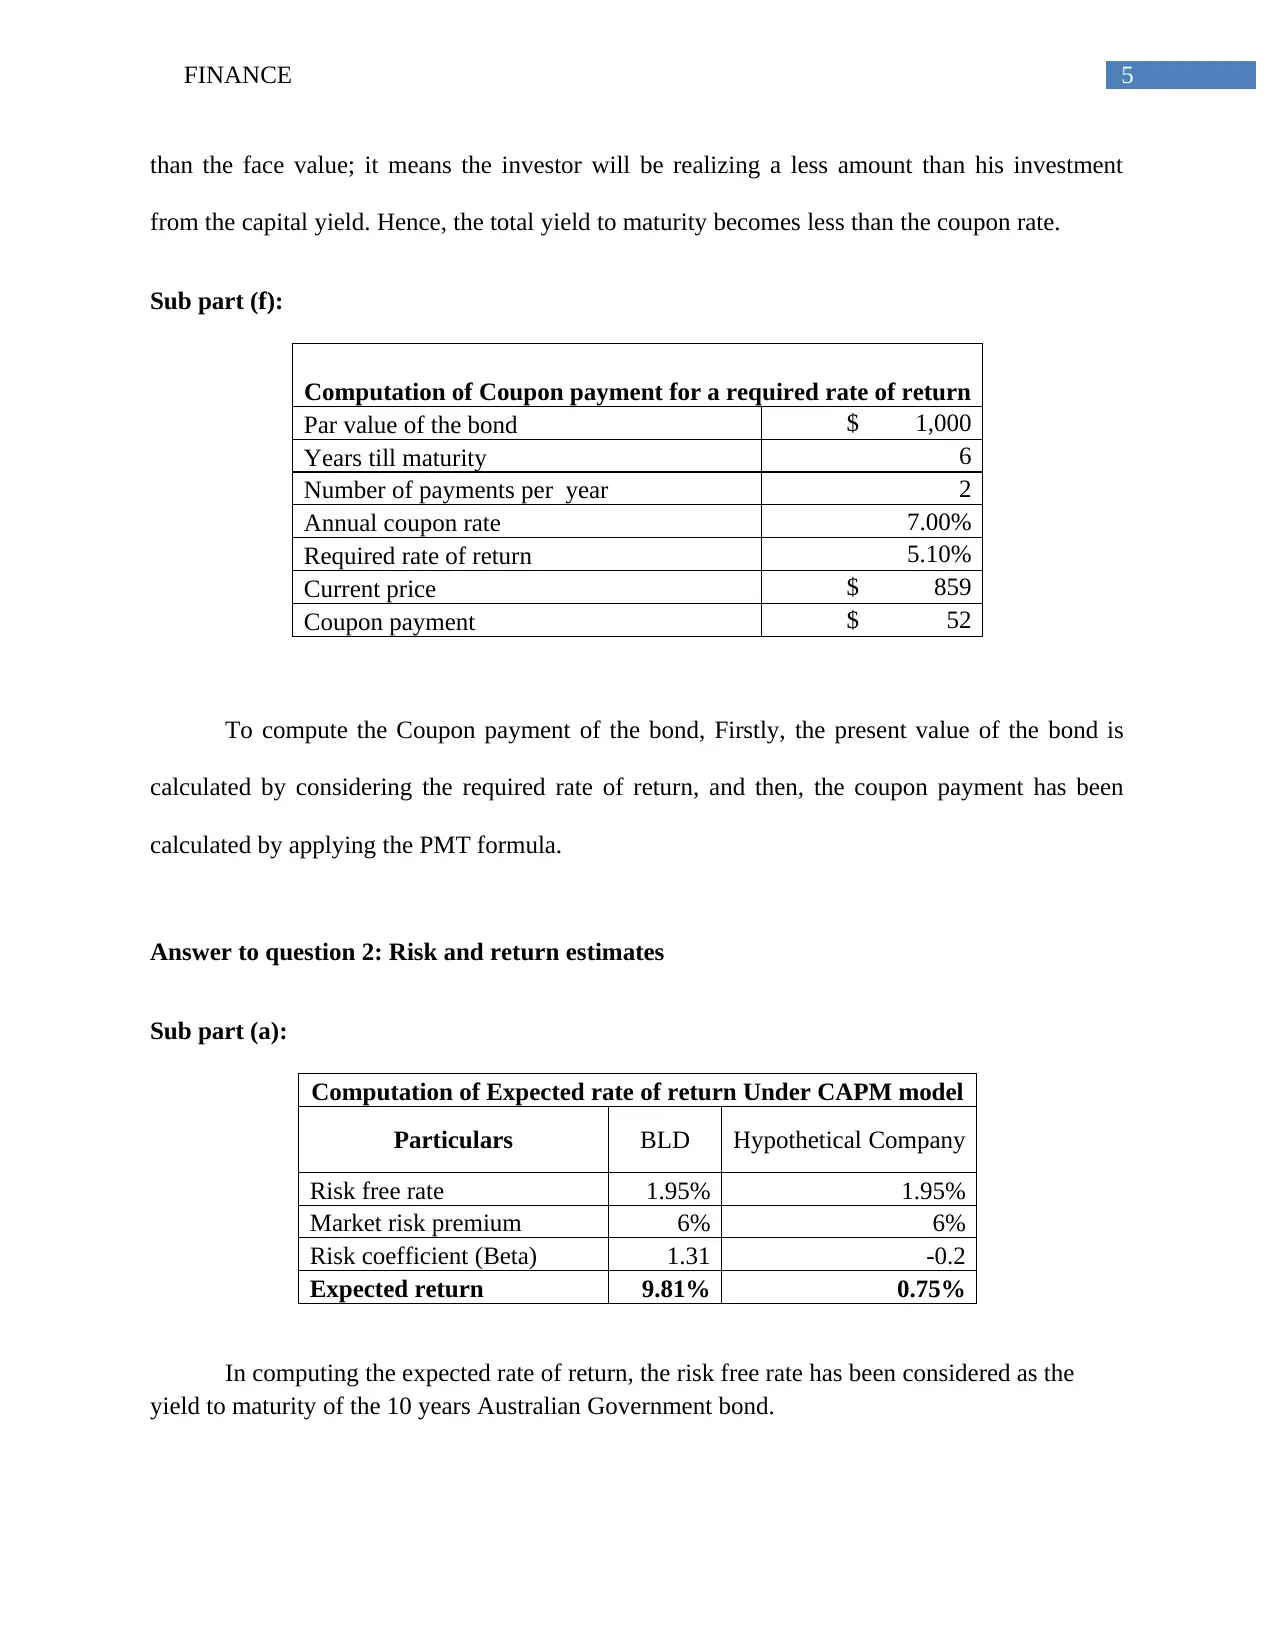
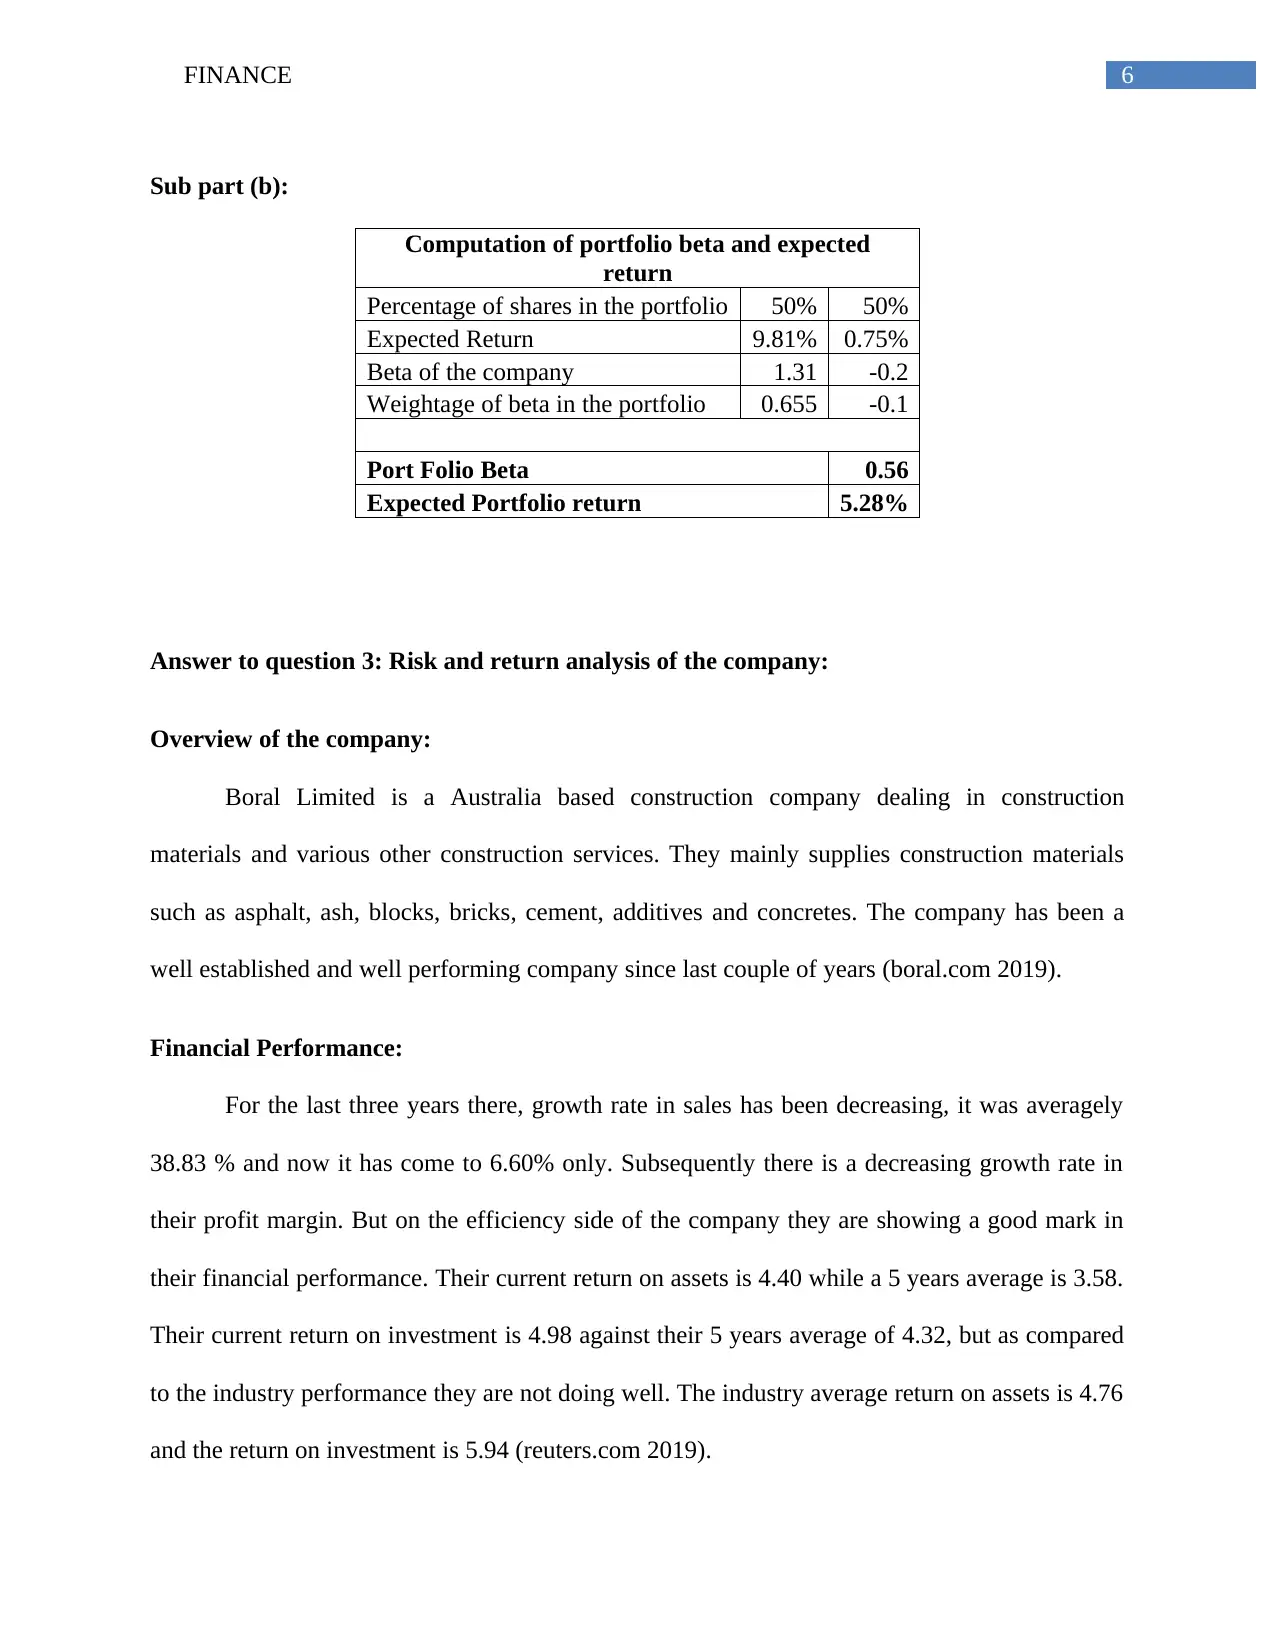
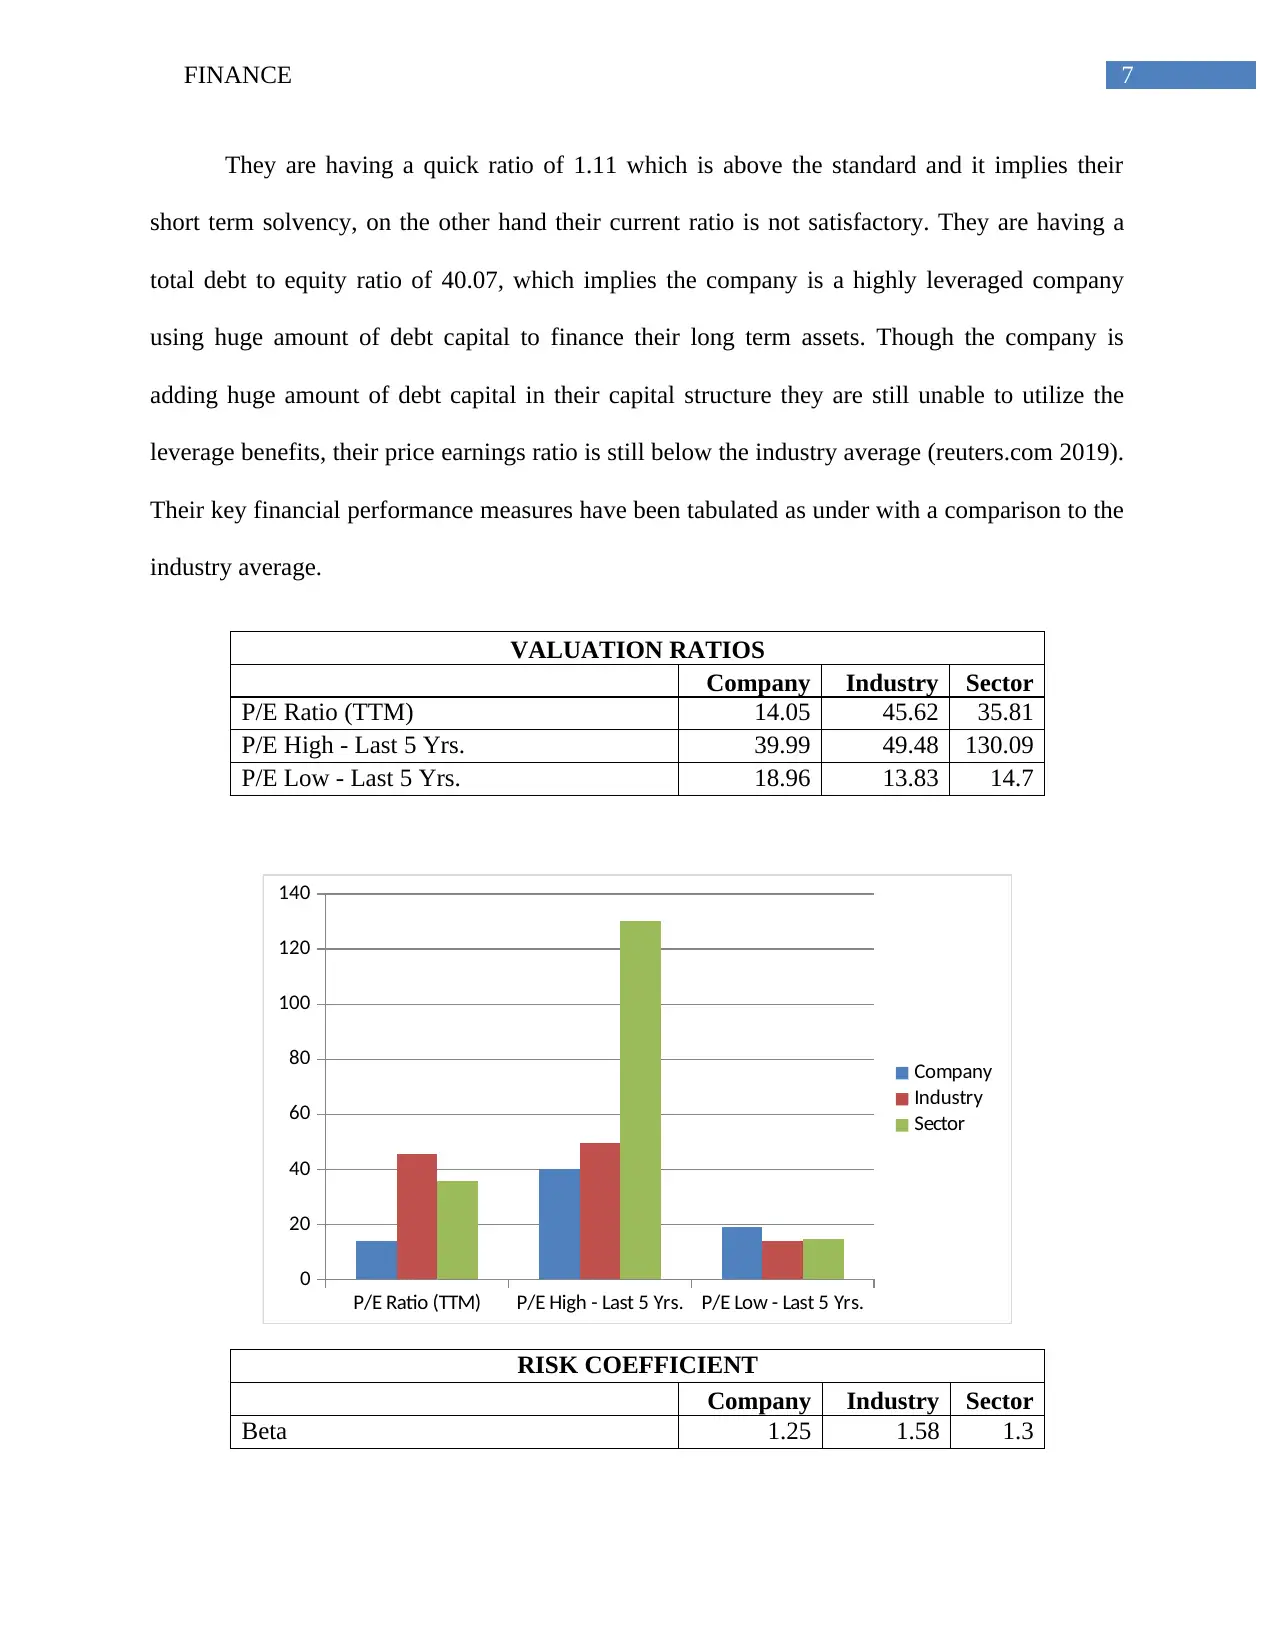
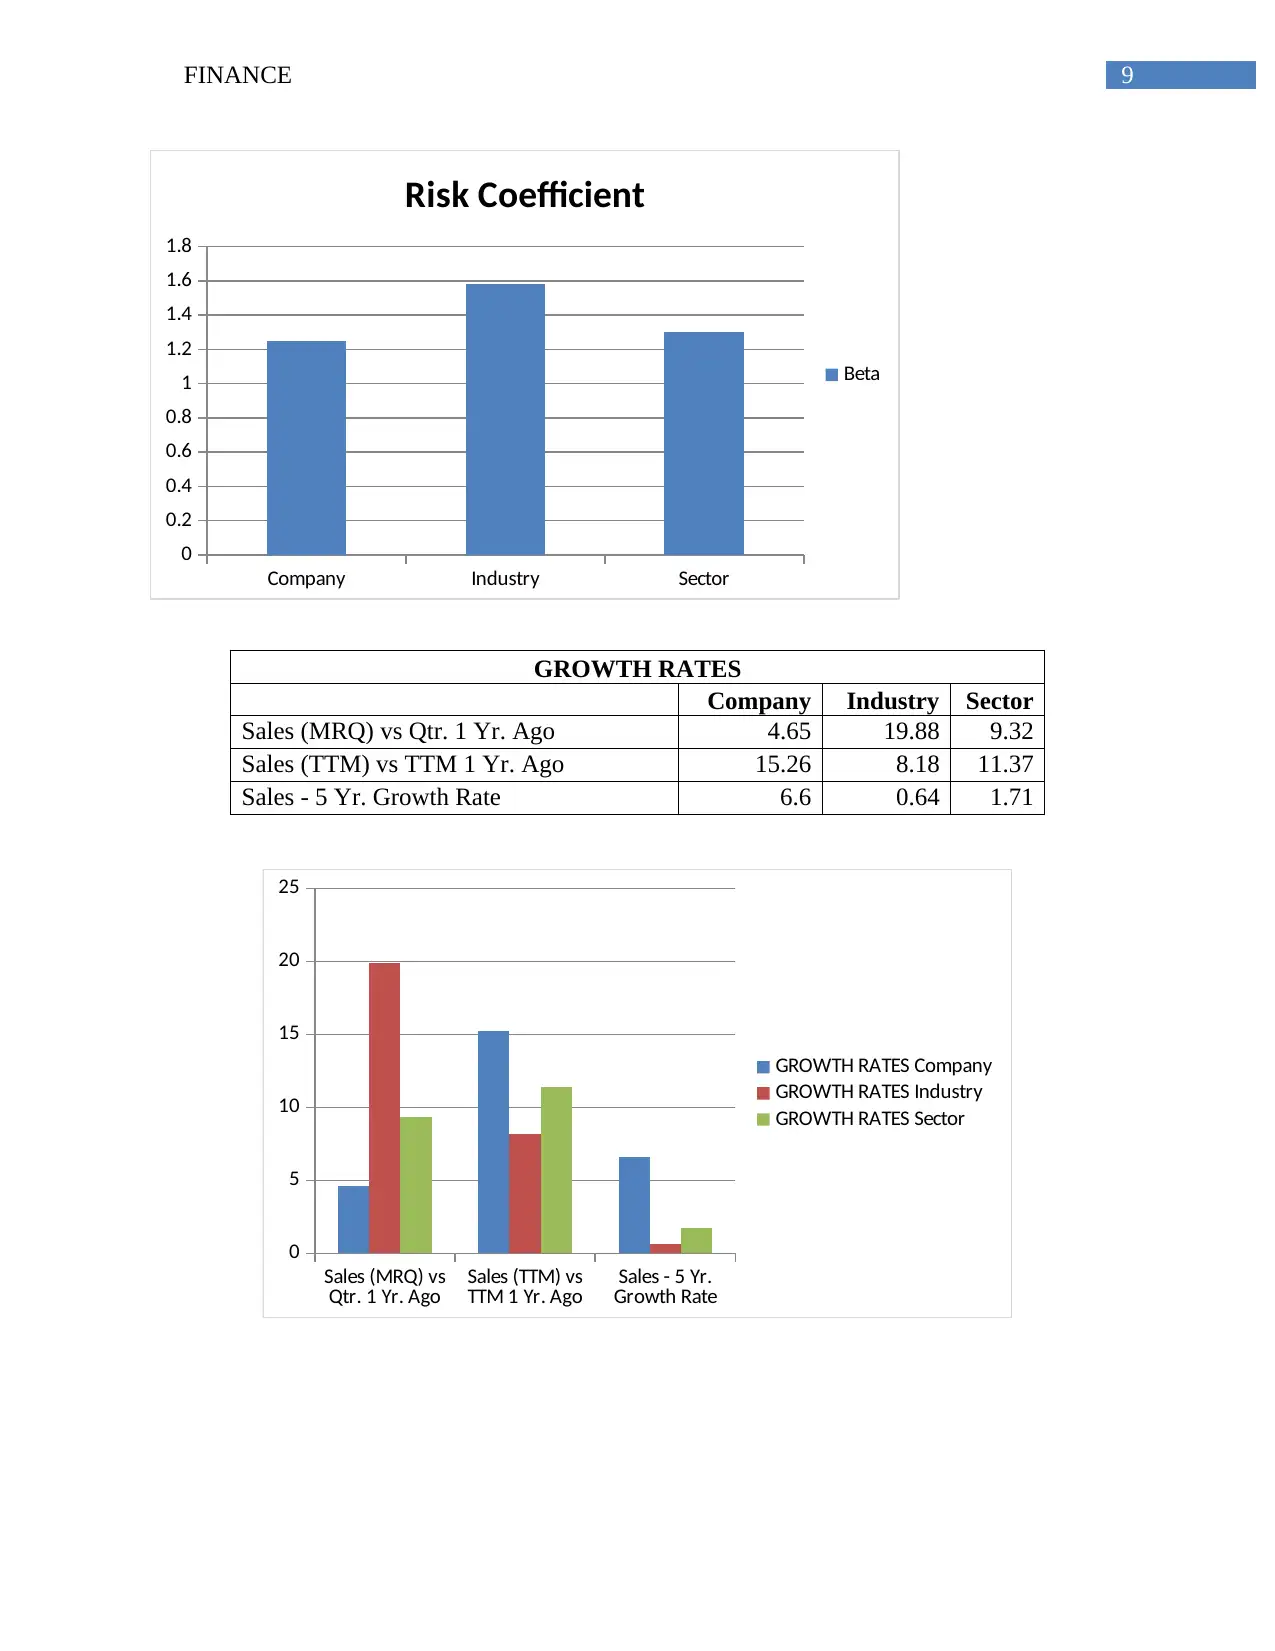
This finance assignment, completed for ACC00716, assesses the student's understanding of key financial concepts. The assignment is divided into three parts. Part 1 focuses on time value of money (TVM) and bond valuation, including calculations of discounted values, expected revenue, effective interest rates, installment amounts, and yield to maturity. Part 2 involves risk and return estimates, specifically using the Capital Asset Pricing Model (CAPM) to determine expected returns and portfolio beta. Part 3 provides a risk and return analysis of Boral Limited, an ASX-listed construction company. This section includes an overview of the company, its financial performance, and an evaluation of risk and return measures, leading to a conclusion and recommendations for the company's financial strategy. The assignment requires the use of S&P Capital IQ for data and analysis.
Contribute Materials
Your contribution can guide someone’s learning journey. Share your
documents today.

Running head: FINANCE
Finance
Name of the Student:
Name of the University:
Author’s note:
Finance
Name of the Student:
Name of the University:
Author’s note:
Secure Best Marks with AI Grader
Need help grading? Try our AI Grader for instant feedback on your assignments.

1FINANCE
Table of Contents
Answer to question 1: TVM and Bond valuation............................................................................2
Sub part (a):.................................................................................................................................2
Sub part (b):.................................................................................................................................2
Sub part (c):.................................................................................................................................2
Sub part (d):.................................................................................................................................3
Sub part (e):.................................................................................................................................3
Sub part (f):..................................................................................................................................4
Answer to question 2: Risk and return estimates.............................................................................4
Sub part (a):.................................................................................................................................4
Sub part (b):.................................................................................................................................5
Answer to question 3: Risk and return analysis of the company:....................................................5
Overview of the company:...........................................................................................................5
Financial Performance:................................................................................................................5
Risk and Return measures of the company:..............................................................................10
Conclusion and recommendation:.............................................................................................10
References and bibliography:........................................................................................................11

2FINANCE

3FINANCE
Answer to question 1: TVM and Bond valuation
Sub part (a):
Computation of Discounted value of the instalments
Monthly Instalment Amount $ 29,100
Number of years 4
Number of Payment per year 12
Annual Discount rate 7%
Discounted Value of the instalment $ 12,15,222
To compute the discounted value of the installments, a discount rate of 7% has been
considered and a total number of 7 years have been taken. The present value of the installments
is to be the discounted value of the installment, which the bank will give to the company.
Sub part (b):
Computation of Expected Revenue in 5 years with a 6.6% growth rate
Annual Operating Revenue $ 57,31,100
Annual growth rate 6.60%
Number of Years 5
Expected annual revenue in 5 years $ 78,89,037
The Annual sales are compounded with the annual growth rate to arrive at the expected
sales at the fifth year.
Sub part (c):
Computation of Effective Annual Interest Rates for the following loans
Loan A Loan B Loan C
Loan Amount 4.93% 5% 4.91%
Compounding terms Monthly Semi-annually Daily
Compounding period in a year 12 2 365
Secure Best Marks with AI Grader
Need help grading? Try our AI Grader for instant feedback on your assignments.

4FINANCE
Effective annual interest rate (EAR) 5.04% 5.06% 5.03%
In computing the effective interest rate of the loan option C, 365 days in a year has been
considered. It can be observed from the above table that, the effective interests for all the three
loan options are more or less same.
Sub part (d):
Computation of Instalment amount for the purchase of
property
Value of the property $ 5,74,000
Annual Interest rate 3.80%
Number of years 10
Number of payments per year 4
Quarterly Instalment Amount $ 17,316
To compute the amount of installment per quarter, the annual interest rate is converted
into quarterly interest rate by dividing the annual interest rate by four. Then, considering the
present value of the loan as the full value of the property the installment amount can be
computed by the compounding techniques as $17,316 per quarter.
Sub part (e):
Computation of Yield to maturity of the
bond
Par value of the bond 100
Years till maturity 8
Annual coupon rate 7.05%
Current price 109.5
Yield to maturity 5.55%
Yield to maturity means the total return as a percentage of the investment, which can be
earned by holding the investment till the maturity. The present value of the investment is more

5FINANCE
than the face value; it means the investor will be realizing a less amount than his investment
from the capital yield. Hence, the total yield to maturity becomes less than the coupon rate.
Sub part (f):
Computation of Coupon payment for a required rate of return
Par value of the bond $ 1,000
Years till maturity 6
Number of payments per year 2
Annual coupon rate 7.00%
Required rate of return 5.10%
Current price $ 859
Coupon payment $ 52
To compute the Coupon payment of the bond, Firstly, the present value of the bond is
calculated by considering the required rate of return, and then, the coupon payment has been
calculated by applying the PMT formula.
Answer to question 2: Risk and return estimates
Sub part (a):
Computation of Expected rate of return Under CAPM model
Particulars BLD Hypothetical Company
Risk free rate 1.95% 1.95%
Market risk premium 6% 6%
Risk coefficient (Beta) 1.31 -0.2
Expected return 9.81% 0.75%
In computing the expected rate of return, the risk free rate has been considered as the
yield to maturity of the 10 years Australian Government bond.

6FINANCE
Sub part (b):
Computation of portfolio beta and expected
return
Percentage of shares in the portfolio 50% 50%
Expected Return 9.81% 0.75%
Beta of the company 1.31 -0.2
Weightage of beta in the portfolio 0.655 -0.1
Port Folio Beta 0.56
Expected Portfolio return 5.28%
Answer to question 3: Risk and return analysis of the company:
Overview of the company:
Boral Limited is a Australia based construction company dealing in construction
materials and various other construction services. They mainly supplies construction materials
such as asphalt, ash, blocks, bricks, cement, additives and concretes. The company has been a
well established and well performing company since last couple of years (boral.com 2019).
Financial Performance:
For the last three years there, growth rate in sales has been decreasing, it was averagely
38.83 % and now it has come to 6.60% only. Subsequently there is a decreasing growth rate in
their profit margin. But on the efficiency side of the company they are showing a good mark in
their financial performance. Their current return on assets is 4.40 while a 5 years average is 3.58.
Their current return on investment is 4.98 against their 5 years average of 4.32, but as compared
to the industry performance they are not doing well. The industry average return on assets is 4.76
and the return on investment is 5.94 (reuters.com 2019).
Paraphrase This Document
Need a fresh take? Get an instant paraphrase of this document with our AI Paraphraser

7FINANCE
They are having a quick ratio of 1.11 which is above the standard and it implies their
short term solvency, on the other hand their current ratio is not satisfactory. They are having a
total debt to equity ratio of 40.07, which implies the company is a highly leveraged company
using huge amount of debt capital to finance their long term assets. Though the company is
adding huge amount of debt capital in their capital structure they are still unable to utilize the
leverage benefits, their price earnings ratio is still below the industry average (reuters.com 2019).
Their key financial performance measures have been tabulated as under with a comparison to the
industry average.
VALUATION RATIOS
Company Industry Sector
P/E Ratio (TTM) 14.05 45.62 35.81
P/E High - Last 5 Yrs. 39.99 49.48 130.09
P/E Low - Last 5 Yrs. 18.96 13.83 14.7
P/E Ratio (TTM) P/E High - Last 5 Yrs. P/E Low - Last 5 Yrs.
0
20
40
60
80
100
120
140
Company
Industry
Sector
RISK COEFFICIENT
Company Industry Sector
Beta 1.25 1.58 1.3

8FINANCE

9FINANCE
Company Industry Sector
0
0.2
0.4
0.6
0.8
1
1.2
1.4
1.6
1.8
Risk Coefficient
Beta
GROWTH RATES
Company Industry Sector
Sales (MRQ) vs Qtr. 1 Yr. Ago 4.65 19.88 9.32
Sales (TTM) vs TTM 1 Yr. Ago 15.26 8.18 11.37
Sales - 5 Yr. Growth Rate 6.6 0.64 1.71
Sales (MRQ) vs
Qtr. 1 Yr. Ago Sales (TTM) vs
TTM 1 Yr. Ago Sales - 5 Yr.
Growth Rate
0
5
10
15
20
25
GROWTH RATES Company
GROWTH RATES Industry
GROWTH RATES Sector
Company Industry Sector
0
0.2
0.4
0.6
0.8
1
1.2
1.4
1.6
1.8
Risk Coefficient
Beta
GROWTH RATES
Company Industry Sector
Sales (MRQ) vs Qtr. 1 Yr. Ago 4.65 19.88 9.32
Sales (TTM) vs TTM 1 Yr. Ago 15.26 8.18 11.37
Sales - 5 Yr. Growth Rate 6.6 0.64 1.71
Sales (MRQ) vs
Qtr. 1 Yr. Ago Sales (TTM) vs
TTM 1 Yr. Ago Sales - 5 Yr.
Growth Rate
0
5
10
15
20
25
GROWTH RATES Company
GROWTH RATES Industry
GROWTH RATES Sector
Secure Best Marks with AI Grader
Need help grading? Try our AI Grader for instant feedback on your assignments.

10FINANCE
FINANCIAL STRENGTH
Company Industry Sector
Quick Ratio (MRQ) 1.11 1.97 1.78
Current Ratio (MRQ) 1.84 2.4 2.25
LT Debt to Equity (MRQ) 39.74 13.35 28.43
Total Debt to Equity (MRQ) 40.07 21.12 38.39
Interest Coverage (TTM) -- 3.23 8.24
Quick Ratio
(MRQ) Current
Ratio (MRQ) LT Debt to
Equity
(MRQ)
Total Debt to
Equity
(MRQ)
0
5
10
15
20
25
30
35
40
45
FINANCIAL STRENGTH
Company
FINANCIAL STRENGTH
Industry
FINANCIAL STRENGTH
Sector
PROFITABILITY RATIOS
Company Industry Sector
Gross Margin (TTM) 33.65 29.66 23.58
Gross Margin - 5 Yr. Avg. 31.15 36.88 25.91
EBITD - 5 Yr. Avg 13.07 25.32 20.45
Operating Margin (TTM) 10.41 11.11 10.18
Operating Margin - 5 Yr. Avg. 7.97 19.06 13.7
Pre-Tax Margin (TTM) 8.61 10.6 9.67
Pre-Tax Margin - 5 Yr. Avg. 6.36 19.75 13.54
Net Profit Margin (TTM) 7.13 8.14 6.86
Net Profit Margin - 5 Yr. Avg. 5.52 15.83 10.33
Effective Tax Rate (TTM) 17.28 20.74 25.38
Effective Tax Rate - 5 Yr. Avg. 13.24 18.84 23.77
FINANCIAL STRENGTH
Company Industry Sector
Quick Ratio (MRQ) 1.11 1.97 1.78
Current Ratio (MRQ) 1.84 2.4 2.25
LT Debt to Equity (MRQ) 39.74 13.35 28.43
Total Debt to Equity (MRQ) 40.07 21.12 38.39
Interest Coverage (TTM) -- 3.23 8.24
Quick Ratio
(MRQ) Current
Ratio (MRQ) LT Debt to
Equity
(MRQ)
Total Debt to
Equity
(MRQ)
0
5
10
15
20
25
30
35
40
45
FINANCIAL STRENGTH
Company
FINANCIAL STRENGTH
Industry
FINANCIAL STRENGTH
Sector
PROFITABILITY RATIOS
Company Industry Sector
Gross Margin (TTM) 33.65 29.66 23.58
Gross Margin - 5 Yr. Avg. 31.15 36.88 25.91
EBITD - 5 Yr. Avg 13.07 25.32 20.45
Operating Margin (TTM) 10.41 11.11 10.18
Operating Margin - 5 Yr. Avg. 7.97 19.06 13.7
Pre-Tax Margin (TTM) 8.61 10.6 9.67
Pre-Tax Margin - 5 Yr. Avg. 6.36 19.75 13.54
Net Profit Margin (TTM) 7.13 8.14 6.86
Net Profit Margin - 5 Yr. Avg. 5.52 15.83 10.33
Effective Tax Rate (TTM) 17.28 20.74 25.38
Effective Tax Rate - 5 Yr. Avg. 13.24 18.84 23.77

11FINANCE
Gross Margin (TTM)
Gross Margin - 5 Yr. Avg.
EBITD - 5 Yr. Avg
Operating Margin (TTM)
Operating Margin - 5 Yr. Avg.
Pre-Tax Margin (TTM)
Pre-Tax Margin - 5 Yr. Avg.
Net Profit Margin (TTM)
Net Profit Margin - 5 Yr. Avg.
Effective Tax Rate (TTM)
Effective Tax Rate - 5 Yr. Avg.
0
5
10
15
20
25
30
35
40
PROFITABILITY RATIOS
Company
PROFITABILITY RATIOS
Industry
PROFITABILITY RATIOS
Sector
EFFICIENCY
Compan
y Industry Sector
Revenue/Employee (TTM) 4,80,997 2,90,13,05,72
7
6,02,89,13,95
3
Net Income/Employee (TTM) 34,275 22,99,22,990 44,14,05,133
Receivable Turnover (TTM) 7.11 5.98 8.67
Inventory Turnover (TTM) 6.11 6.04 6.43
Asset Turnover (TTM) 0.62 0.57 0.64
MANAGEMENT EFFECTIVENESS
Company Industry Sector
Return on Assets (TTM) 4.4 4.76 3.66
Return on Assets - 5 Yr. Avg. 3.58 9.8 7.03
Return on Investment (TTM) 4.98 5.73 5.94
Return on Investment - 5 Yr. Avg. 4.32 11.63 8.77
Return on Equity (TTM) 7.17 6.87 7.72
Return on Equity - 5 Yr. Avg. 6.07 13.13 10.93

12FINANCE
Return on Assets (TTM)
Return on Assets - 5 Yr. Avg.
Return on Investment (TTM)
Return on Investment - 5 Yr. Avg.
Return on Equity (TTM)
Return on Equity - 5 Yr. Avg.
0
2
4
6
8
10
12
14
MANAGEMENT
EFFECTIVENESS Company
MANAGEMENT
EFFECTIVENESS Industry
MANAGEMENT
EFFECTIVENESS Sector
Risk and Return measures of the company:
Their shares are currently quoting at 4.87AUD and having a slight growth in the price
(reuters.com 2019). As can be observed from the above tables and analysis that, the company is
having huge amount of debt financing for their company which might have resulted in a
maximum return to the shareholders, but it can be observed that despite having a significant risk
coefficient, their expected return is not so satisfactory. Their performance in most of the
parameter is below the industry standards. The industry average risk is higher than the company
risk coefficient, but still at that level of risk their expected rate of return is much higher than their
actual rate of return.
Conclusion and recommendation:
From the above analysis and discussion it can be concluded, that the company is
assuming a lower risk burden, which resulted into a lower return than the industry average and it
is recommended that, to improve their actual profitability and return, they need to assume more
risk and manage the debt fund more efficiently.
Paraphrase This Document
Need a fresh take? Get an instant paraphrase of this document with our AI Paraphraser

13FINANCE
References and bibliography:
Barr, M.J. and McClellan, G.S., 2018. Budgets and financial management in higher education.
John Wiley & Sons.
boral.com (2019). Shareholder Information. [online] Boral. Available at:
https://www.boral.com/shareholder-information [Accessed 19 Apr. 2019].
Chen, H., Cummins, J.D., Viswanathan, K.S. and Weiss, M.A., 2014. Systemic risk and the
interconnectedness between banks and insurers: An econometric analysis. Journal of Risk and
Insurance, 81(3), pp.623-652.
Dewandaru, G., Bacha, O.I., Masih, A.M.M. and Masih, R., 2015. Risk-return characteristics of
Islamic equity indices: Multi-timescales analysis. Journal of Multinational Financial
Management, 29, pp.115-138.
Finkler, S.A., Smith, D.L. and Calabrese, T.D., 2018. Financial management for public, health,
and not-for-profit organizations. CQ Press.
Hicks, J.R., 2017. From ‘Value and Capital’. In Bond Duration and Immunization (pp. 57-61).
Routledge.
Lutz, F., 2017. The theory of interest. Routledge.
Muritala, T.A., 2018. An empirical analysis of capital structure on firms’ performance in
Nigeria. IJAME.
Renz, D.O., 2016. The Jossey-Bass handbook of nonprofit leadership and management. John
Wiley & Sons.

14FINANCE
reuters.com, R. (2019). ${Instrument_CompanyName} ${Instrument_Ric} Financial Statement |
Reuters.com. [online] U.S. Available at: https://www.reuters.com/finance/stocks/income-
statement/BLD.AX [Accessed 19 Apr. 2019].
Shahzad, S.J.H., Ferrer, R., Ballester, L. and Umar, Z., 2017. Risk transmission between Islamic
and conventional stock markets: A return and volatility spillover analysis. International Review
of Financial Analysis, 52, pp.9-26.
U.S. (2019). ${Instrument_CompanyName} ${Instrument_Ric} Financials | Reuters.com.
[online] Available at: https://www.reuters.com/finance/stocks/financial-highlights/BLD.AX
[Accessed 19 Apr. 2019].
1 out of 15
Related Documents

Your All-in-One AI-Powered Toolkit for Academic Success.
+13062052269
info@desklib.com
Available 24*7 on WhatsApp / Email
Unlock your academic potential
© 2024 | Zucol Services PVT LTD | All rights reserved.