Finance Assignment: Analyzing Cash Flow and Financial Plans

Verified

Added on  2021/12/17

|6
|801
|51
Homework Assignment
AI Summary
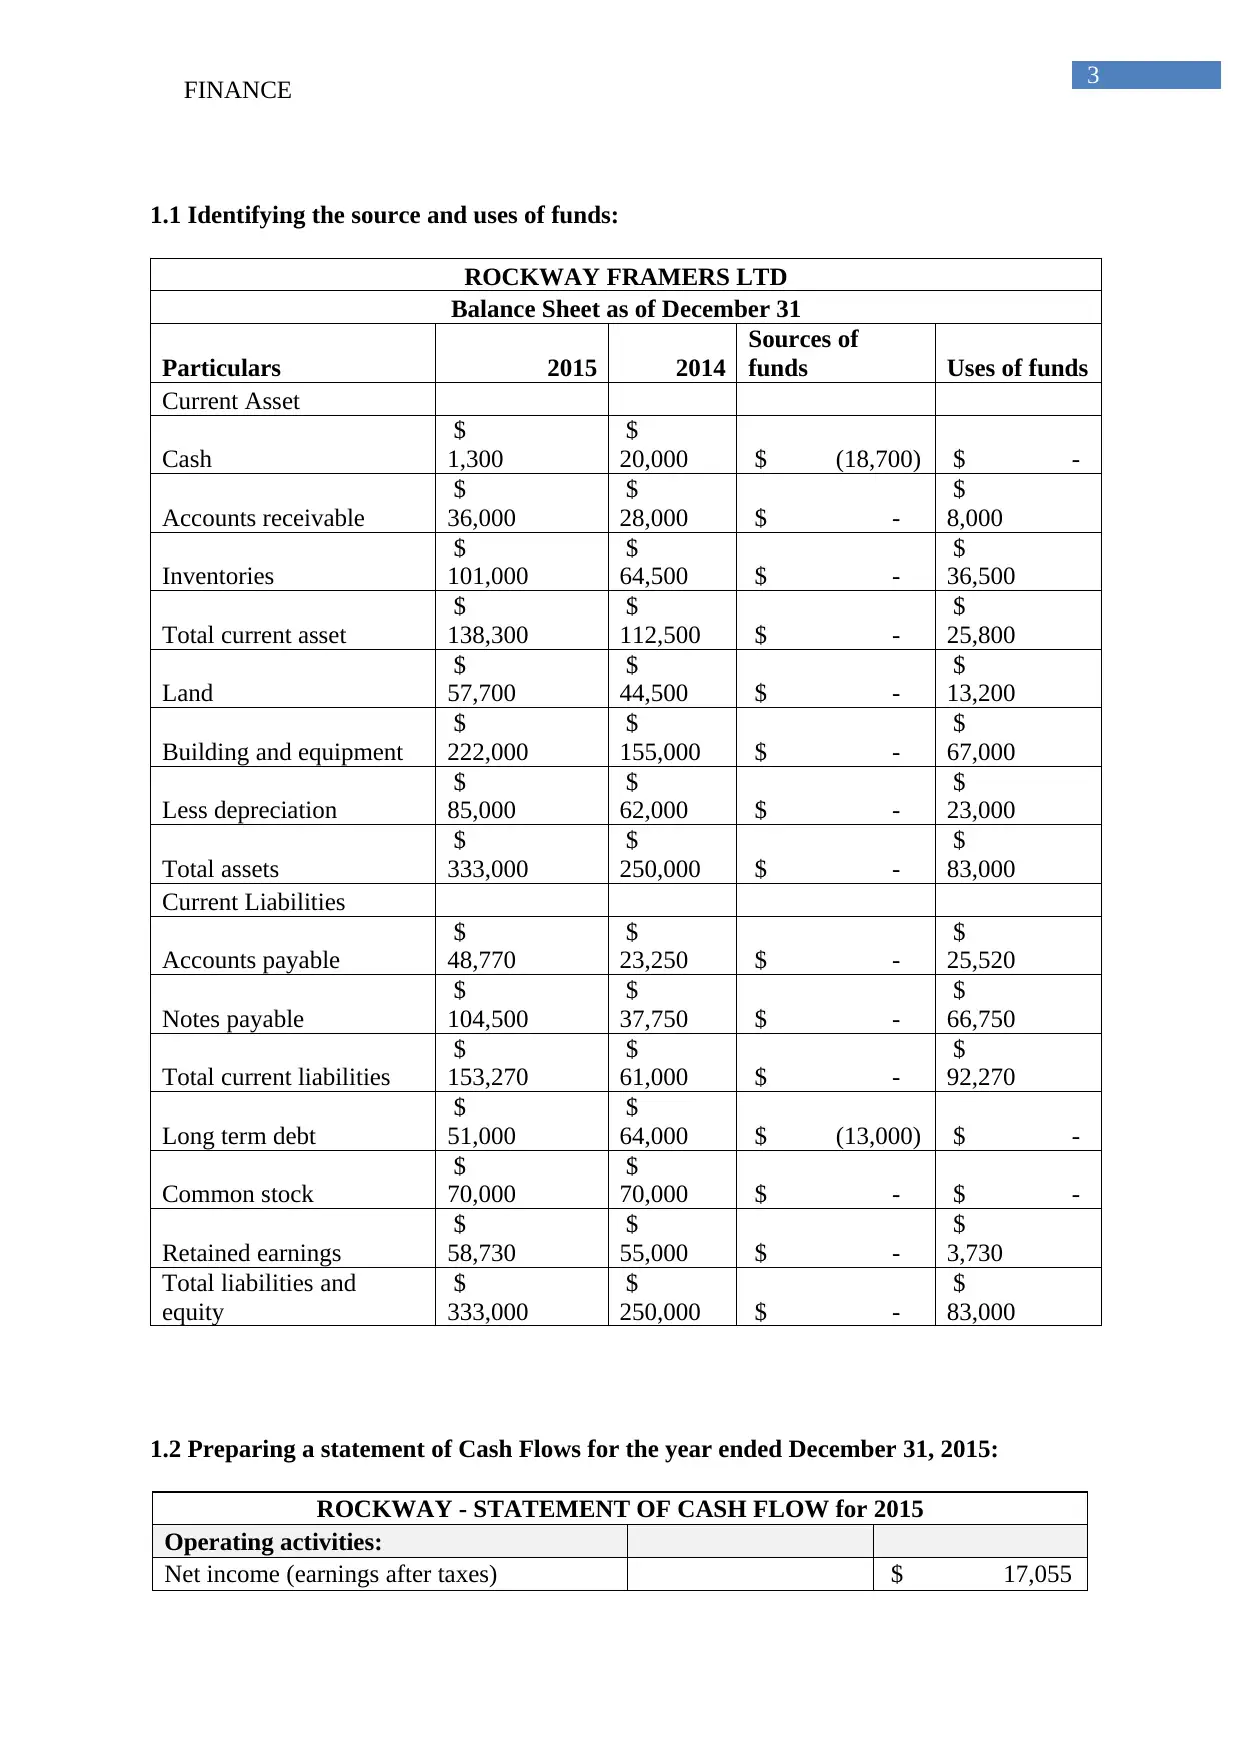
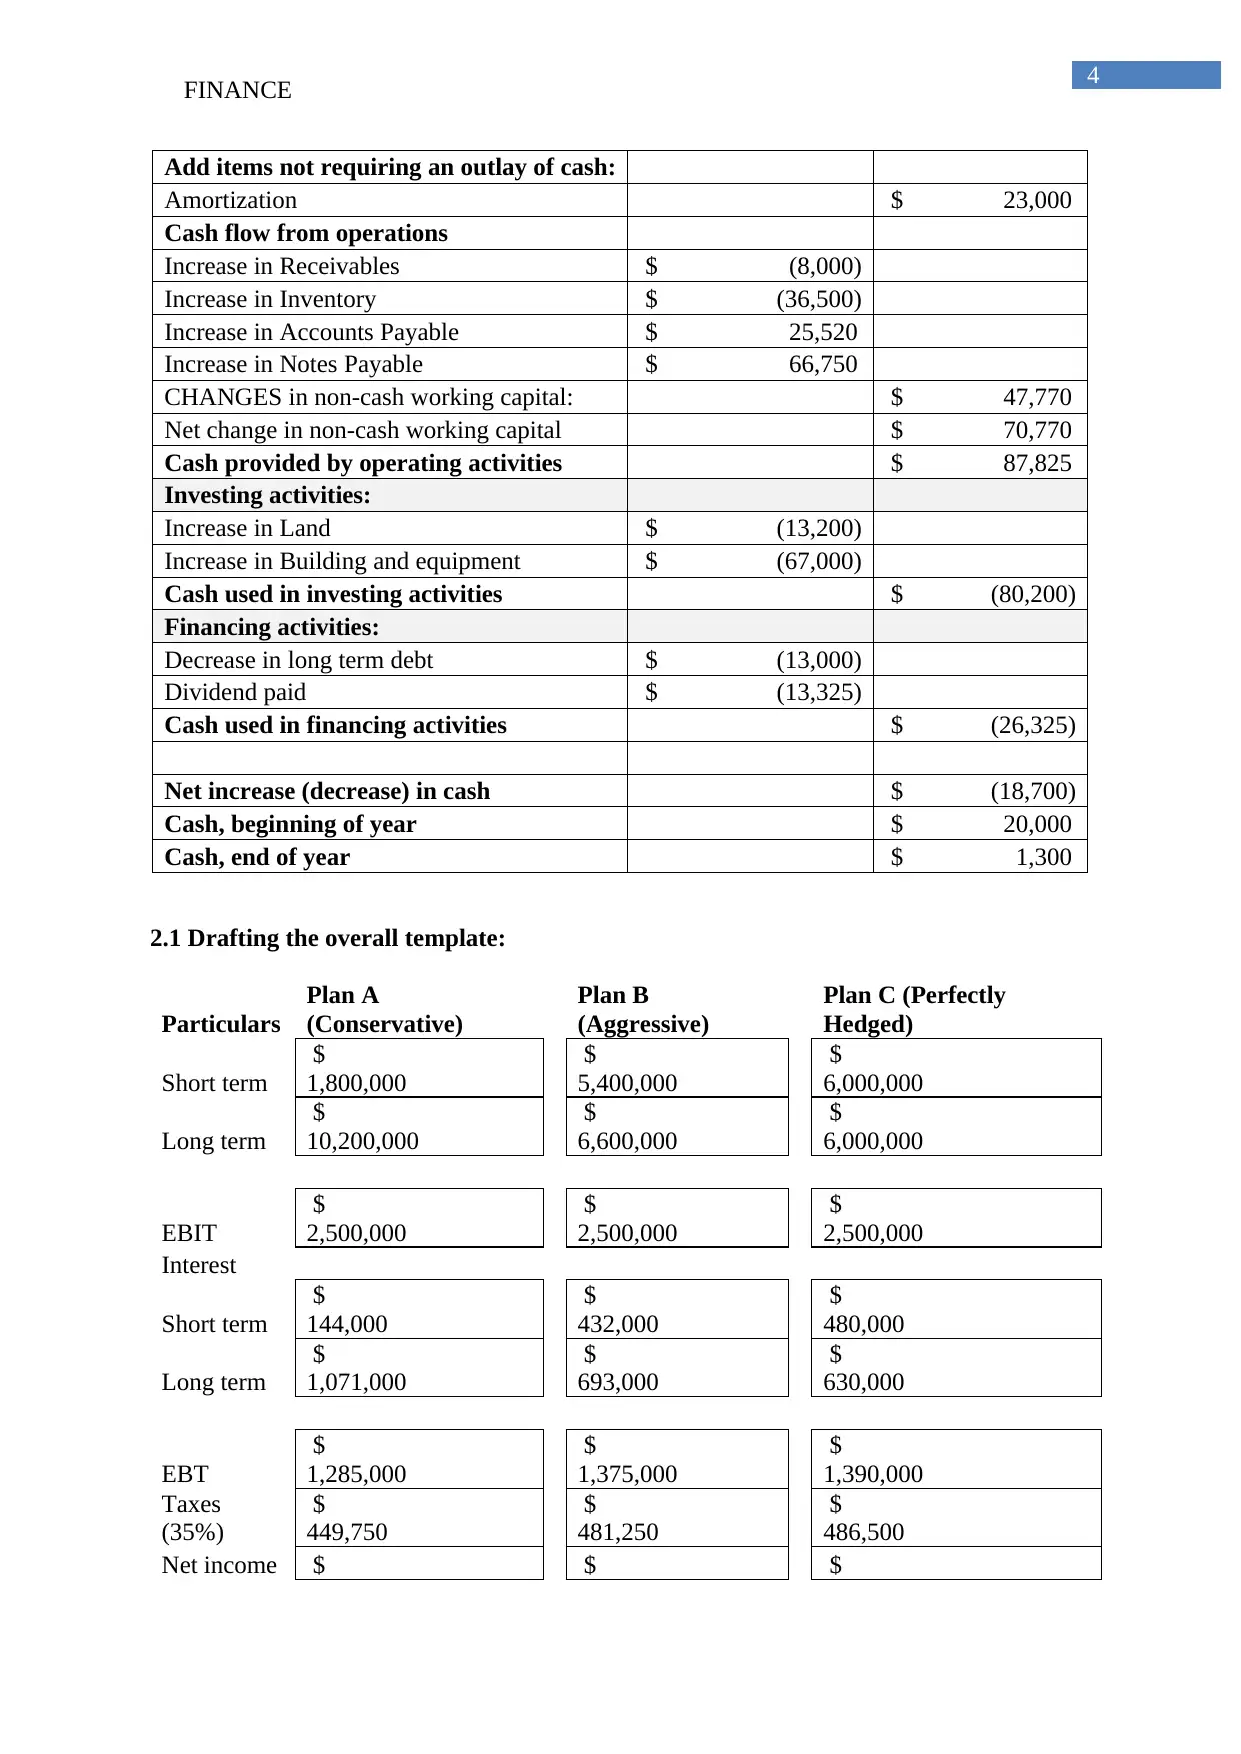
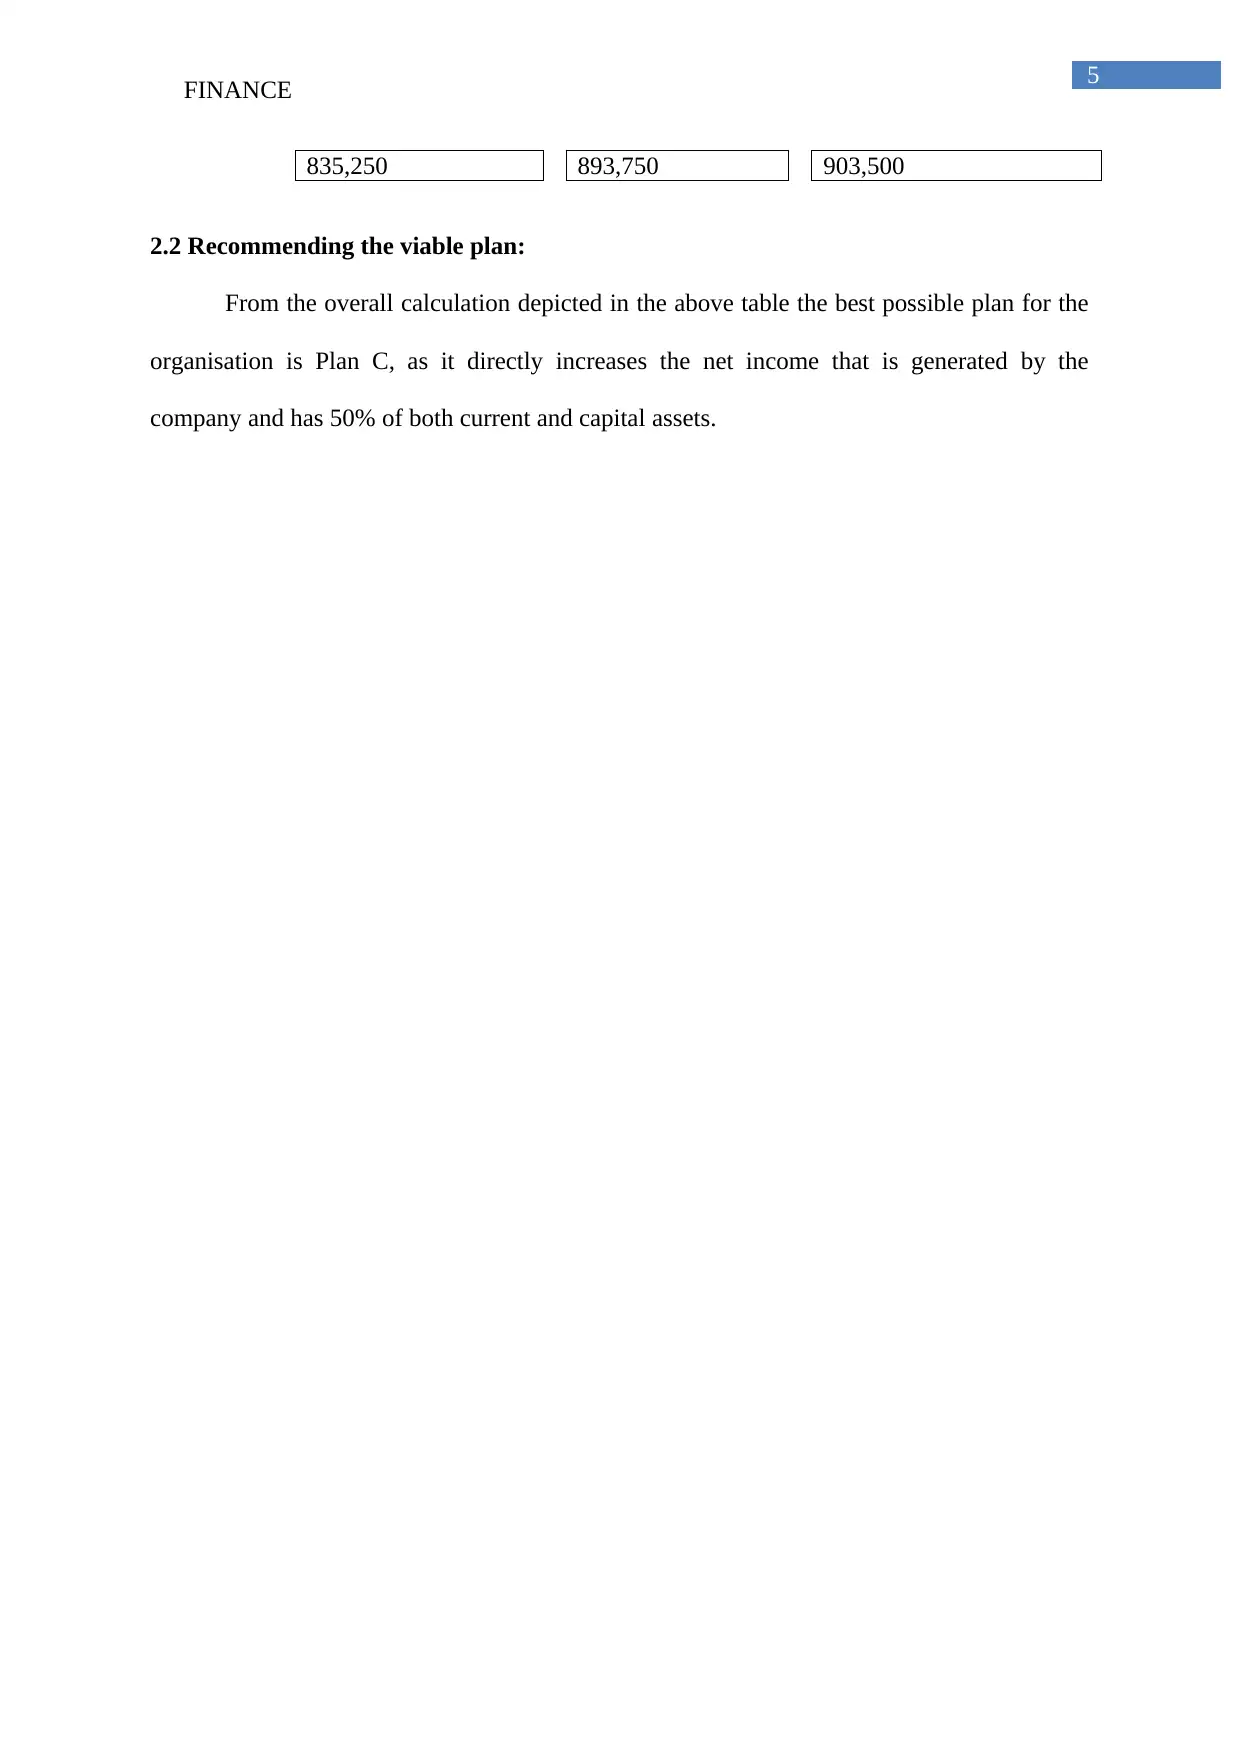
This finance assignment analyzes the cash flow of Rockway Framers Ltd for the year 2015. It begins by identifying the sources and uses of funds, followed by the preparation of a detailed statement of cash flows, including operating, investing, and financing activities. The assignment also includes a comparative analysis of different financial plans (Plan A, B, and C) with varying short-term and long-term financing structures, evaluating their impact on earnings before taxes (EBT) and net income. The solution recommends Plan C as the most viable option. The document concludes with a bibliography of relevant financial literature.
Document Page
Running head: FINANCE
Finance
Name of the Student:
Name of the University:
Authors Note:
tabler-icon-diamond-filled.svg

Paraphrase This Document

Need a fresh take? Get an instant paraphrase of this document with our AI Paraphraser
Document Page
FINANCE 2
Table of Contents
1.1 Identifying the source and uses of funds:.............................................................................3
1.2 Preparing a statement of Cash Flows for the year ended December 31, 2015:...................3
2.1 Drafting the overall template:..............................................................................................4
2.2 Recommending the viable plan:...........................................................................................5
Bibliography:..............................................................................................................................6
Document Page
FINANCE 3
1.1 Identifying the source and uses of funds:
ROCKWAY FRAMERS LTD
Balance Sheet as of December 31
Particulars 2015 2014
Sources of
funds Uses of funds
Current Asset
Cash
$
1,300
$
20,000 $ (18,700) $ -
Accounts receivable
$
36,000
$
28,000 $ -
$
8,000
Inventories
$
101,000
$
64,500 $ -
$
36,500
Total current asset
$
138,300
$
112,500 $ -
$
25,800
Land
$
57,700
$
44,500 $ -
$
13,200
Building and equipment
$
222,000
$
155,000 $ -
$
67,000
Less depreciation
$
85,000
$
62,000 $ -
$
23,000
Total assets
$
333,000
$
250,000 $ -
$
83,000
Current Liabilities
Accounts payable
$
48,770
$
23,250 $ -
$
25,520
Notes payable
$
104,500
$
37,750 $ -
$
66,750
Total current liabilities
$
153,270
$
61,000 $ -
$
92,270
Long term debt
$
51,000
$
64,000 $ (13,000) $ -
Common stock
$
70,000
$
70,000 $ - $ -
Retained earnings
$
58,730
$
55,000 $ -
$
3,730
Total liabilities and
equity
$
333,000
$
250,000 $ -
$
83,000
1.2 Preparing a statement of Cash Flows for the year ended December 31, 2015:
ROCKWAY - STATEMENT OF CASH FLOW for 2015
Operating activities:
Net income (earnings after taxes) $ 17,055
Document Page
FINANCE 4
Add items not requiring an outlay of cash:
Amortization $ 23,000
Cash flow from operations
Increase in Receivables $ (8,000)
Increase in Inventory $ (36,500)
Increase in Accounts Payable $ 25,520
Increase in Notes Payable $ 66,750
CHANGES in non-cash working capital: $ 47,770
Net change in non-cash working capital $ 70,770
Cash provided by operating activities $ 87,825
Investing activities:
Increase in Land $ (13,200)
Increase in Building and equipment $ (67,000)
Cash used in investing activities $ (80,200)
Financing activities:
Decrease in long term debt $ (13,000)
Dividend paid $ (13,325)
Cash used in financing activities $ (26,325)
Net increase (decrease) in cash $ (18,700)
Cash, beginning of year $ 20,000
Cash, end of year $ 1,300
2.1 Drafting the overall template:
Particulars
Plan A
(Conservative)
Plan B
(Aggressive)
Plan C (Perfectly
Hedged)
Short term
$
1,800,000
$
5,400,000
$
6,000,000
Long term
$
10,200,000
$
6,600,000
$
6,000,000
EBIT
$
2,500,000
$
2,500,000
$
2,500,000
Interest
Short term
$
144,000
$
432,000
$
480,000
Long term
$
1,071,000
$
693,000
$
630,000
EBT
$
1,285,000
$
1,375,000
$
1,390,000
Taxes
(35%)
$
449,750
$
481,250
$
486,500
Net income $ $ $
tabler-icon-diamond-filled.svg

Paraphrase This Document

Need a fresh take? Get an instant paraphrase of this document with our AI Paraphraser
Document Page
FINANCE 5
835,250 893,750 903,500
2.2 Recommending the viable plan:
From the overall calculation depicted in the above table the best possible plan for the
organisation is Plan C, as it directly increases the net income that is generated by the
company and has 50% of both current and capital assets.
Document Page
FINANCE 6
Bibliography:
Barua, S. and Saha, A.K., 2015. Traditional Ratios vs. Cash Flow based Ratios: Which One is
Better Performance Indicator?. Advances in Economics and Business, 3(6), pp.232-251.
Davis, J.T., 2015. Cash Flow Statement Spreadsheet Modeling Case Using a Prototype
System Development Process. Journal of Learning in Higher Education, 11(1), pp.113-122.
Dumont, G. and Schmit, M., 2014. Tier-1 MFIs' Financial Performance: Cash-Flow
Statement Analysis Version 2.0 (No. 13/054). CEB Working Paper.
Gordon, E.A., Henry, E., Jorgensen, B.N. and Linthicum, C.L., 2017. Flexibility in cash-flow
classification under IFRS: determinants and consequences. Review of Accounting
Studies, 22(2), pp.839-872.
Miao, B., Teoh, S.H. and Zhu, Z., 2016. Limited attention, statement of cash flow disclosure,
and the valuation of accruals. Review of Accounting Studies, 21(2), pp.473-515.
Varshney, N. and Jain, M., 2016. Cash Flow Statement Of Bank Of Baroda And Syndicate
Bank: A Comparative Analysis Of Operating, Investing And Financing Activities (No. 2016-
09-10).
chevron_up_icon
1 out of 6
circle_padding
hide_on_mobile
zoom_out_icon
[object Object]