University Corporate Finance Report: CML, SML, CAPM Analysis
VerifiedAdded on 2023/06/08
|13
|2867
|187
Report
AI Summary
This report provides an in-depth analysis of key concepts in corporate finance. It begins by differentiating between the Capital Market Line (CML) and the Security Market Line (SML), explaining their risk and return attributes and how they are used in investment strategies. The report then delves into the significance of minimum variance portfolios, illustrating how they help investors manage risk and optimize portfolio returns. The report also explores the Capital Asset Pricing Model (CAPM), explaining why it remains a widely used method for calculating the required rate of return, despite the existence of alternative models. Through graphical representations and detailed explanations, the report provides a comprehensive overview of these essential financial tools, offering valuable insights for investors and students alike.

Running head: CORPORATE FINANCE
Corporate Finance
Name of the Student:
Name of the University:
Authors Note:
Corporate Finance
Name of the Student:
Name of the University:
Authors Note:
Paraphrase This Document
Need a fresh take? Get an instant paraphrase of this document with our AI Paraphraser

CORPORATE FINANCE
1
Table of Contents
Introduction:...............................................................................................................................2
Understanding the differences between Capital Market Line and Security Market Line:.........2
Understanding the significance of minimum variance portfolio:..............................................5
Understanding why CAPM calculation has been extensively used by investors over the years:
....................................................................................................................................................8
Conclusion:..............................................................................................................................10
References:...............................................................................................................................11
CORPORATE FINANCE
2
Standard Deviation
Expected return
Capital Market Line
Efficient Frontier
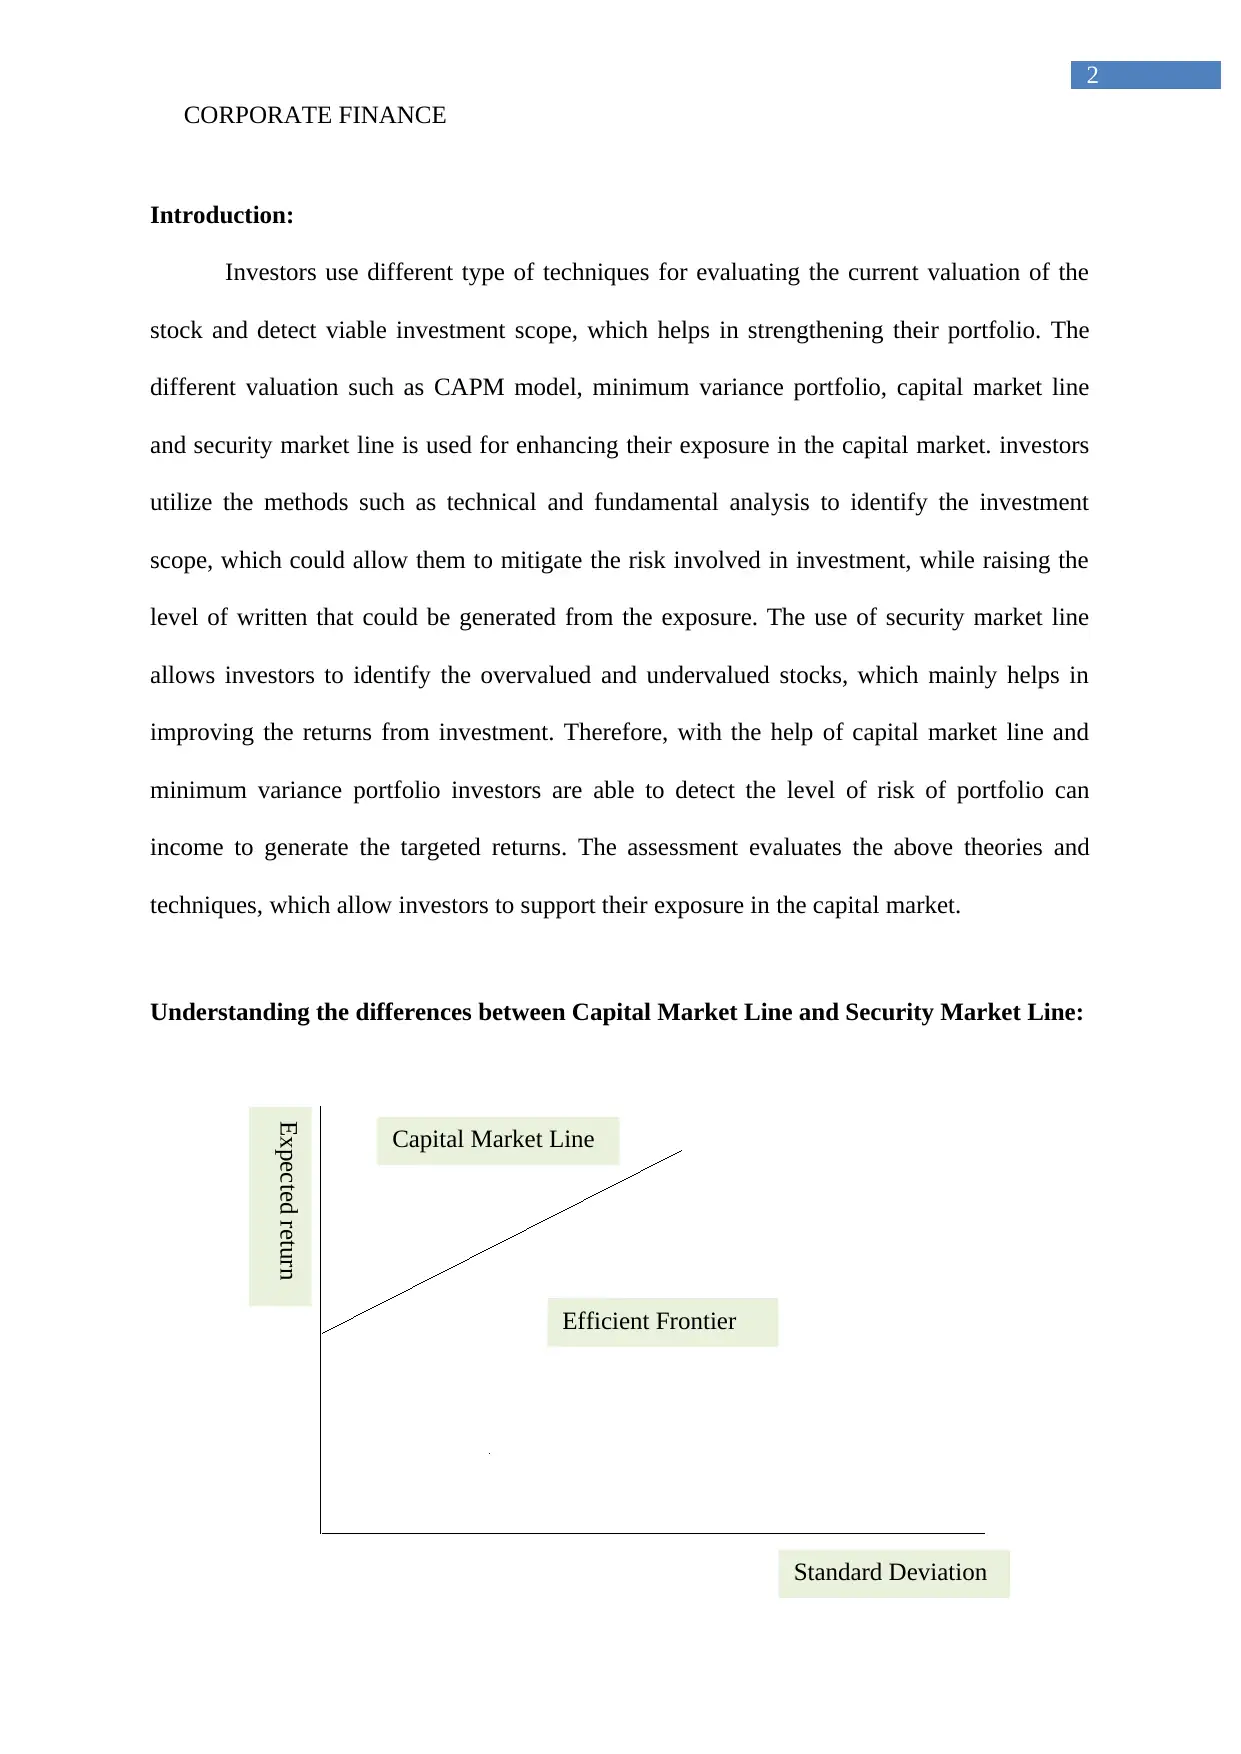
Introduction:
Investors use different type of techniques for evaluating the current valuation of the
stock and detect viable investment scope, which helps in strengthening their portfolio. The
different valuation such as CAPM model, minimum variance portfolio, capital market line
and security market line is used for enhancing their exposure in the capital market. investors
utilize the methods such as technical and fundamental analysis to identify the investment
scope, which could allow them to mitigate the risk involved in investment, while raising the
level of written that could be generated from the exposure. The use of security market line
allows investors to identify the overvalued and undervalued stocks, which mainly helps in
improving the returns from investment. Therefore, with the help of capital market line and
minimum variance portfolio investors are able to detect the level of risk of portfolio can
income to generate the targeted returns. The assessment evaluates the above theories and
techniques, which allow investors to support their exposure in the capital market.
Understanding the differences between Capital Market Line and Security Market Line:
2
Standard Deviation
Expected return
Capital Market Line
Efficient Frontier
Introduction:
Investors use different type of techniques for evaluating the current valuation of the
stock and detect viable investment scope, which helps in strengthening their portfolio. The
different valuation such as CAPM model, minimum variance portfolio, capital market line
and security market line is used for enhancing their exposure in the capital market. investors
utilize the methods such as technical and fundamental analysis to identify the investment
scope, which could allow them to mitigate the risk involved in investment, while raising the
level of written that could be generated from the exposure. The use of security market line
allows investors to identify the overvalued and undervalued stocks, which mainly helps in
improving the returns from investment. Therefore, with the help of capital market line and
minimum variance portfolio investors are able to detect the level of risk of portfolio can
income to generate the targeted returns. The assessment evaluates the above theories and
techniques, which allow investors to support their exposure in the capital market.
Understanding the differences between Capital Market Line and Security Market Line:
⊘ This is a preview!⊘
Do you want full access?
Subscribe today to unlock all pages.
Trusted by 1+ million students worldwide
CORPORATE FINANCE
3
Standard Deviation
Expected return
Under Valued Stocks
Over Valued Stocks
Figure 1: Capital Market Line Graph
(Source: Zhou, Simnett and Green 2017)
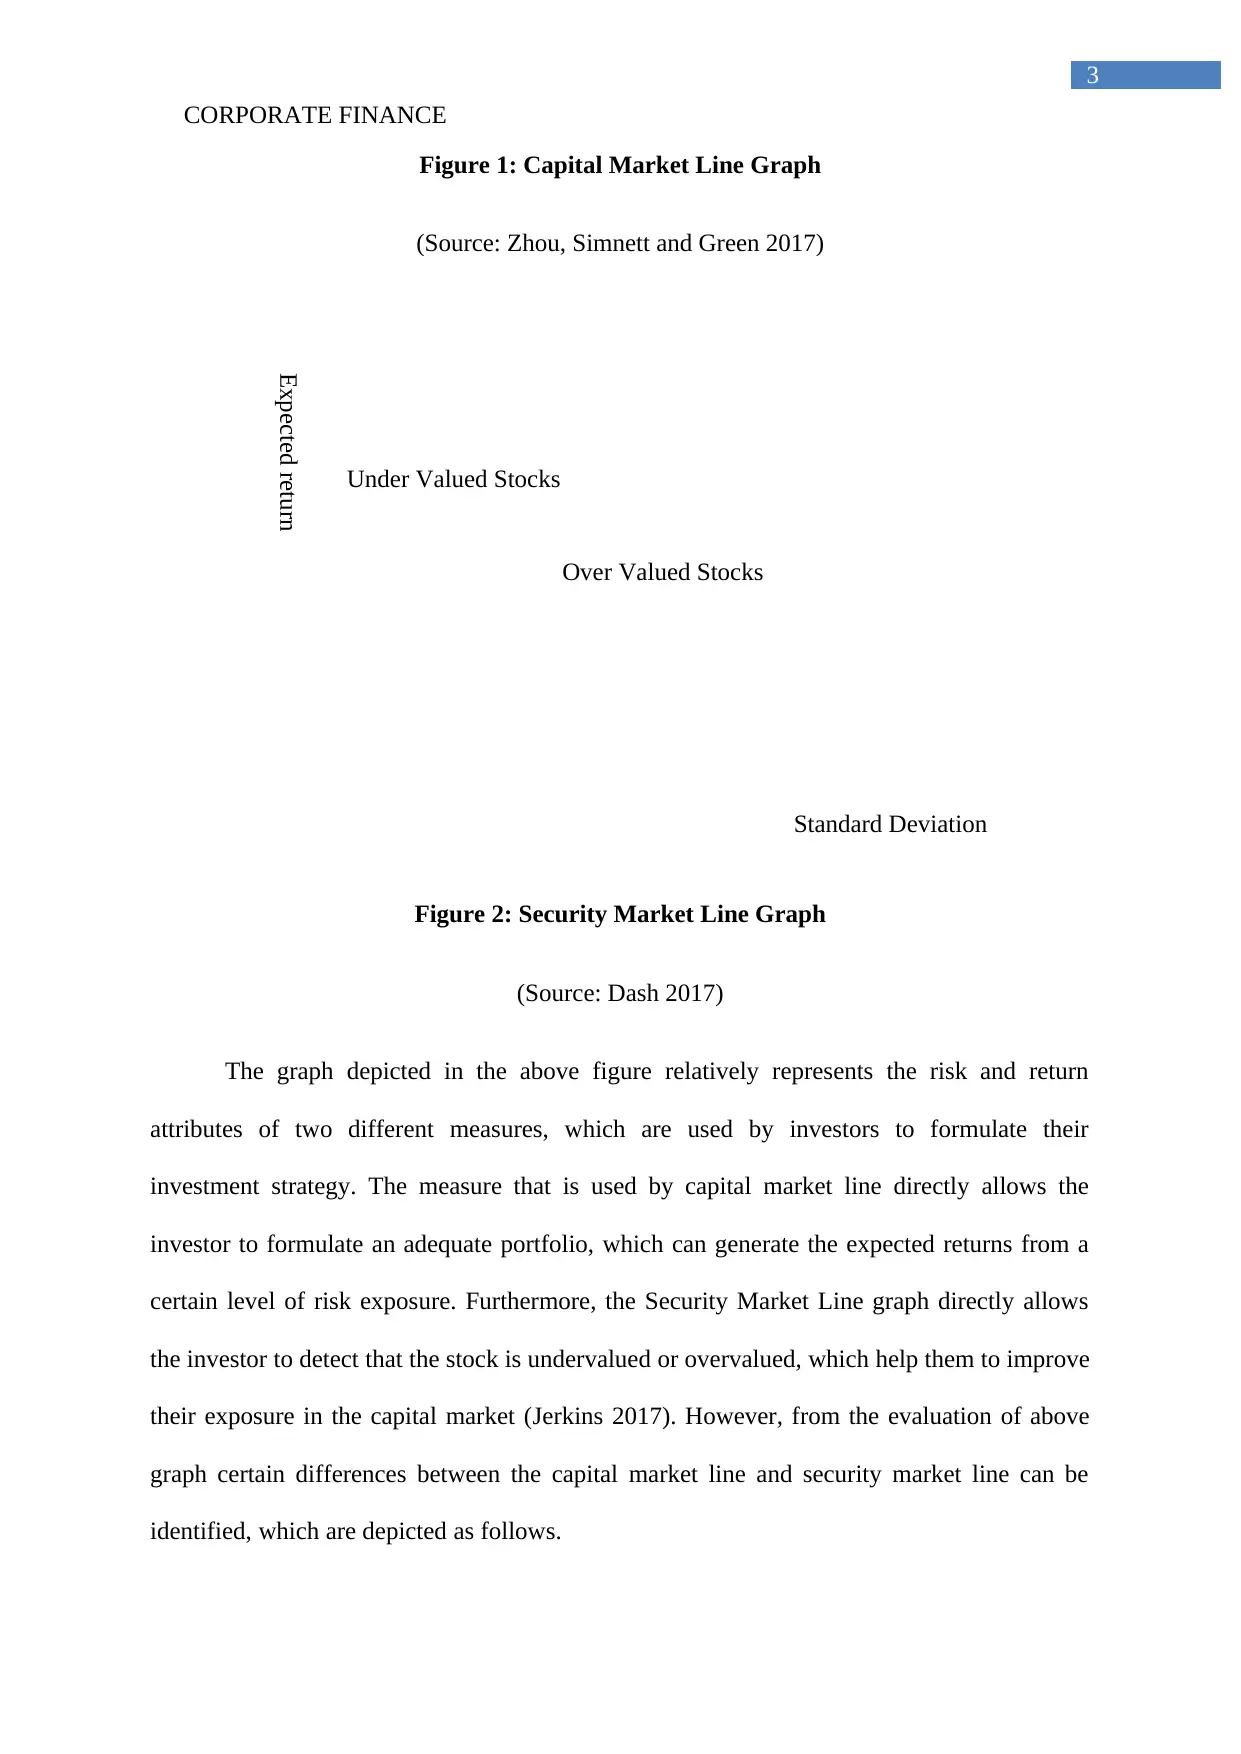
Figure 2: Security Market Line Graph
(Source: Dash 2017)
The graph depicted in the above figure relatively represents the risk and return
attributes of two different measures, which are used by investors to formulate their
investment strategy. The measure that is used by capital market line directly allows the
investor to formulate an adequate portfolio, which can generate the expected returns from a
certain level of risk exposure. Furthermore, the Security Market Line graph directly allows
the investor to detect that the stock is undervalued or overvalued, which help them to improve
their exposure in the capital market (Jerkins 2017). However, from the evaluation of above
graph certain differences between the capital market line and security market line can be
identified, which are depicted as follows.
3
Standard Deviation
Expected return
Under Valued Stocks
Over Valued Stocks
Figure 1: Capital Market Line Graph
(Source: Zhou, Simnett and Green 2017)
Figure 2: Security Market Line Graph
(Source: Dash 2017)
The graph depicted in the above figure relatively represents the risk and return
attributes of two different measures, which are used by investors to formulate their
investment strategy. The measure that is used by capital market line directly allows the
investor to formulate an adequate portfolio, which can generate the expected returns from a
certain level of risk exposure. Furthermore, the Security Market Line graph directly allows
the investor to detect that the stock is undervalued or overvalued, which help them to improve
their exposure in the capital market (Jerkins 2017). However, from the evaluation of above
graph certain differences between the capital market line and security market line can be
identified, which are depicted as follows.
Paraphrase This Document
Need a fresh take? Get an instant paraphrase of this document with our AI Paraphraser
CORPORATE FINANCE
4
The first difference that can be identified between security market line and capital market
line is the use of different risk attributes. The different genres attributes directly alters the
level of expected return, which is derived by both the techniques. therefore it could be
understood that capital market line uses standard deviation derive the risk condition of the
stock, while security market line uses beta to address the risk attributes of the investment.
The second major difference between the CML and SML is the output range, which is the
detected after the calculations, has been conducted. The capital market line directly
allows the investor to identify the range of risk and return attributes of a particular
portfolio. On the other hand, security market line directly indicates the condition of the
stock and detect whether they are undervalued or overvalued. The difference in the risk
detection attributes of body measures plays a significant role in the overall output (Means
2017).
The third major differences between the measures are the different level of evaluations
that is being conducted by SML and CML. The security market line directly used only
once talk to measure its current condition in the market. However, the Capital Market
Line uses of portfolio, which consists of several stocks to determine the risk and return,
attribute of the investment scope. This type of difference directly indicates that with the
help of security market line investors are able to understand the risk and return attribute
of a particular stock, while capital market line provides an insight on the total portfolio of
the investor. These changes would eventually allow different types of investors to
understand the significance of both the measure and its usage under changing
circumstances (Dekker 2017).
The fourth major differences between the Security market line and capital market line is
the alternating measures that are used by both the techniques in supporting the investment
scope. The security market line eventually allows the investor to understand both
CORPORATE FINANCE
5
Standard Deviation
Expected return
Efficient Frontier
Minimum Variance Portfolio
Systematic and unsystematic risk associated with an investment. On the other hand, the
capital market line directly depicts the level of systematic risk, which is involved in the
particular portfolio (Arrow 2017).
Investors by using the capital market line are able to create an adequate portfolio eating
their investment and risk requirement. On the other hand, the security market line only
portrays the current position of a particular stock and depicts whether it is overvalued or
undervalued. therefore, the investment scopes is also a difference between the capital
market line and security market line, as investors altering investment scope uses different
measures for controlling their exposure in the capital market (O'connor 2017).
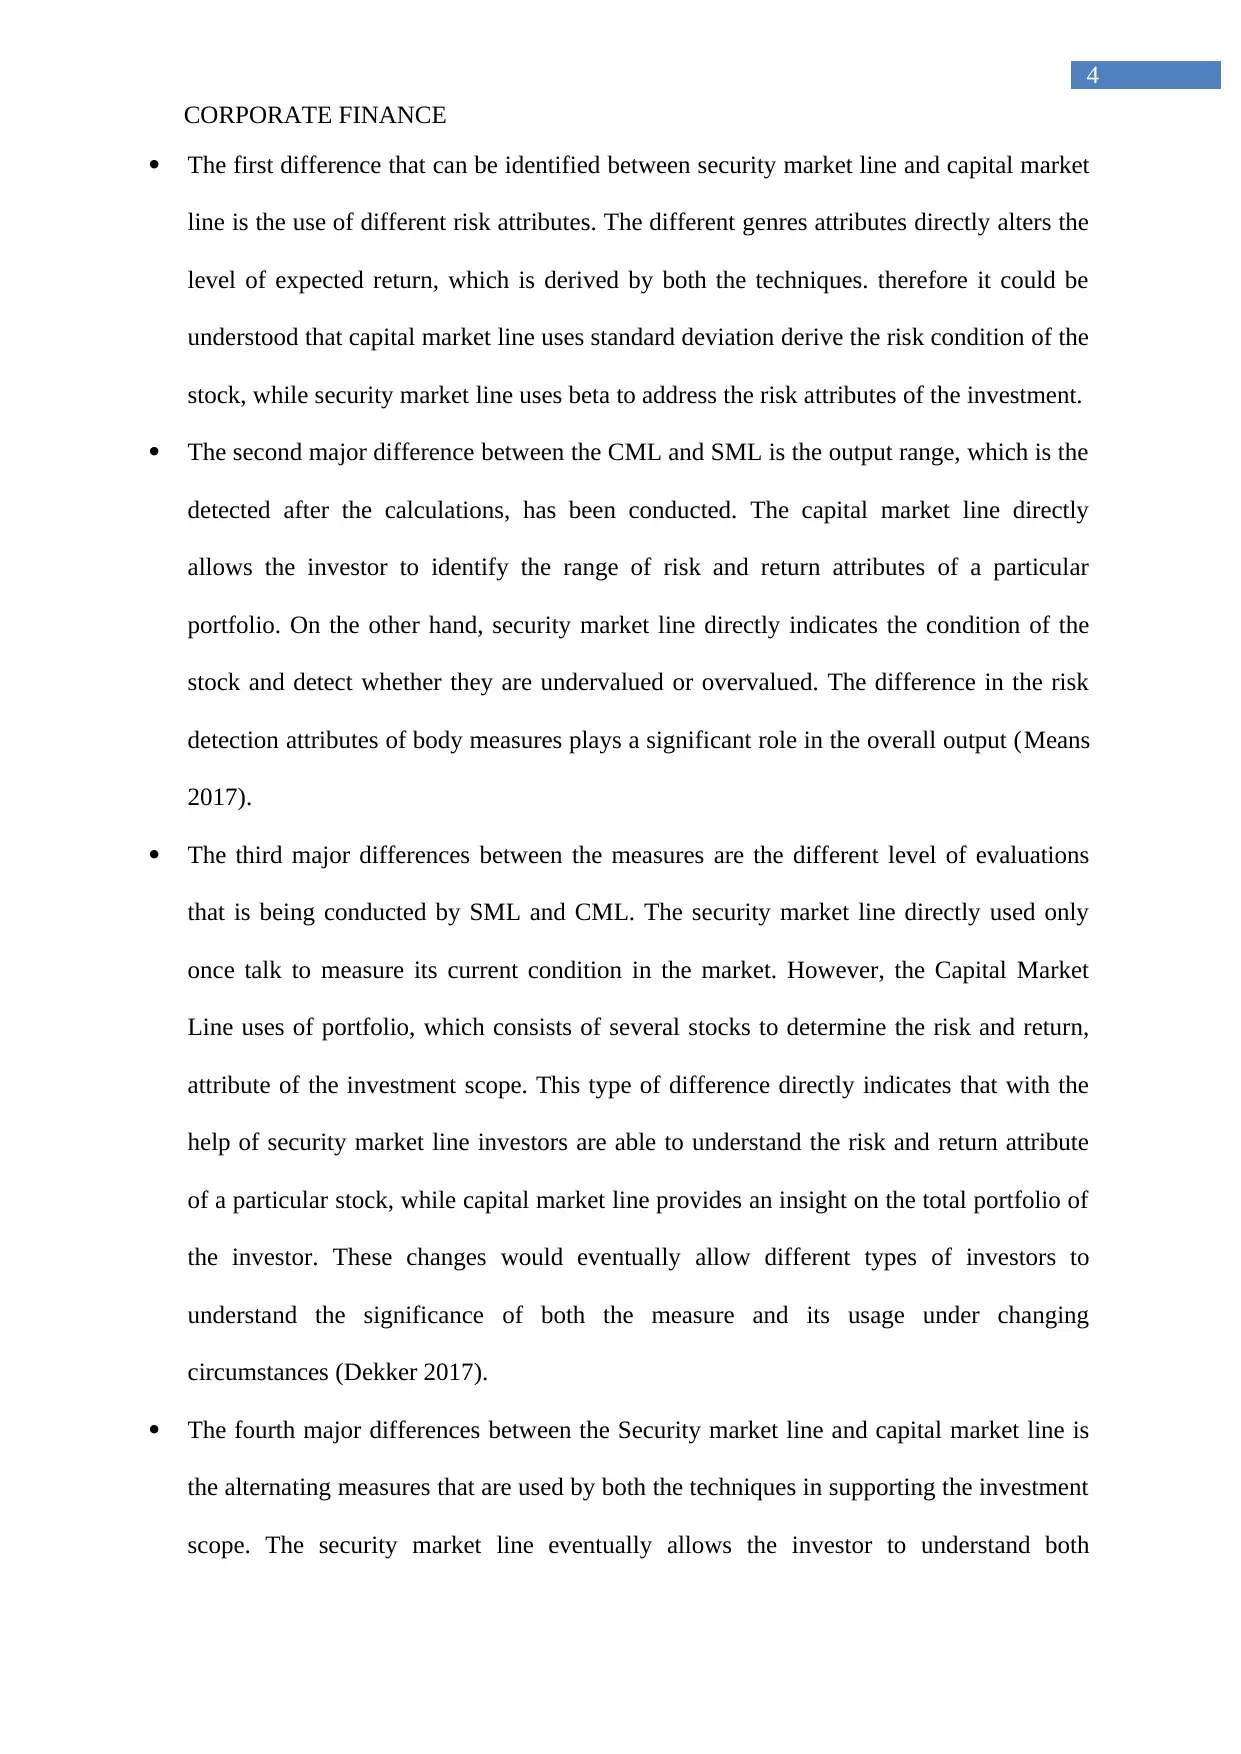
Understanding the significance of minimum variance portfolio:
Figure 3: Minimum variance portfolio graph
(Source: Bodnar, Mazur and Okhrin 2017)
5
Standard Deviation
Expected return
Efficient Frontier
Minimum Variance Portfolio
Systematic and unsystematic risk associated with an investment. On the other hand, the
capital market line directly depicts the level of systematic risk, which is involved in the
particular portfolio (Arrow 2017).
Investors by using the capital market line are able to create an adequate portfolio eating
their investment and risk requirement. On the other hand, the security market line only
portrays the current position of a particular stock and depicts whether it is overvalued or
undervalued. therefore, the investment scopes is also a difference between the capital
market line and security market line, as investors altering investment scope uses different
measures for controlling their exposure in the capital market (O'connor 2017).
Understanding the significance of minimum variance portfolio:
Figure 3: Minimum variance portfolio graph
(Source: Bodnar, Mazur and Okhrin 2017)
⊘ This is a preview!⊘
Do you want full access?
Subscribe today to unlock all pages.
Trusted by 1+ million students worldwide
CORPORATE FINANCE
6
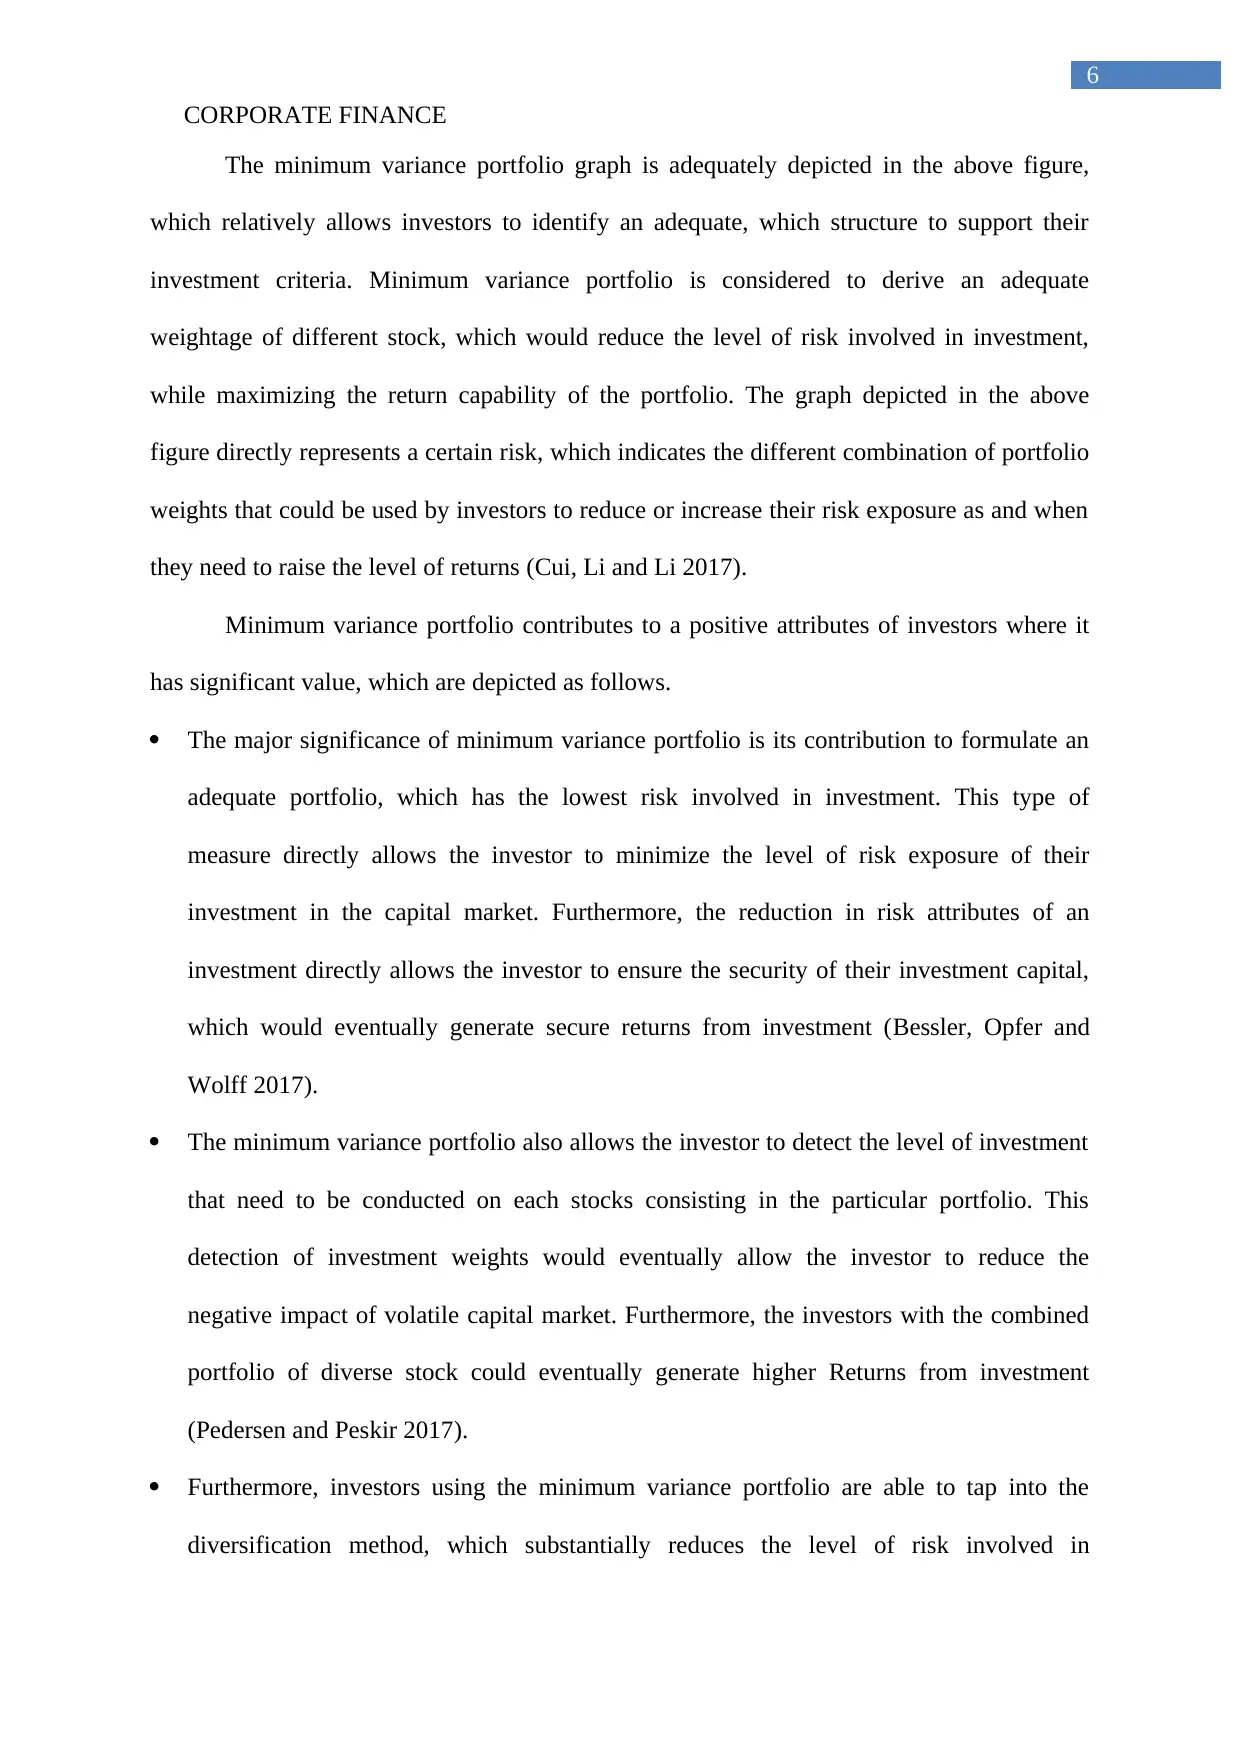
The minimum variance portfolio graph is adequately depicted in the above figure,
which relatively allows investors to identify an adequate, which structure to support their
investment criteria. Minimum variance portfolio is considered to derive an adequate
weightage of different stock, which would reduce the level of risk involved in investment,
while maximizing the return capability of the portfolio. The graph depicted in the above
figure directly represents a certain risk, which indicates the different combination of portfolio
weights that could be used by investors to reduce or increase their risk exposure as and when
they need to raise the level of returns (Cui, Li and Li 2017).
Minimum variance portfolio contributes to a positive attributes of investors where it
has significant value, which are depicted as follows.
The major significance of minimum variance portfolio is its contribution to formulate an
adequate portfolio, which has the lowest risk involved in investment. This type of
measure directly allows the investor to minimize the level of risk exposure of their
investment in the capital market. Furthermore, the reduction in risk attributes of an
investment directly allows the investor to ensure the security of their investment capital,
which would eventually generate secure returns from investment (Bessler, Opfer and
Wolff 2017).
The minimum variance portfolio also allows the investor to detect the level of investment
that need to be conducted on each stocks consisting in the particular portfolio. This
detection of investment weights would eventually allow the investor to reduce the
negative impact of volatile capital market. Furthermore, the investors with the combined
portfolio of diverse stock could eventually generate higher Returns from investment
(Pedersen and Peskir 2017).
Furthermore, investors using the minimum variance portfolio are able to tap into the
diversification method, which substantially reduces the level of risk involved in
6
The minimum variance portfolio graph is adequately depicted in the above figure,
which relatively allows investors to identify an adequate, which structure to support their
investment criteria. Minimum variance portfolio is considered to derive an adequate
weightage of different stock, which would reduce the level of risk involved in investment,
while maximizing the return capability of the portfolio. The graph depicted in the above
figure directly represents a certain risk, which indicates the different combination of portfolio
weights that could be used by investors to reduce or increase their risk exposure as and when
they need to raise the level of returns (Cui, Li and Li 2017).
Minimum variance portfolio contributes to a positive attributes of investors where it
has significant value, which are depicted as follows.
The major significance of minimum variance portfolio is its contribution to formulate an
adequate portfolio, which has the lowest risk involved in investment. This type of
measure directly allows the investor to minimize the level of risk exposure of their
investment in the capital market. Furthermore, the reduction in risk attributes of an
investment directly allows the investor to ensure the security of their investment capital,
which would eventually generate secure returns from investment (Bessler, Opfer and
Wolff 2017).
The minimum variance portfolio also allows the investor to detect the level of investment
that need to be conducted on each stocks consisting in the particular portfolio. This
detection of investment weights would eventually allow the investor to reduce the
negative impact of volatile capital market. Furthermore, the investors with the combined
portfolio of diverse stock could eventually generate higher Returns from investment
(Pedersen and Peskir 2017).
Furthermore, investors using the minimum variance portfolio are able to tap into the
diversification method, which substantially reduces the level of risk involved in
Paraphrase This Document
Need a fresh take? Get an instant paraphrase of this document with our AI Paraphraser
CORPORATE FINANCE
7
investment. Therefore, minimum variance portfolio allows the investor to increase the
diversification process to accommodate mode stocks which good yield high returns on
yearly basis. However, the depicted in the above figure relatively represents the level of
different risk and return attributes that can be generated from the efficient Frontier.
Investors can use different combination of weeds represented by the efficient Frontier to
increase the level of risk and return from their investment.
Another significance of minimum variance portfolio is its compatibility to utilize
different stocks to derive the adequate portfolio that could have the least risk involved in
investment. This is a major significance for the investment technique, as it could combine
different investment categories such as equity, bonds, and risk-free interest to derive the
level of returns that could be generated from investment. Minimum variance portfolio
allows investor to formulate an accurate investment scheme, which could help in securing
the returns for long duration (Kuehin, Simutin and Wang 2017).
Lastly, the minimum variance portfolio directly supports the conservative investors and
secures their invested capital, which directly helps in reducing the level of risk involved
in investment. The investors using the minimum variance portfolio are able to maximize
the level of income, which can be generated from investment. Hence, it can be understood
that with the use of minimum variance portfolio investors can conduct adequate
investments to secure their invested capital.
CORPORATE FINANCE
8
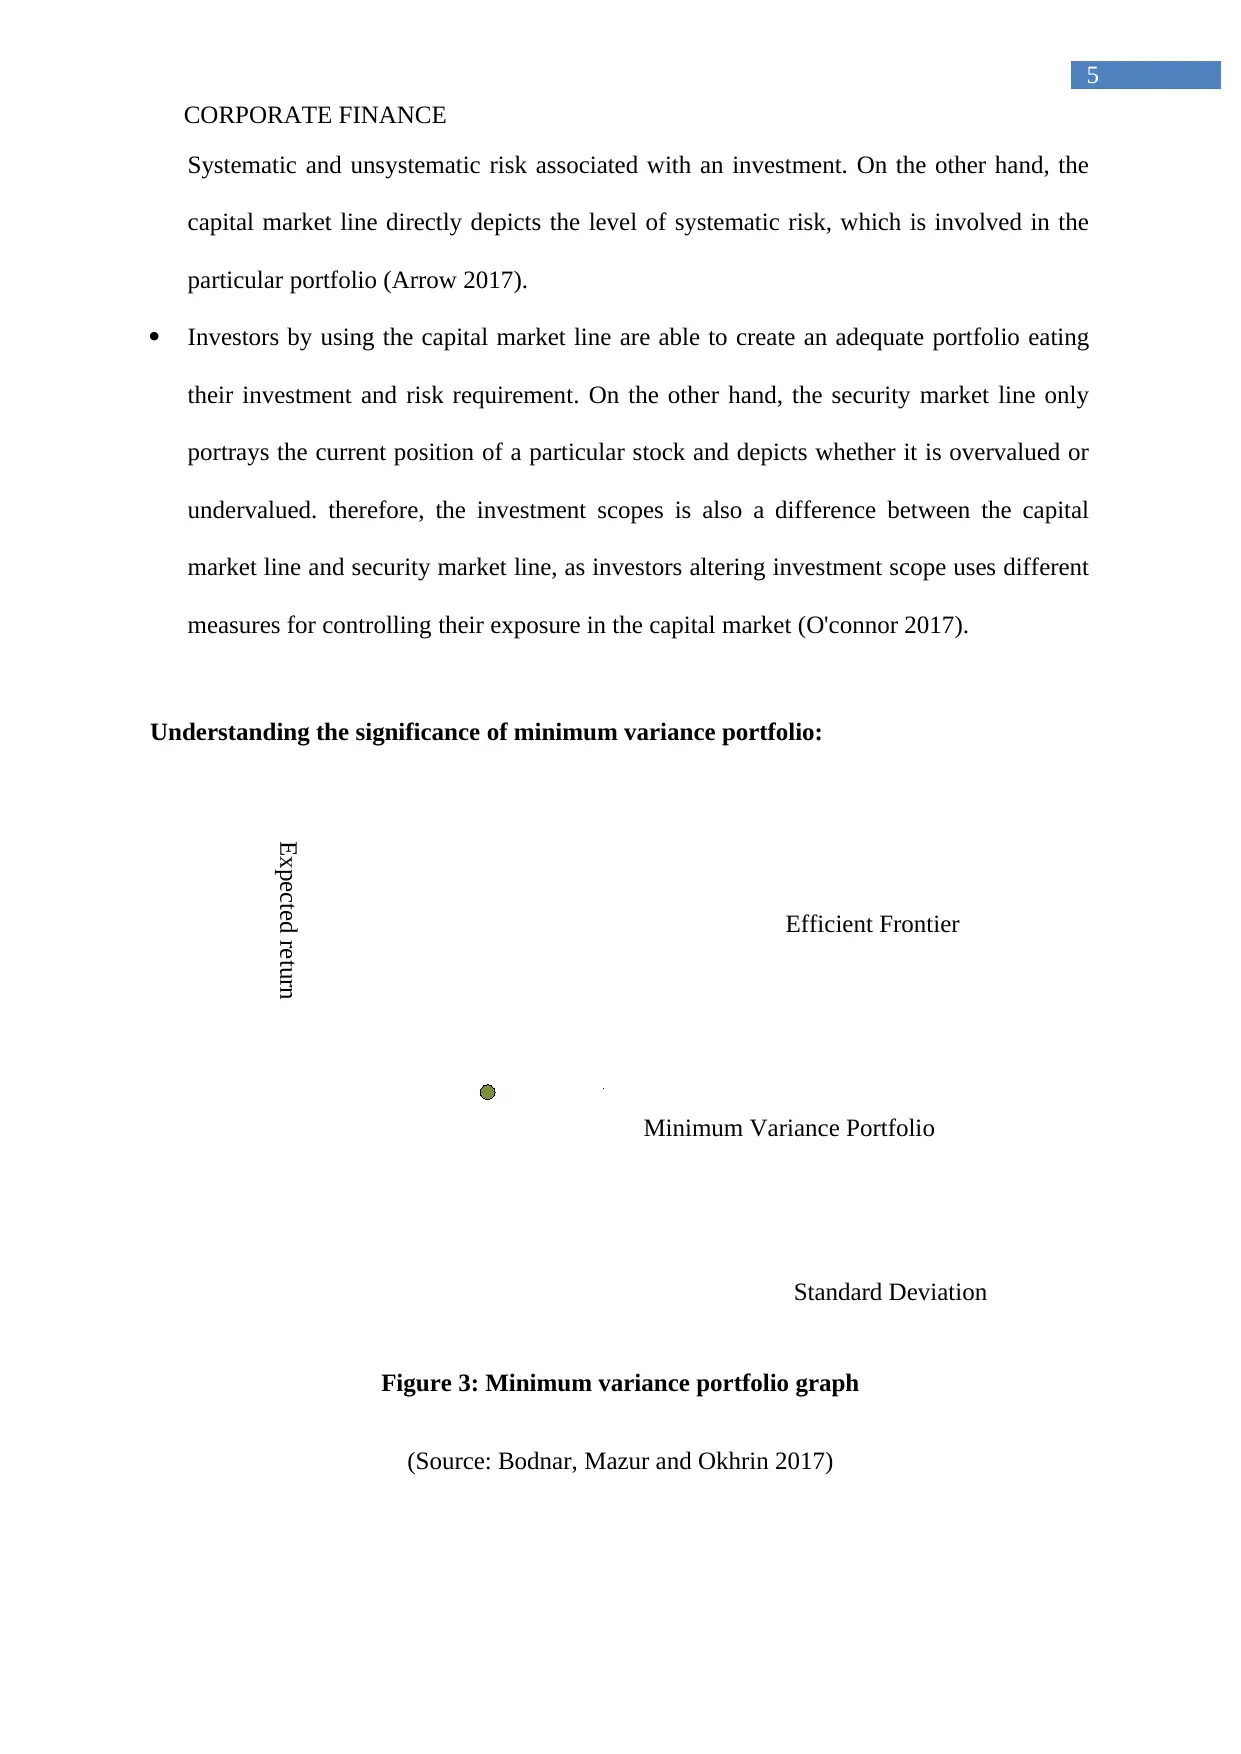
Understanding why CAPM calculation has been extensively used by investors over the
years:
Figure 4: Capital Asset Pricing Model
(Source: He, Kelly and Manela 2017)
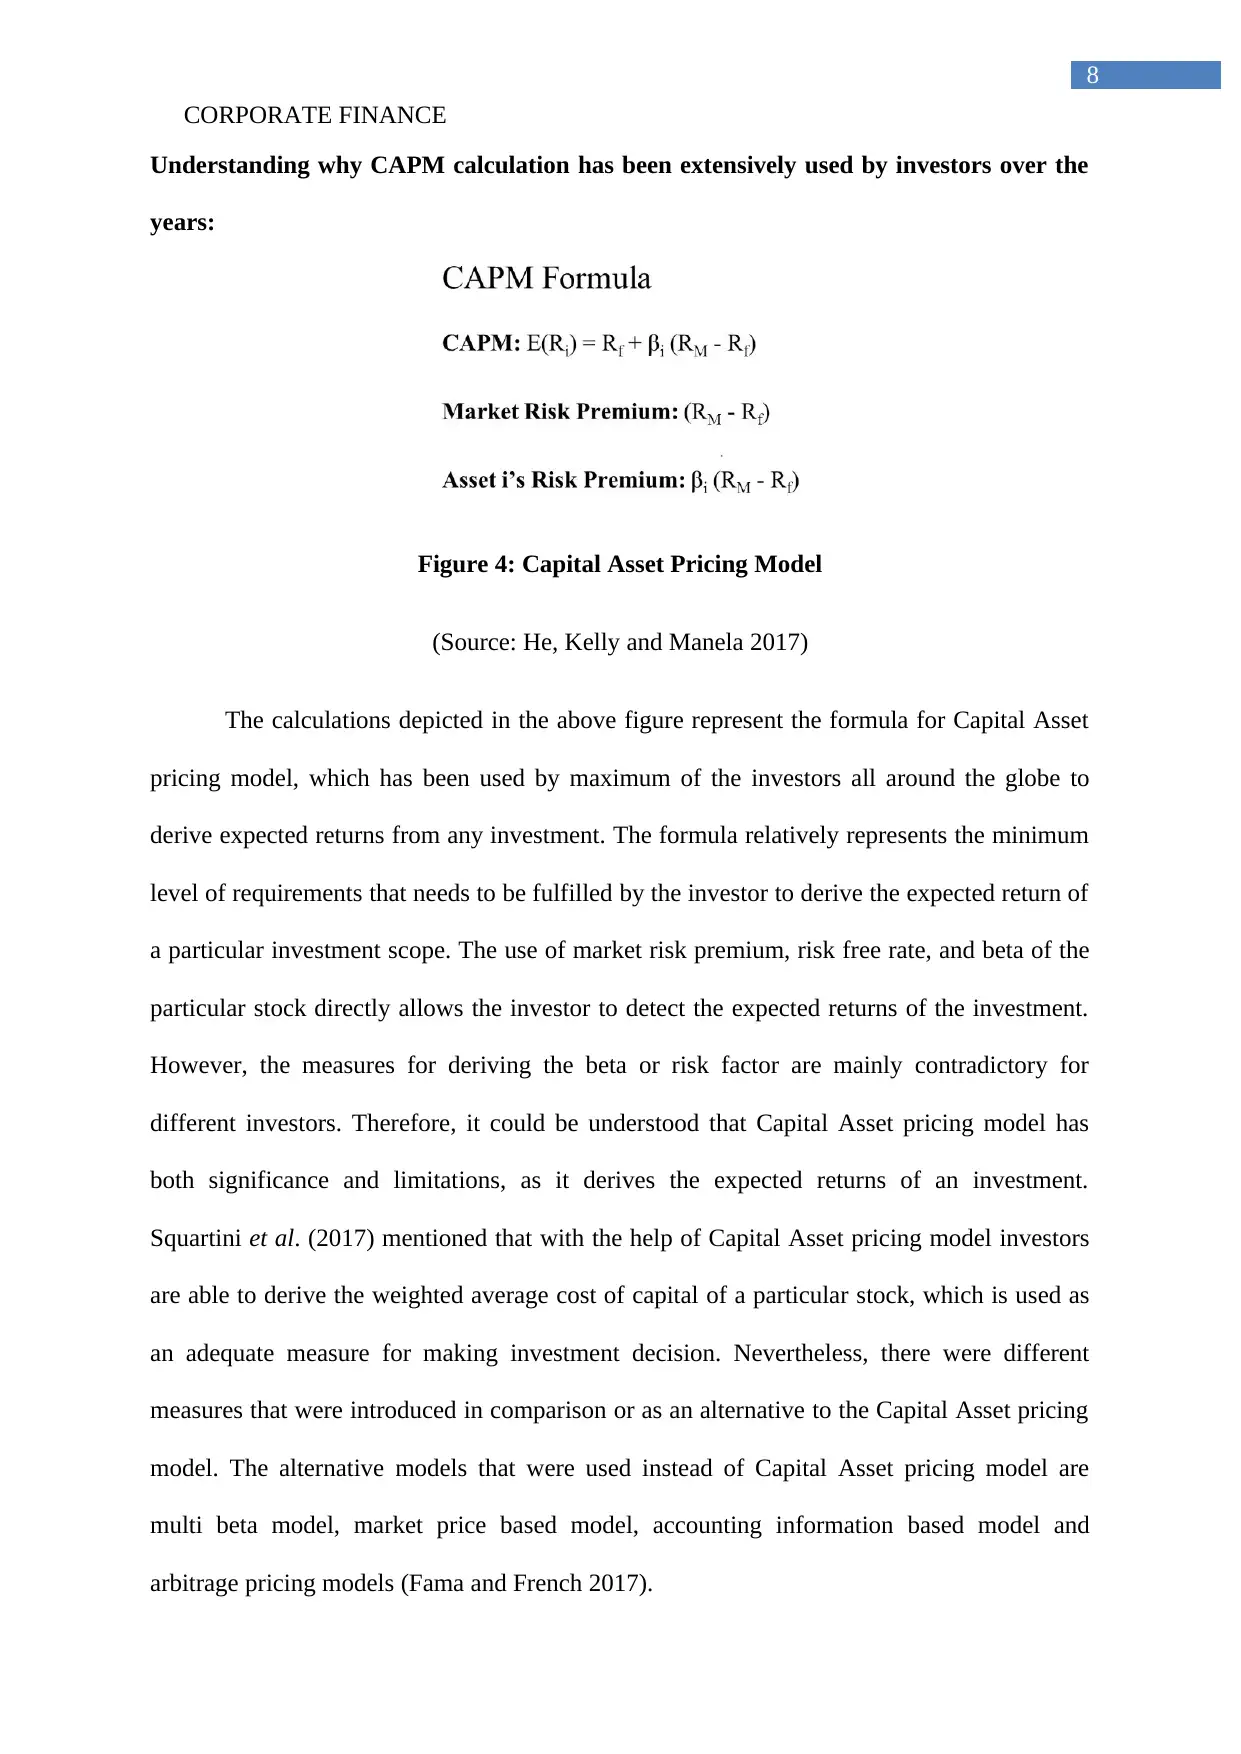
The calculations depicted in the above figure represent the formula for Capital Asset
pricing model, which has been used by maximum of the investors all around the globe to
derive expected returns from any investment. The formula relatively represents the minimum
level of requirements that needs to be fulfilled by the investor to derive the expected return of
a particular investment scope. The use of market risk premium, risk free rate, and beta of the
particular stock directly allows the investor to detect the expected returns of the investment.
However, the measures for deriving the beta or risk factor are mainly contradictory for
different investors. Therefore, it could be understood that Capital Asset pricing model has
both significance and limitations, as it derives the expected returns of an investment.
Squartini et al. (2017) mentioned that with the help of Capital Asset pricing model investors
are able to derive the weighted average cost of capital of a particular stock, which is used as
an adequate measure for making investment decision. Nevertheless, there were different
measures that were introduced in comparison or as an alternative to the Capital Asset pricing
model. The alternative models that were used instead of Capital Asset pricing model are
multi beta model, market price based model, accounting information based model and
arbitrage pricing models (Fama and French 2017).
8
Understanding why CAPM calculation has been extensively used by investors over the
years:
Figure 4: Capital Asset Pricing Model
(Source: He, Kelly and Manela 2017)
The calculations depicted in the above figure represent the formula for Capital Asset
pricing model, which has been used by maximum of the investors all around the globe to
derive expected returns from any investment. The formula relatively represents the minimum
level of requirements that needs to be fulfilled by the investor to derive the expected return of
a particular investment scope. The use of market risk premium, risk free rate, and beta of the
particular stock directly allows the investor to detect the expected returns of the investment.
However, the measures for deriving the beta or risk factor are mainly contradictory for
different investors. Therefore, it could be understood that Capital Asset pricing model has
both significance and limitations, as it derives the expected returns of an investment.
Squartini et al. (2017) mentioned that with the help of Capital Asset pricing model investors
are able to derive the weighted average cost of capital of a particular stock, which is used as
an adequate measure for making investment decision. Nevertheless, there were different
measures that were introduced in comparison or as an alternative to the Capital Asset pricing
model. The alternative models that were used instead of Capital Asset pricing model are
multi beta model, market price based model, accounting information based model and
arbitrage pricing models (Fama and French 2017).
⊘ This is a preview!⊘
Do you want full access?
Subscribe today to unlock all pages.
Trusted by 1+ million students worldwide
CORPORATE FINANCE
9
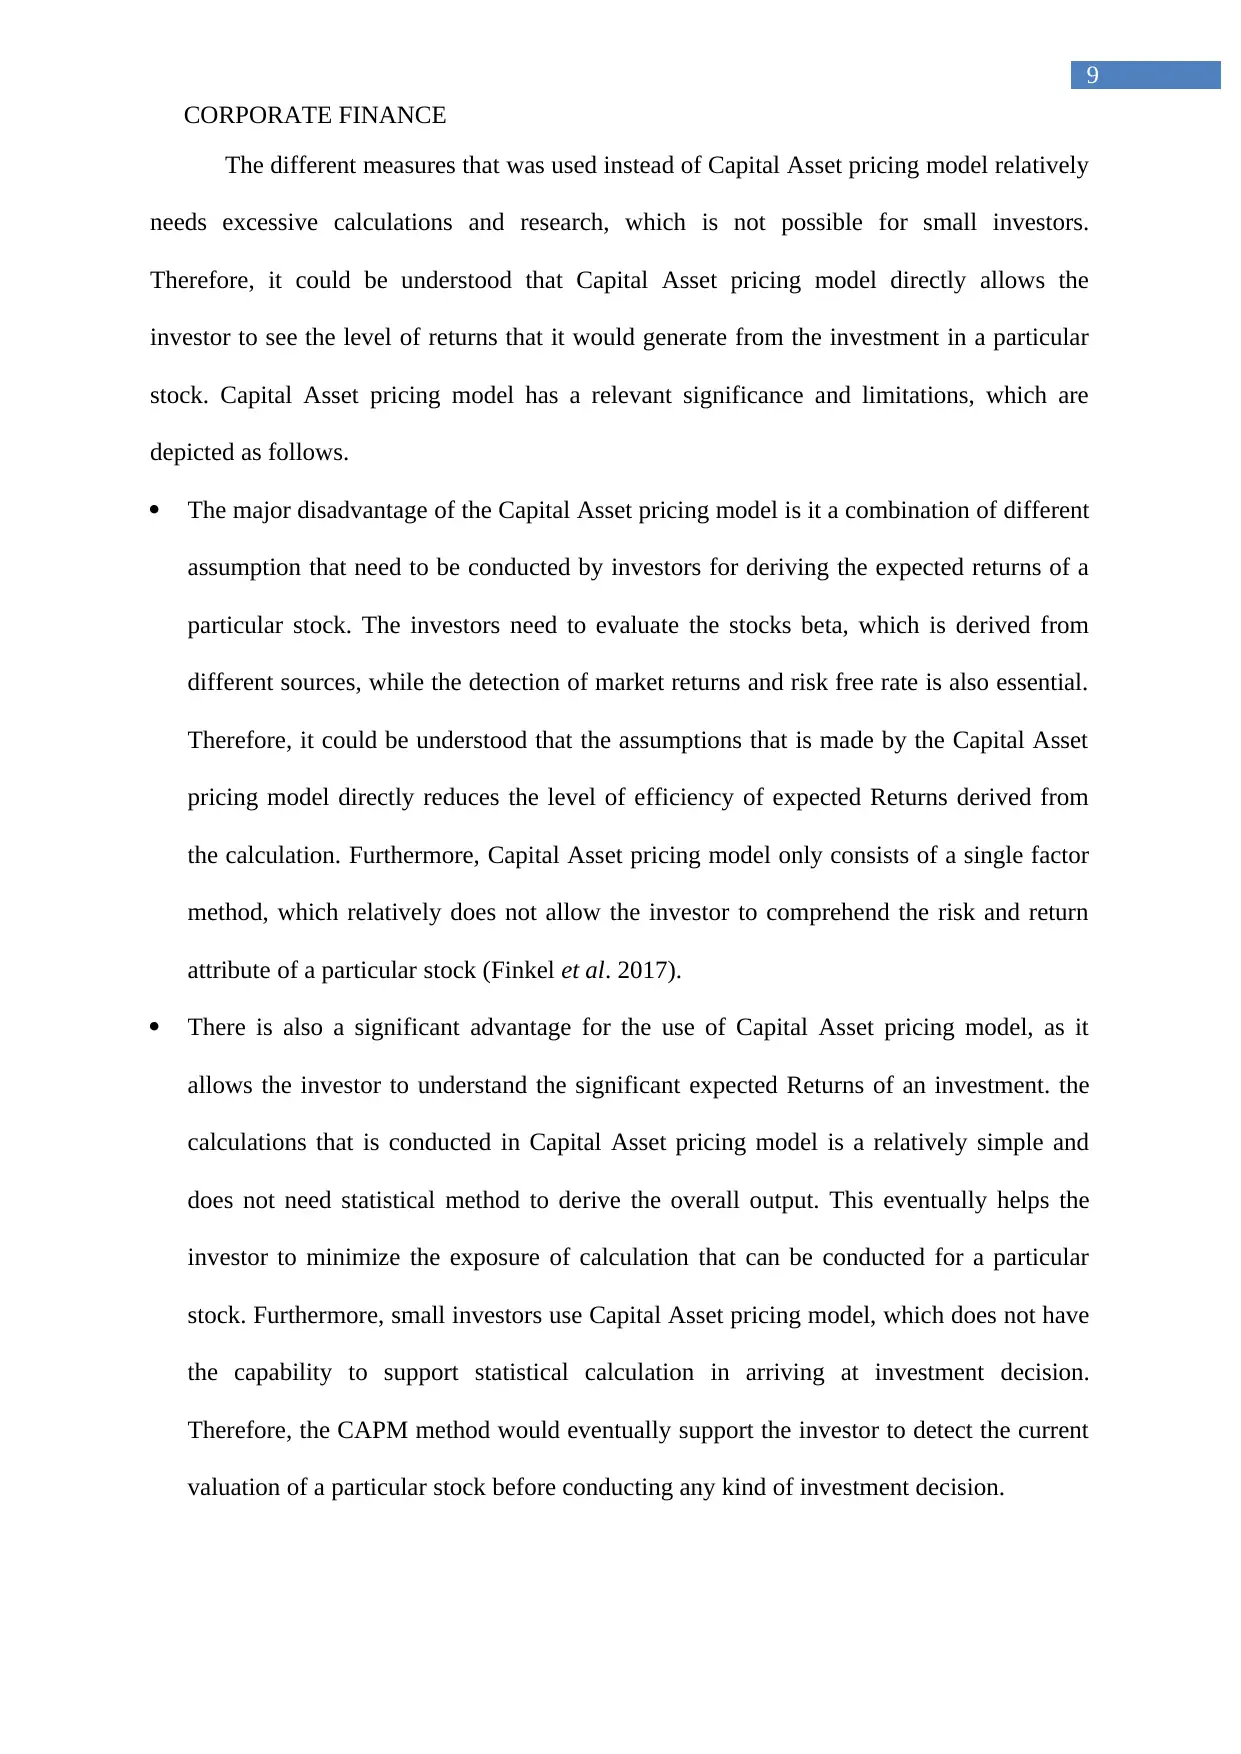
The different measures that was used instead of Capital Asset pricing model relatively
needs excessive calculations and research, which is not possible for small investors.
Therefore, it could be understood that Capital Asset pricing model directly allows the
investor to see the level of returns that it would generate from the investment in a particular
stock. Capital Asset pricing model has a relevant significance and limitations, which are
depicted as follows.
The major disadvantage of the Capital Asset pricing model is it a combination of different
assumption that need to be conducted by investors for deriving the expected returns of a
particular stock. The investors need to evaluate the stocks beta, which is derived from
different sources, while the detection of market returns and risk free rate is also essential.
Therefore, it could be understood that the assumptions that is made by the Capital Asset
pricing model directly reduces the level of efficiency of expected Returns derived from
the calculation. Furthermore, Capital Asset pricing model only consists of a single factor
method, which relatively does not allow the investor to comprehend the risk and return
attribute of a particular stock (Finkel et al. 2017).
There is also a significant advantage for the use of Capital Asset pricing model, as it
allows the investor to understand the significant expected Returns of an investment. the
calculations that is conducted in Capital Asset pricing model is a relatively simple and
does not need statistical method to derive the overall output. This eventually helps the
investor to minimize the exposure of calculation that can be conducted for a particular
stock. Furthermore, small investors use Capital Asset pricing model, which does not have
the capability to support statistical calculation in arriving at investment decision.
Therefore, the CAPM method would eventually support the investor to detect the current
valuation of a particular stock before conducting any kind of investment decision.
9
The different measures that was used instead of Capital Asset pricing model relatively
needs excessive calculations and research, which is not possible for small investors.
Therefore, it could be understood that Capital Asset pricing model directly allows the
investor to see the level of returns that it would generate from the investment in a particular
stock. Capital Asset pricing model has a relevant significance and limitations, which are
depicted as follows.
The major disadvantage of the Capital Asset pricing model is it a combination of different
assumption that need to be conducted by investors for deriving the expected returns of a
particular stock. The investors need to evaluate the stocks beta, which is derived from
different sources, while the detection of market returns and risk free rate is also essential.
Therefore, it could be understood that the assumptions that is made by the Capital Asset
pricing model directly reduces the level of efficiency of expected Returns derived from
the calculation. Furthermore, Capital Asset pricing model only consists of a single factor
method, which relatively does not allow the investor to comprehend the risk and return
attribute of a particular stock (Finkel et al. 2017).
There is also a significant advantage for the use of Capital Asset pricing model, as it
allows the investor to understand the significant expected Returns of an investment. the
calculations that is conducted in Capital Asset pricing model is a relatively simple and
does not need statistical method to derive the overall output. This eventually helps the
investor to minimize the exposure of calculation that can be conducted for a particular
stock. Furthermore, small investors use Capital Asset pricing model, which does not have
the capability to support statistical calculation in arriving at investment decision.
Therefore, the CAPM method would eventually support the investor to detect the current
valuation of a particular stock before conducting any kind of investment decision.
Paraphrase This Document
Need a fresh take? Get an instant paraphrase of this document with our AI Paraphraser

CORPORATE FINANCE
10
Conclusion:
After evaluating the theories and techniques described in the above assessment, it
could be identified that investors meet and accurate and reliable measure for detecting the
level of risk and return attributes of an investment. These measures can be identified with the
help of several techniques and theories such as Capital Asset pricing model, minimum
variance portfolio, security market line, and capital mark. The use of the above theories and
techniques is relatively based on the choice and consideration of the investors, as it allows
small and large investors to make adequate investment decisions. Hence, the assessment
highlights the significance of risk and return evaluation, which allows the investors to secure
their exposure in the capital market.
CORPORATE FINANCE
11
References:
Arrow, K.J., 2017. Optimal capital policy with irreversible investment. In Value, capital and
growth (pp. 1-20). Routledge.
Bessler, W., Opfer, H. and Wolff, D., 2017. Multi-asset portfolio optimization and out-of-
sample performance: an evaluation of Black–Litterman, mean-variance, and naïve
diversification approaches. The European Journal of Finance, 23(1), pp.1-30.
Bodnar, T., Mazur, S. and Okhrin, Y., 2017. Bayesian estimation of the global minimum
variance portfolio. European Journal of Operational Research, 256(1), pp.292-307.
Cui, X., Li, D. and Li, X., 2017. Mean‐variance policy for discrete‐time cone‐constrained
markets: Time consistency in efficiency and the minimum‐variance signed supermartingale
measure. Mathematical Finance, 27(2), pp.471-504.
Dash, M., 2017. “Reverse-Engineering” the Market Portfolio. Journal of Applied
Management and Investments, 6(3), pp.151-156.
Dekker, H.A., 2017. The invisible line: land reform, land tenure security and land
registration. Routledge.
Fama, E.F. and French, K.R., 2017. International tests of a five-factor asset pricing
model. Journal of financial Economics, 123(3), pp.441-463.
Finkel, A., Moses, K., Munro, C., Effeney, T. and OKane, M., 2017. Independent review into
the future security of the National Electricity Market. Australia. Department of the
Environment and Energy.
He, Z., Kelly, B. and Manela, A., 2017. Intermediary asset pricing: New evidence from many
asset classes. Journal of Financial Economics, 126(1), pp.1-35.
⊘ This is a preview!⊘
Do you want full access?
Subscribe today to unlock all pages.
Trusted by 1+ million students worldwide
1 out of 13
Related Documents


Your All-in-One AI-Powered Toolkit for Academic Success.
+13062052269
info@desklib.com
Available 24*7 on WhatsApp / Email
![[object Object]](/_next/static/media/star-bottom.7253800d.svg)
Unlock your academic potential
Copyright © 2020–2026 A2Z Services. All Rights Reserved. Developed and managed by ZUCOL.