Home Designs Ltd: Financial Statements, Inventory, and Ratio Analysis

Verified

Added on  2022/09/15

|19
|3857
|20
Homework Assignment
AI Summary
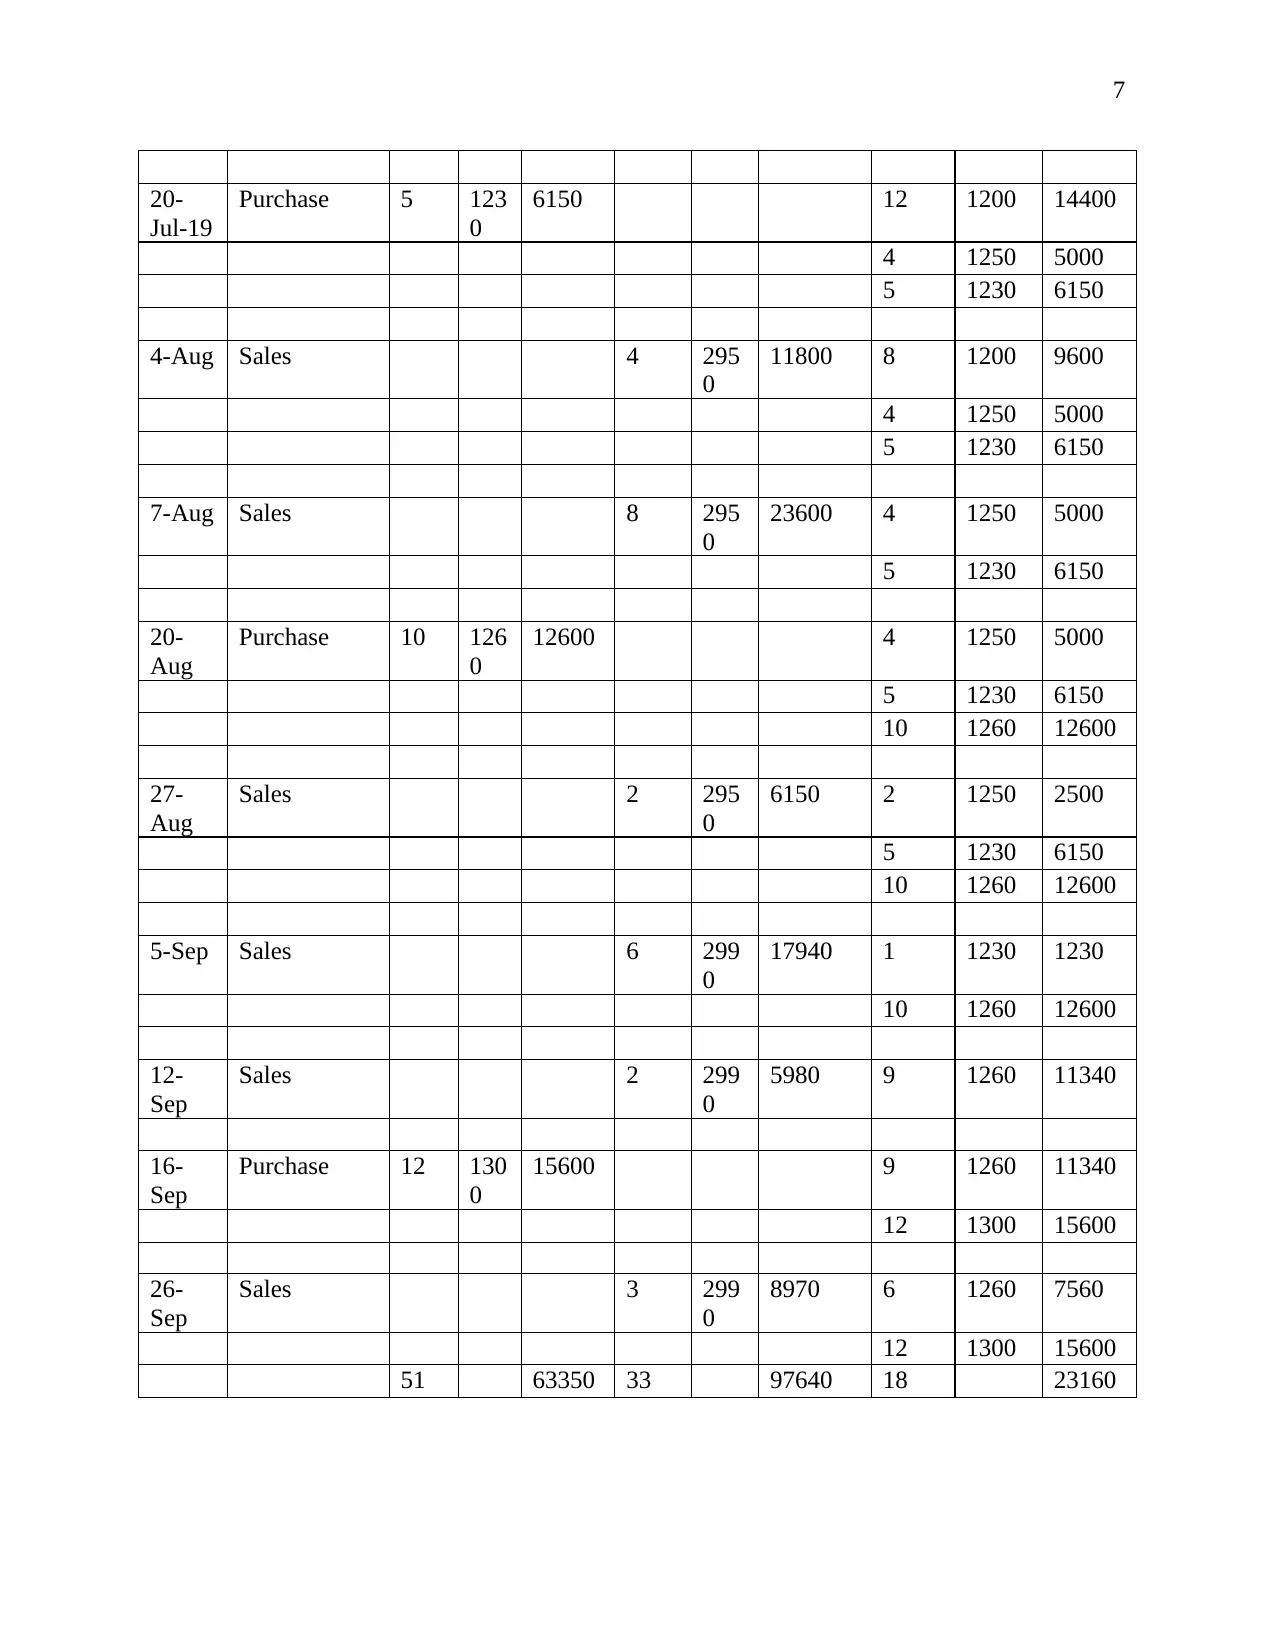
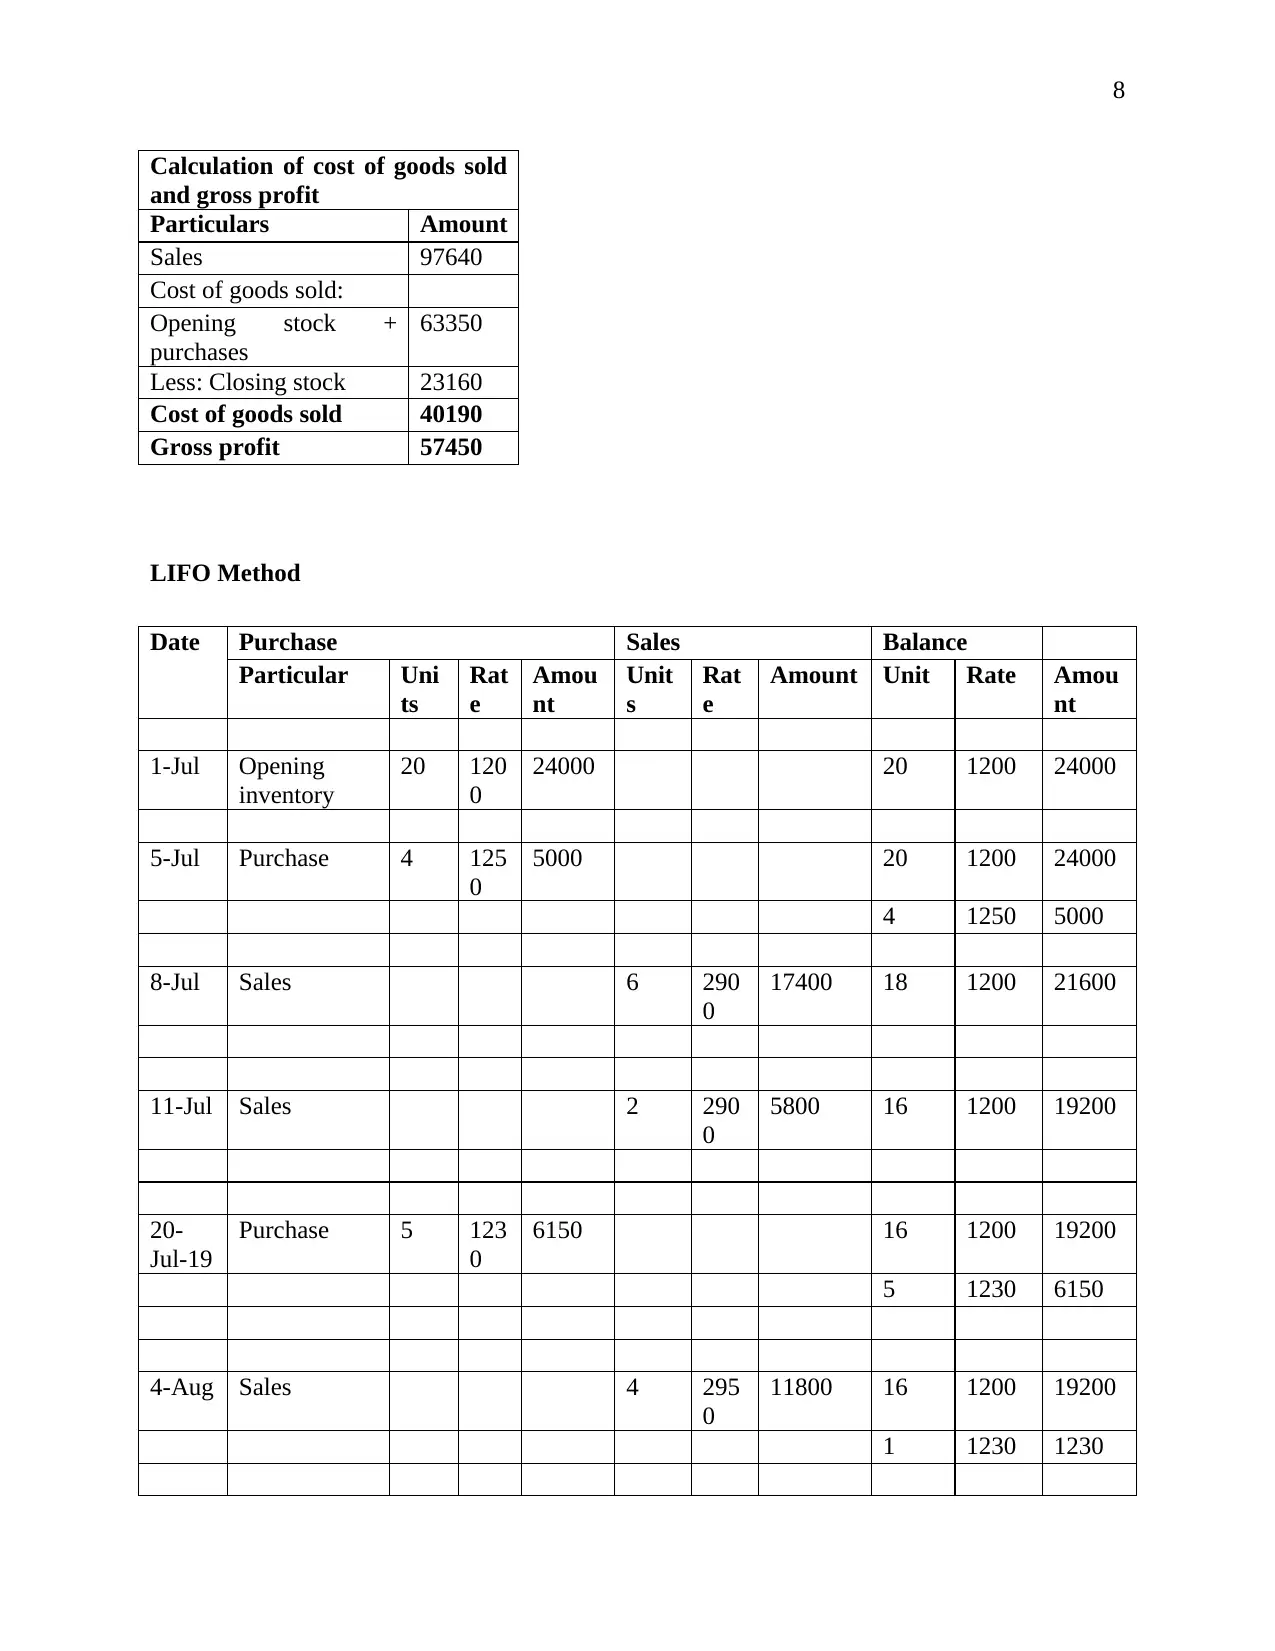
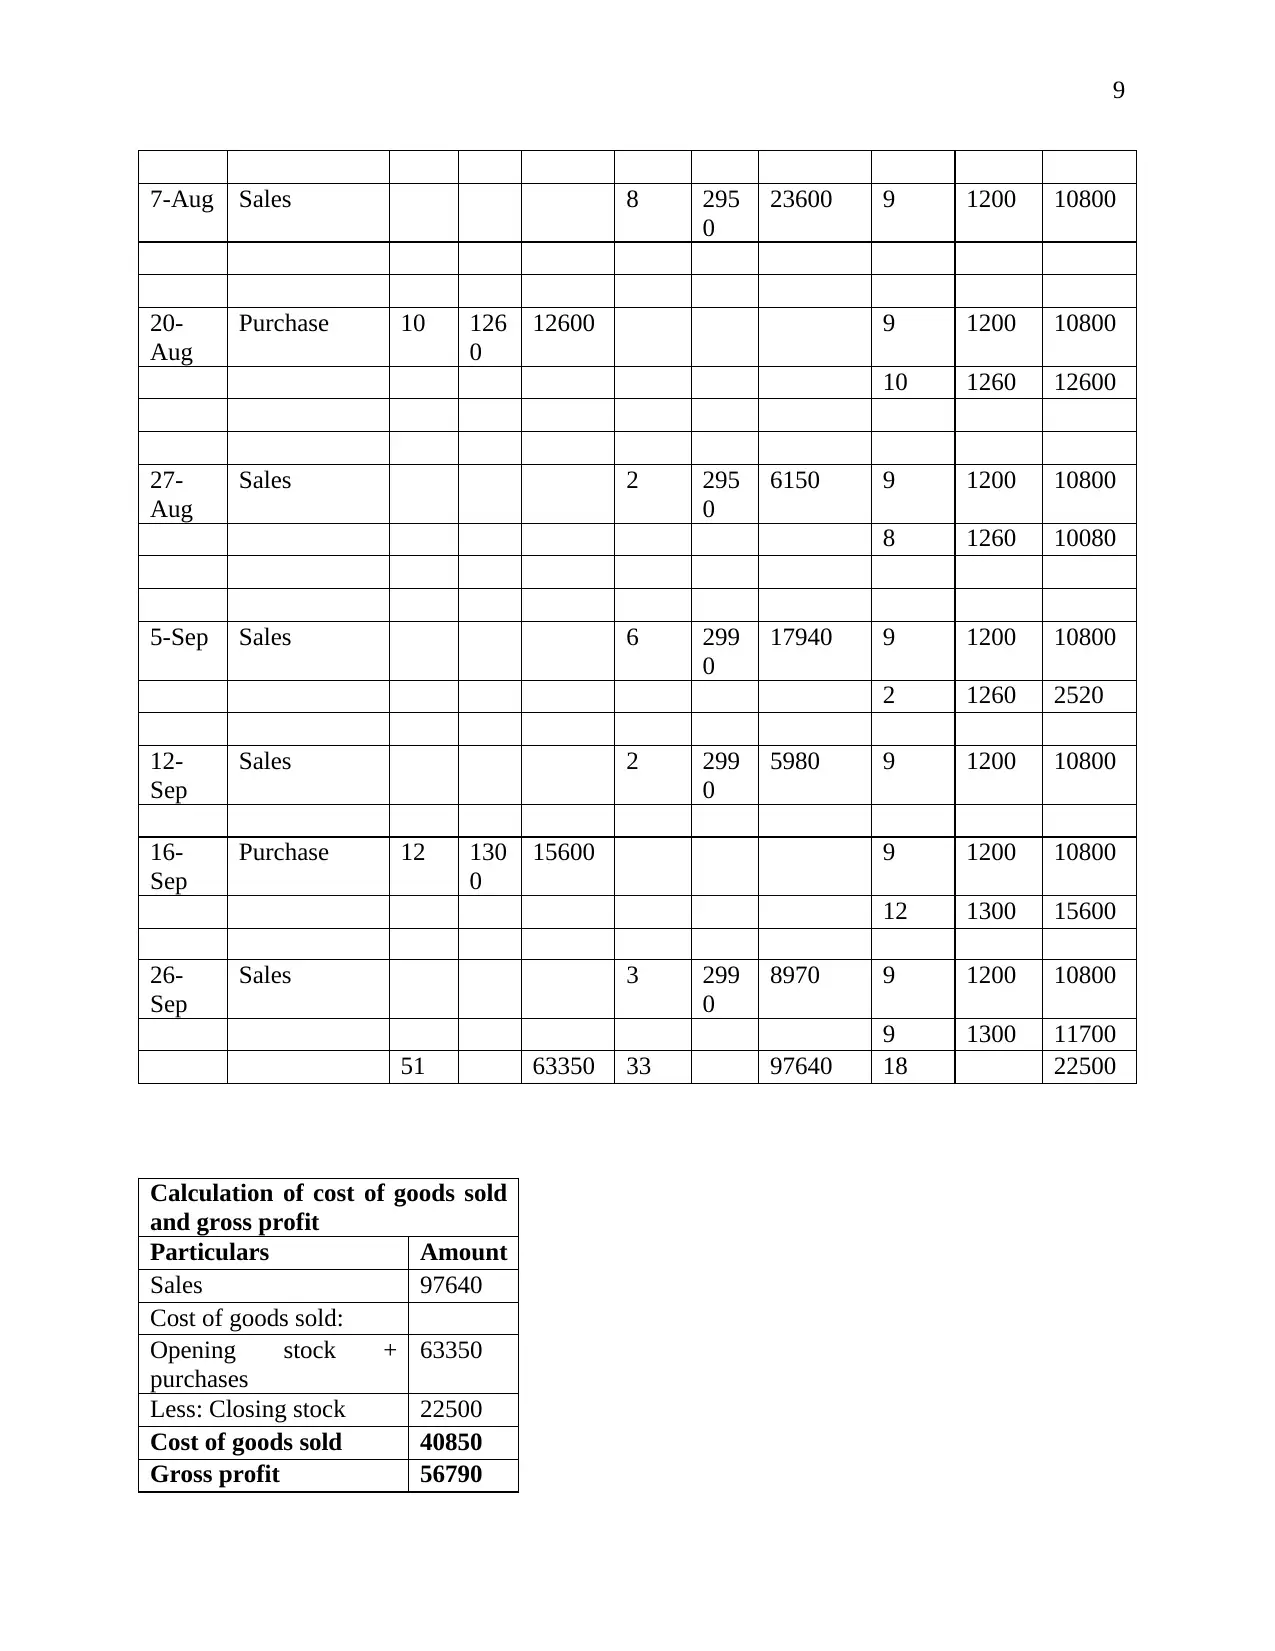
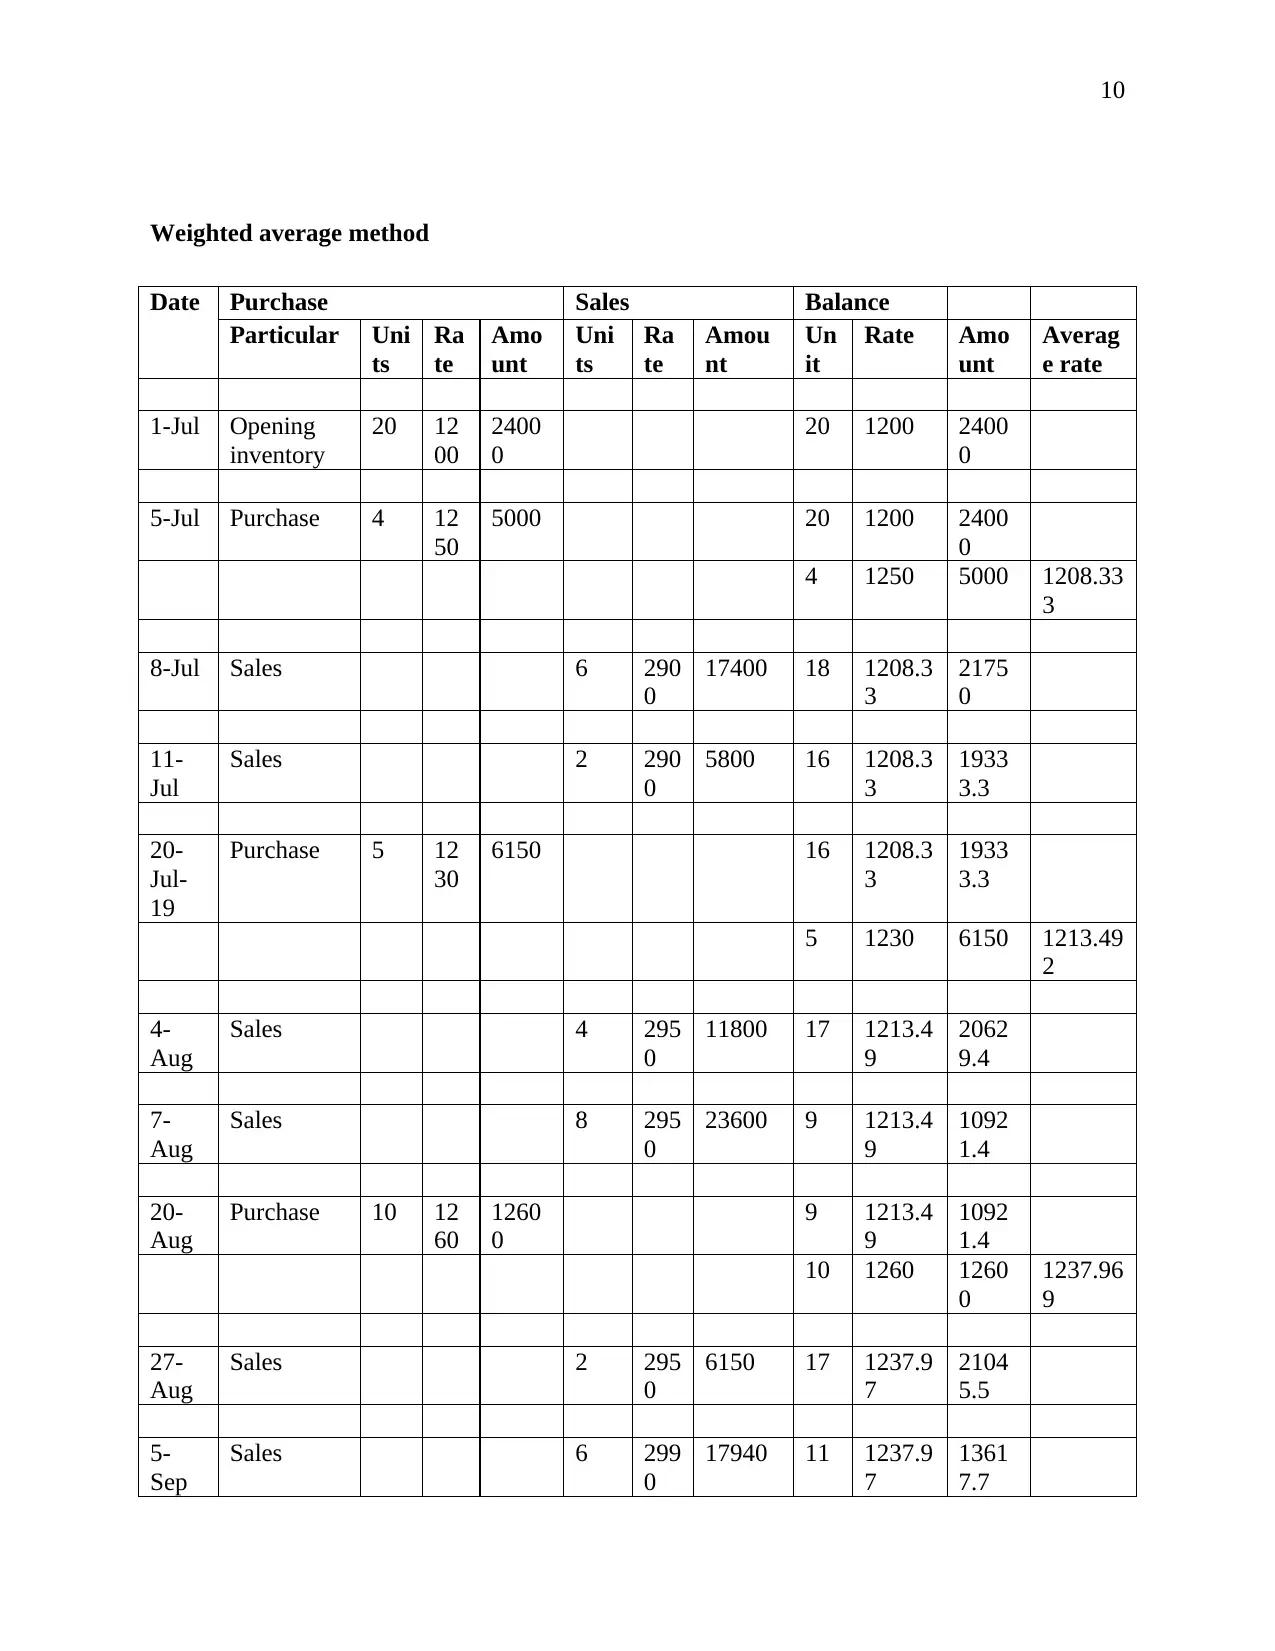
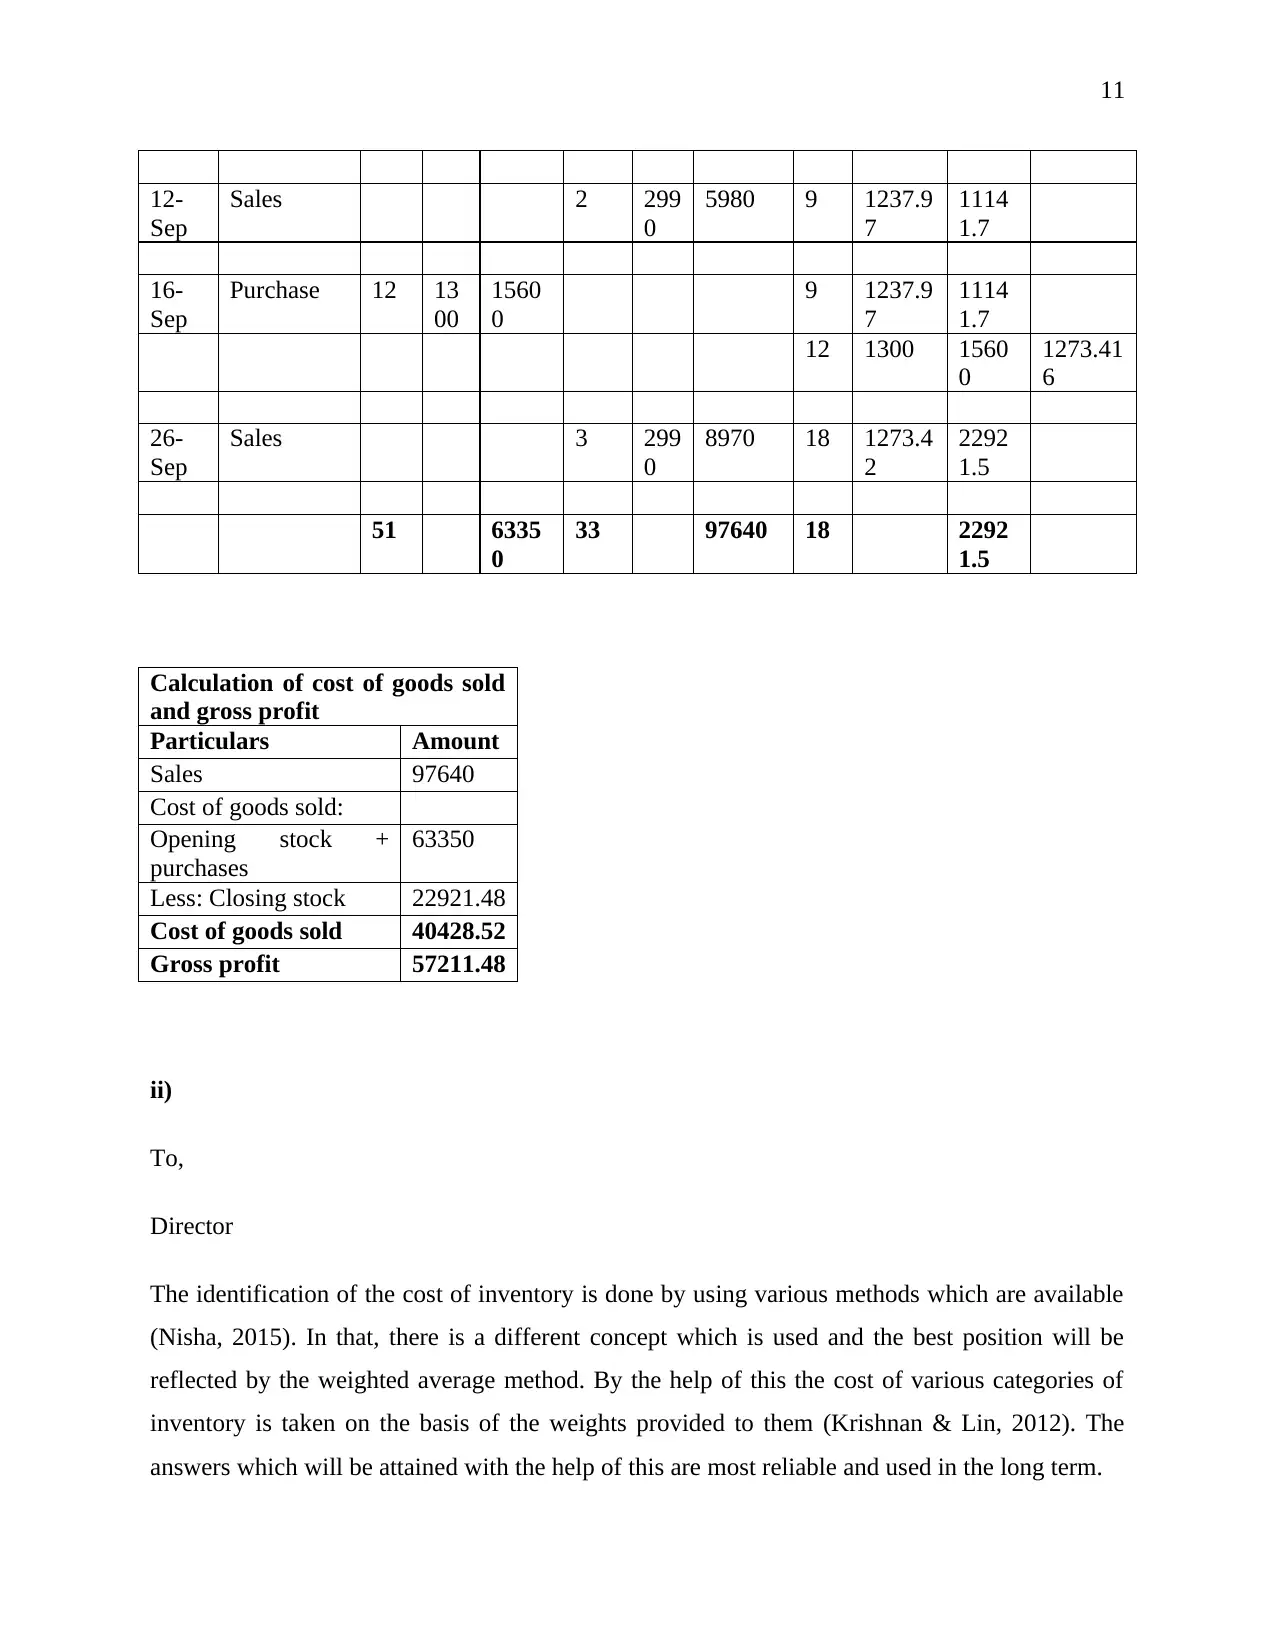
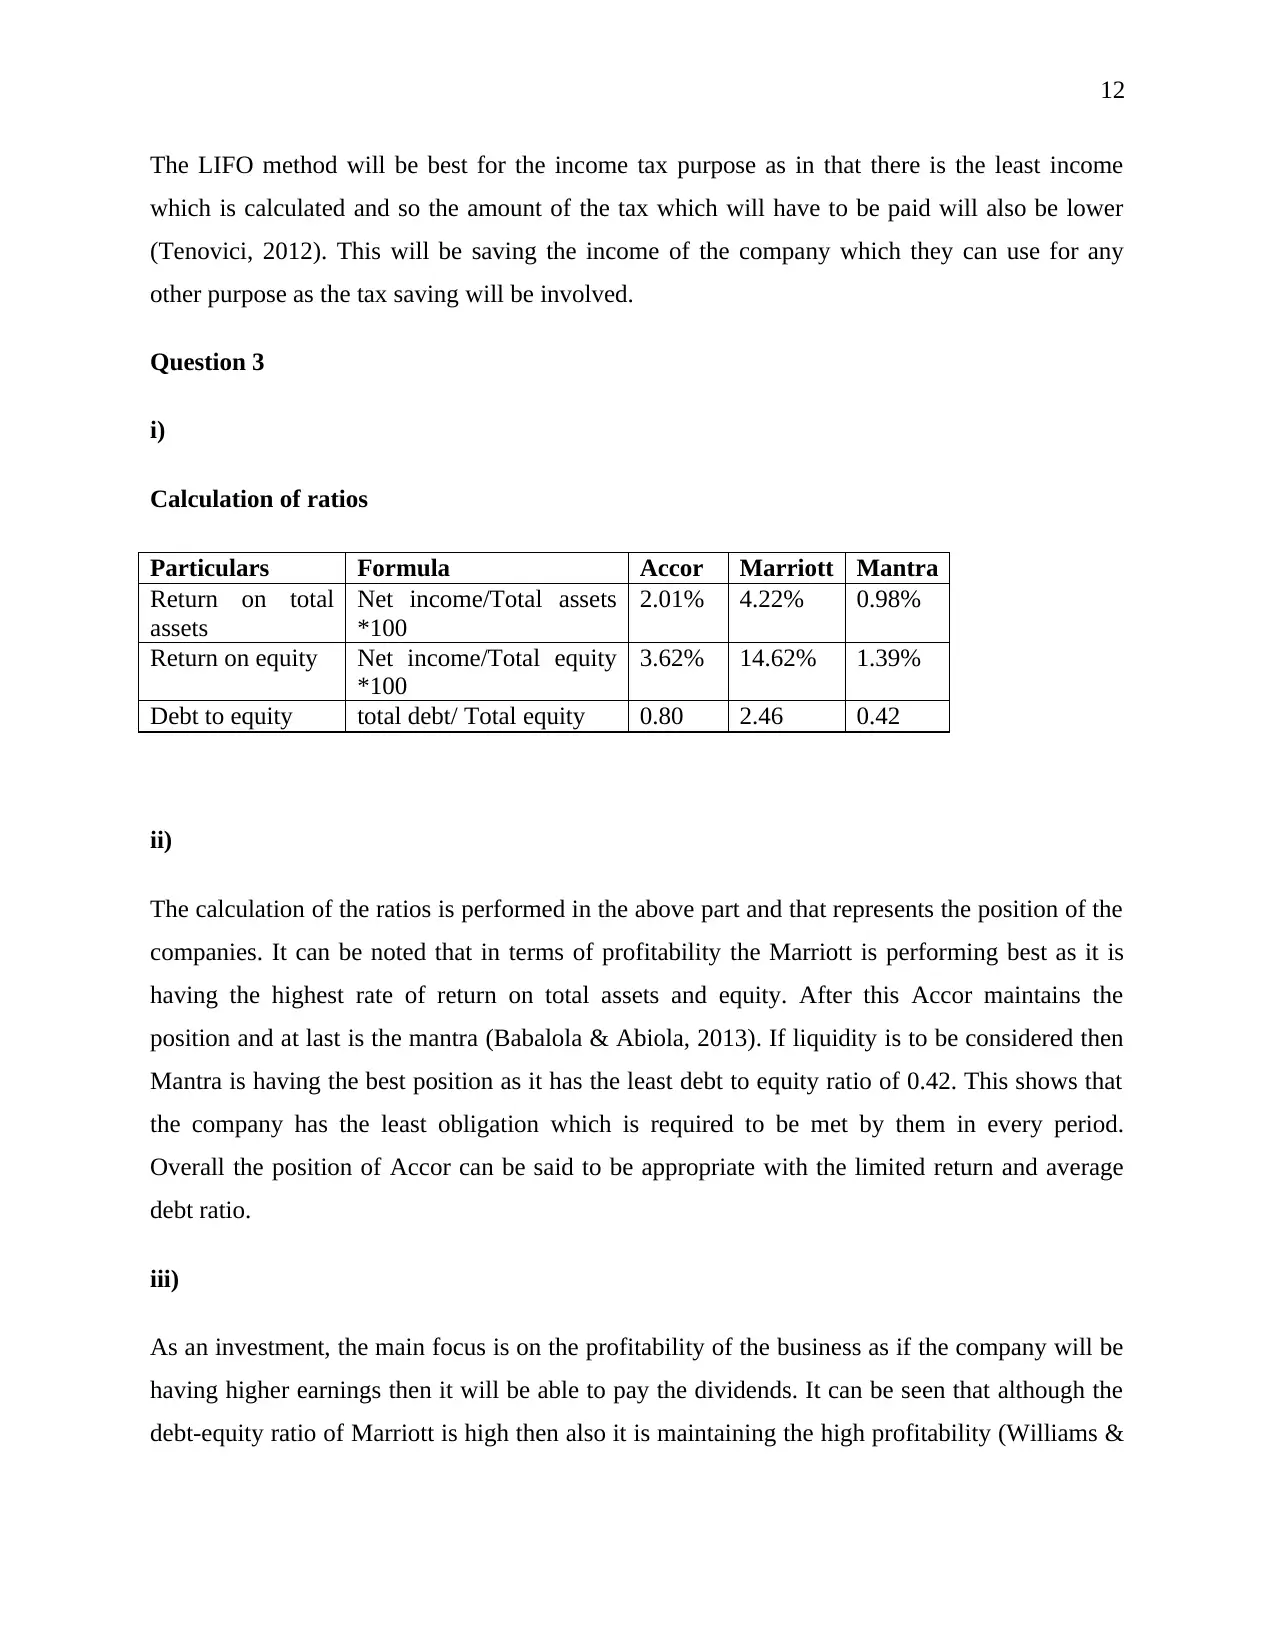
This assignment solution addresses key aspects of business accounting and finance, including the preparation of financial statements (income statement and balance sheet) for Home Designs Ltd., and the analysis of its financial performance. It demonstrates the application of inventory costing methods (FIFO, LIFO, and weighted average) to determine the cost of goods sold and gross profit. Ratio analysis is performed for three companies to evaluate profitability and liquidity, and the use of ratios for investment decisions is explored. The importance of working capital management is identified, and the concept of economic order quantity (EOQ) is explained and calculated. The assignment also examines the afterpay service, considering its benefits and disadvantages. The solution includes calculations, memo, and recommendations, providing a comprehensive overview of the financial concepts covered.
tabler-icon-diamond-filled.svg

Contribute Materials

Your contribution can guide someone’s learning journey. Share your documents today.
Document Page
1
Business Accounting & Finance
tabler-icon-diamond-filled.svg

Secure Best Marks with AI Grader

Need help grading? Try our AI Grader for instant feedback on your assignments.
Document Page
2
Executive summary
The assignment has covered various aspects in relation to the accounts and finances. There is the
making of the financial statements in relation to a company from the available information. By
that, the position and performance of the company are evaluated. The use of cash flow statement
is also identified and taken into consideration. There are three methods which have been used
and by that the cost of the inventory has been ascertained. That has also helped in identifying the
cost of goods sold and the profits which are made under each of the methods. The analyses of the
business are made and for that ratio have been calculated in respect of three companies and it
was done by using their profitability and liquidity. Further the ratios which are to be used for the
making of investment decisions have also been determined. The importance of having working
capital management for the business is identified. With that an explanation of the economic order
quantity is given which helps in understanding the concept in effective manner. The calculations
for the same have also been performed. The after pay service, which is offered is also understood
and the benefits and disadvantages associated with it have also been taken into consideration.
Document Page
3
Table of Contents
Executive summary.........................................................................................................................2
Question 1........................................................................................................................................4
i)...................................................................................................................................................4
ii)..................................................................................................................................................5
Question 2........................................................................................................................................6
i)...................................................................................................................................................6
ii)................................................................................................................................................11
Question 3......................................................................................................................................12
i).................................................................................................................................................12
ii)................................................................................................................................................12
iii)...............................................................................................................................................13
Question 4......................................................................................................................................13
i).................................................................................................................................................13
ii)................................................................................................................................................14
iii)...............................................................................................................................................16
Conclusion and recommendations.................................................................................................17
References......................................................................................................................................18
Document Page
4
Question 1
i)
Income statement of Home designs ltd
For the year ending 30 June 2019
Particulars Amount
Sales revenue 2,205,000
Interest income 3,100
Total income 2,208,100
Cost of goods sold 780,000
Gross profit 1,428,100
Advertising expense 46,000
Annual leave expense 25,000
Depreciation expense 60,000
Dividends paid 200,000
Doubtful debts expense 2,000
Income tax expense 274,000
Interest expense 22,000
Other expenses 36,000
Salaries and wages 286,000
Warranty expense 41,000
Total expenses 992,000
Net profit 436,100
Balance sheet of Home designs ltd
As at 30 June 2019
Particulars Amount Amount
Current assets:
Bank account 143,000
Finished goods inventory 322,000
Raw materials inventory 126,000
Trade receivables 183,400 774,400
tabler-icon-diamond-filled.svg

Secure Best Marks with AI Grader

Need help grading? Try our AI Grader for instant feedback on your assignments.
Document Page
5
Non-current assets:
Buildings 780,000
Land 609,000
Plant and equipment 860,000 2,249,000
Total assets 3,023,400
Current liabilities:
Accounts payable 56,300
Bank loan 20,000
Current tax liability 274,000
Provision for annual leave 23,000
Provision for warranty 34,000 407,300
Non-current liabilities:
Bank loan 180,000 180,000
Total Liabilities 587,300
Net assets 2,436,100
Equity
Share capital 2,000,000
Net profit 436,100
Total equity 2,436,100
ii)
Memo
From:
To: The directors of Home Designs Ltd
Date: 25 August 2019
Subject: the purpose of the statement of cash flows
The cash flow statement is also part of the financial statement of an entity and is prepared to
measure the cash performance of the company. In this all the transactions related to cash for
Document Page
6
particular periods are recorded (Williams & Dobelman, 2017). The main purpose of this
statement is to provide the audience with the data in relation to the cash receipts, payments and
net change which has taken place. This is the report which is classified into three sections which
include the cash from operating, investing and financing activities (Gupta et al., 2014). The
overall knowledge about the cash position of the company will be attained with the help of this.
This statement is different from the income statement and balance sheet as in them all the
information about the assets, liabilities, income, and expenses are entered whether they are in
cash or non-cash form. In contrast to this the cash flow statement covers only the cash related
transactions. In balance sheet the final balances are shown whereas cash flow involves the
changes which have occurred in the year (Call et al., 2013). By the help of cash flow only cash
position of the business will be accessed but by other statements the overall financial position of
the company is taken into account.
Question 2
i)
FIFO method
Date Purchase Sales Balance
Particular Uni
ts
Rat
e
Amou
nt
Unit
s
Rat
e
Amount Unit Rate Amou
nt
1-Jul Opening
inventory
20 120
0
24000 20 1200 24000
5-Jul Purchase 4 125
0
5000 20 1200 24000
4 1250 5000
8-Jul Sales 6 290
0
17400 14 1200 16800
4 1250 5000
11-Jul Sales 2 290
0
5800 12 1200 14400
4 1250 5000
Document Page
7
20-
Jul-19
Purchase 5 123
0
6150 12 1200 14400
4 1250 5000
5 1230 6150
4-Aug Sales 4 295
0
11800 8 1200 9600
4 1250 5000
5 1230 6150
7-Aug Sales 8 295
0
23600 4 1250 5000
5 1230 6150
20-
Aug
Purchase 10 126
0
12600 4 1250 5000
5 1230 6150
10 1260 12600
27-
Aug
Sales 2 295
0
6150 2 1250 2500
5 1230 6150
10 1260 12600
5-Sep Sales 6 299
0
17940 1 1230 1230
10 1260 12600
12-
Sep
Sales 2 299
0
5980 9 1260 11340
16-
Sep
Purchase 12 130
0
15600 9 1260 11340
12 1300 15600
26-
Sep
Sales 3 299
0
8970 6 1260 7560
12 1300 15600
51 63350 33 97640 18 23160
tabler-icon-diamond-filled.svg

Paraphrase This Document

Need a fresh take? Get an instant paraphrase of this document with our AI Paraphraser
Document Page
8
Calculation of cost of goods sold
and gross profit
Particulars Amount
Sales 97640
Cost of goods sold:
Opening stock +
purchases
63350
Less: Closing stock 23160
Cost of goods sold 40190
Gross profit 57450
LIFO Method
Date Purchase Sales Balance
Particular Uni
ts
Rat
e
Amou
nt
Unit
s
Rat
e
Amount Unit Rate Amou
nt
1-Jul Opening
inventory
20 120
0
24000 20 1200 24000
5-Jul Purchase 4 125
0
5000 20 1200 24000
4 1250 5000
8-Jul Sales 6 290
0
17400 18 1200 21600
11-Jul Sales 2 290
0
5800 16 1200 19200
20-
Jul-19
Purchase 5 123
0
6150 16 1200 19200
5 1230 6150
4-Aug Sales 4 295
0
11800 16 1200 19200
1 1230 1230
Document Page
9
7-Aug Sales 8 295
0
23600 9 1200 10800
20-
Aug
Purchase 10 126
0
12600 9 1200 10800
10 1260 12600
27-
Aug
Sales 2 295
0
6150 9 1200 10800
8 1260 10080
5-Sep Sales 6 299
0
17940 9 1200 10800
2 1260 2520
12-
Sep
Sales 2 299
0
5980 9 1200 10800
16-
Sep
Purchase 12 130
0
15600 9 1200 10800
12 1300 15600
26-
Sep
Sales 3 299
0
8970 9 1200 10800
9 1300 11700
51 63350 33 97640 18 22500
Calculation of cost of goods sold
and gross profit
Particulars Amount
Sales 97640
Cost of goods sold:
Opening stock +
purchases
63350
Less: Closing stock 22500
Cost of goods sold 40850
Gross profit 56790
Document Page
10
Weighted average method
Date Purchase Sales Balance
Particular Uni
ts
Ra
te
Amo
unt
Uni
ts
Ra
te
Amou
nt
Un
it
Rate Amo
unt
Averag
e rate
1-Jul Opening
inventory
20 12
00
2400
0
20 1200 2400
0
5-Jul Purchase 4 12
50
5000 20 1200 2400
0
4 1250 5000 1208.33
3
8-Jul Sales 6 290
0
17400 18 1208.3
3
2175
0
11-
Jul
Sales 2 290
0
5800 16 1208.3
3
1933
3.3
20-
Jul-
19
Purchase 5 12
30
6150 16 1208.3
3
1933
3.3
5 1230 6150 1213.49
2
4-
Aug
Sales 4 295
0
11800 17 1213.4
9
2062
9.4
7-
Aug
Sales 8 295
0
23600 9 1213.4
9
1092
1.4
20-
Aug
Purchase 10 12
60
1260
0
9 1213.4
9
1092
1.4
10 1260 1260
0
1237.96
9
27-
Aug
Sales 2 295
0
6150 17 1237.9
7
2104
5.5
5-
Sep
Sales 6 299
0
17940 11 1237.9
7
1361
7.7
tabler-icon-diamond-filled.svg

Secure Best Marks with AI Grader

Need help grading? Try our AI Grader for instant feedback on your assignments.
Document Page
11
12-
Sep
Sales 2 299
0
5980 9 1237.9
7
1114
1.7
16-
Sep
Purchase 12 13
00
1560
0
9 1237.9
7
1114
1.7
12 1300 1560
0
1273.41
6
26-
Sep
Sales 3 299
0
8970 18 1273.4
2
2292
1.5
51 6335
0
33 97640 18 2292
1.5
Calculation of cost of goods sold
and gross profit
Particulars Amount
Sales 97640
Cost of goods sold:
Opening stock +
purchases
63350
Less: Closing stock 22921.48
Cost of goods sold 40428.52
Gross profit 57211.48
ii)
To,
Director
The identification of the cost of inventory is done by using various methods which are available
(Nisha, 2015). In that, there is a different concept which is used and the best position will be
reflected by the weighted average method. By the help of this the cost of various categories of
inventory is taken on the basis of the weights provided to them (Krishnan & Lin, 2012). The
answers which will be attained with the help of this are most reliable and used in the long term.
Document Page
12
The LIFO method will be best for the income tax purpose as in that there is the least income
which is calculated and so the amount of the tax which will have to be paid will also be lower
(Tenovici, 2012). This will be saving the income of the company which they can use for any
other purpose as the tax saving will be involved.
Question 3
i)
Calculation of ratios
Particulars Formula Accor Marriott Mantra
Return on total
assets
Net income/Total assets
*100
2.01% 4.22% 0.98%
Return on equity Net income/Total equity
*100
3.62% 14.62% 1.39%
Debt to equity total debt/ Total equity 0.80 2.46 0.42
ii)
The calculation of the ratios is performed in the above part and that represents the position of the
companies. It can be noted that in terms of profitability the Marriott is performing best as it is
having the highest rate of return on total assets and equity. After this Accor maintains the
position and at last is the mantra (Babalola & Abiola, 2013). If liquidity is to be considered then
Mantra is having the best position as it has the least debt to equity ratio of 0.42. This shows that
the company has the least obligation which is required to be met by them in every period.
Overall the position of Accor can be said to be appropriate with the limited return and average
debt ratio.
iii)
As an investment, the main focus is on the profitability of the business as if the company will be
having higher earnings then it will be able to pay the dividends. It can be seen that although the
debt-equity ratio of Marriott is high then also it is maintaining the high profitability (Williams &
Document Page
13
Dobelman, 2017). This shows that it will be able to cover all the expenses in an effective manner
and after that also will be providing the returns to the investors.
In addition to them, there are various other ratios also which will be used in the making of
decisions and they include the net profit margin, price to earnings ratio and dividend yield. By
the help of them there will be undertaking of the best decision which will be made. The net profit
margin will be evaluating the profitability of the business and with that it will be ensured that the
company will be able to make the payments to the investors or not. The price to earnings ratio
will be proving the relationship between the price of the share and its related earning (Uechi et
al., 2015). It will be helping in decision making as the amount invested and the return which will
be made can be compared by this. The dividend yield provides the dividend which is received by
the investors and as that is the main interest of the investors. This will be helping in making the
proper decision for the investment which is required to be made.
Question 4
Introduction
In this report, the aspects in relation to the working capital management will be discussed. There
will be identification of the importance of the same for the small businesses. The calculations for
the determination of the economic order quantity will also be made for Caleb. The concept of
after pay will also be used and all the merits and demerits in relation to the same will be
determined.
i)
The capital is required to be managed in all the business and so is the case with the small
businesses. For the carrying out of the operations in the business in an effective manner it is
required that working capital shall be managed in most effective manner (Ebenezer & Asiedu,
2013). It is required to ensure sustainable growth and if the money will not be available then the
day to day operations will be affected in adverse manner. By that the production and profitability
of the business will be negatively impacted. The long term stability will come under risk by this
as targets which are set for the short term will not be completed.
tabler-icon-diamond-filled.svg

Paraphrase This Document

Need a fresh take? Get an instant paraphrase of this document with our AI Paraphraser
Document Page
14
The working capital is the amount which is required to run the business in an effective manner
on a daily basis. The calculation of this is made by deducting the current liabilities from the
current assets. It is required to be managed by which the liquidity is maintained and the assets
can be converted into cash in the time of requirements (Kasiran et al., 2016). By that the
obligations will be met on time and also the operations of the daily routine will be carried
appropriately.
The credit score is improved as the revenues are generated and debts will be paid on a regular
basis. It increases the efficiency of the business in situations of emergencies. The business is able
to deal with them as the cash is available or assets are there which can be converted into cash at
any point of time. The financing conditions are favorable as the relation with the creditors is
maintained in good manner. This ensures the availability of finances in time of need in the
coming period.
ii)
Economic order quantity is the model by the help of which the units which are required to be
ordered by the company to get the maximum benefits will be determined. This will be
identifying such units which will be reducing the cost that is incurred on the orders. The costs
which are covered in this method involve order cost, holding cost and shortage cost. This is the
continuous process by which review is made to maintain the appropriate level of inventory. The
monitoring is done all time and the once the reorder level is reached there will be an order which
will be placed for a specific quantity (Teng et al., 2012). By this model, the point at which order
shall be placed and the quantity for which order is to be made will be ascertained. By the help of
this the issue of the shortage and excessive stock is solved and the cost which is incurred in these
cases is saved.
Under this model, it is considered that the demand in the market will remain constant and there is
depletion in the value of the inventory and will continue until the value reaches zero. The
holding cost will be involved if more quantity is ordered and to avoid that cost this model is
taken into consideration. There is the relation that exists among all the elements which are
involved in this model and it shall be understood in proper manner.
Document Page
15
Caleb will also be using this model as by the help of this the quantity which shall be ordered will
be determined. He will be able to increase the profitability by using this model as the saving in
the ordering and storage cost will be made which is essential to maintain the profitability
(Taleizadeh & Pentico, 2014). There is a formula which is used for this purpose and is as
follows:
In this,
Q = EOQ
S = Order cost per order
D = Demand in units
H = Holding cost per unit
This formula will be used and with that effective calculation will be made to identify the
optimum number of units which are to be ordered.
Particulars Amount
Annual demand 1350
Ordering cost 250
Purchase cost 480
Carrying cost 30
EOQ 22500
EOQ (in units) 150
The units which are required to be ordered by Caleb are 150 units. The total purchasing cost for
the various quantities of orders are as follows:
Particulars 150 450 675
Ordering cost 37500 112500 168750
Document Page
16
Carrying cost 4500 13500 20250
Purchasing cost 72000 216000 324000
Total cost 114000 342000 513000
iii)
After pay is the technique which is used in Australia and according to it the buyers have the
option to purchase the goods and make the payment for the same in four-fortnight installments.
All retailers who are offering this service are required to a merchant fee in exchange for the
payment which is immediately received by them. The merchants who are using this service will
be required to pay the merchant fee of 4.17% on all the sales which are being undertaken by this
platform. If any customer pays the amount late then there will be late fees which will also be
charged and that will also be identified to be the income of the company.
The benefits of using After pay is that these new customers will be attracted and incremental
sales will be made with the help of this. The customers who would have avoided the purchase
due to the lack of money will be attracted and this way the sales will be increased (Canstar,
2017). The customers who use this service for once will use this more often and this will increase
the overall sales for the company and the earnings which will be made by the sales. The interest
which is charged by other banks for the credit service is not charged by the after pay and this will
be saving the cost of the customers.
The main demerits of the after pay involve the impulse spending which is made by the customer
due to this service. There is the late fee which is charged from the customers if they delay in
making payment. There is a credit check which is required to be passed for this and this creates a
restriction for many consumers who are willing to use this service.
Conclusion and recommendations
In this assignment, there are various aspects which have been discussed and for that the
calculations have been made. The income statement and balance sheet have been prepared by
which the financial position of the business is ascertained. The use of the cash flow is also taken
into consideration. The inventory value is determined with the help of various methods which are
tabler-icon-diamond-filled.svg

Secure Best Marks with AI Grader

Need help grading? Try our AI Grader for instant feedback on your assignments.
Document Page
17
available and by that the best among all is identified. There are calculations which are
represented for the same and the decision is made on that basis. The ratio analysis is also
performed for various companies and by that position of all of them is compared. Further the
decision in respect of the investment to be made is taken. The working capital management and
its importance are identified and with that the calculation for the EOQ id also made. From all this
it can be recommended that all the business shall prepared the financial accounts for the
measurement of the performance and position of business. The inventory should be valued by
using the best-identified method and also the ratios will be used for the comparison and decision
making in business. The orders will be made at the EOQ and by that cost will be minimized and
there will be saving which will be made possible.
Document Page
18
References
Babalola, Y. A., & Abiola, F. R. (2013). Financial ratio analysis of firms: A tool for decision
making. International journal of management sciences, 1(4), 132-137.
Call, A. C., Chen, S., & Tong, Y. H. (2013). Are analysts' cash flow forecasts naïve extensions
of their own earnings forecasts?. Contemporary Accounting Research, 30(2), 438-465.
Canstar. (2017). Pros and Cons of After pay. Retrieved from:
https://www.canstar.com.au/online-banking/pros-and-cons-of-afterpay/
Ebenezer, A. B., & Asiedu, M. K. (2013). The Relationship Between Working Capital
Management and Profitablity of Listed Manufacturing Companies in
Ghana. International Journal of Business and Social Research, 3(2), 25-34.
Gupta, J., Wilson, N., Gregoriou, A., & Healy, J. (2014). The value of operating cash flow in
modeling credit risk for SMEs. Applied Financial Economics, 24(9), 649-660.
Kasiran, F. W., Mohamad, N. A., & Chin, O. (2016). Working Capital Management Efficiency:
A Study on the Small Medium Enterprise in Malaysia. Procedia Economics and
Finance, 35, 297-303.
Krishnan, S., & Lin, P. (2012). Inventory Valuation Under IFRS and GAAP: this article is based
on a study supported by the IMA [R] research foundation. Strategic Finance, 93(9), 51-
59.
Nisha, N. (2015). Inventory valuation practices: A developing country perspective. International
Journal of Information Research and Review, 2(7), 867-874.
Taleizadeh, A. A., & Pentico, D. W. (2014). An economic order quantity model with partial
backordering and all-units discount. International Journal of Production Economics, 155,
172-184.
Teng, J. T., Min, J., & Pan, Q. (2012). Economic order quantity model with trade credit
financing for non-decreasing demand. Omega, 40(3), 328-335.
Document Page
19
Tenovici, C. O. (2012). Accounting policies and options on the recognition, measurement, and
derecognition of inventories in public sector entities. Anale. Seria Ştiinţe Economics.
Timişoara, 18, 185-192.
Uechi, L., Akutsu, T., Stanley, H. E., Marcus, A. J., & Kenett, D. Y. (2015). Sector dominance
ratio analysis of financial markets. Physica A: Statistical Mechanics and its
Applications, 421, 488-509.
Williams, E. E., & Dobelman, J. A. (2017). Financial statement analysis. World Scientific Book
Chapters, 109-169.
Williams, E. E., & Dobelman, J. A. (2017). Financial statement analysis. World Scientific Book
Chapters, 109-169.
chevron_up_icon
1 out of 19
circle_padding
hide_on_mobile
zoom_out_icon
logo.png

Your All-in-One AI-Powered Toolkit for Academic Success.

Available 24*7 on WhatsApp / Email

[object Object]