FIN20002 Finance Assignment: Equity, WACC, and Risk Analysis
VerifiedAdded on  2022/08/13
|13
|1744
|21
Homework Assignment
AI Summary
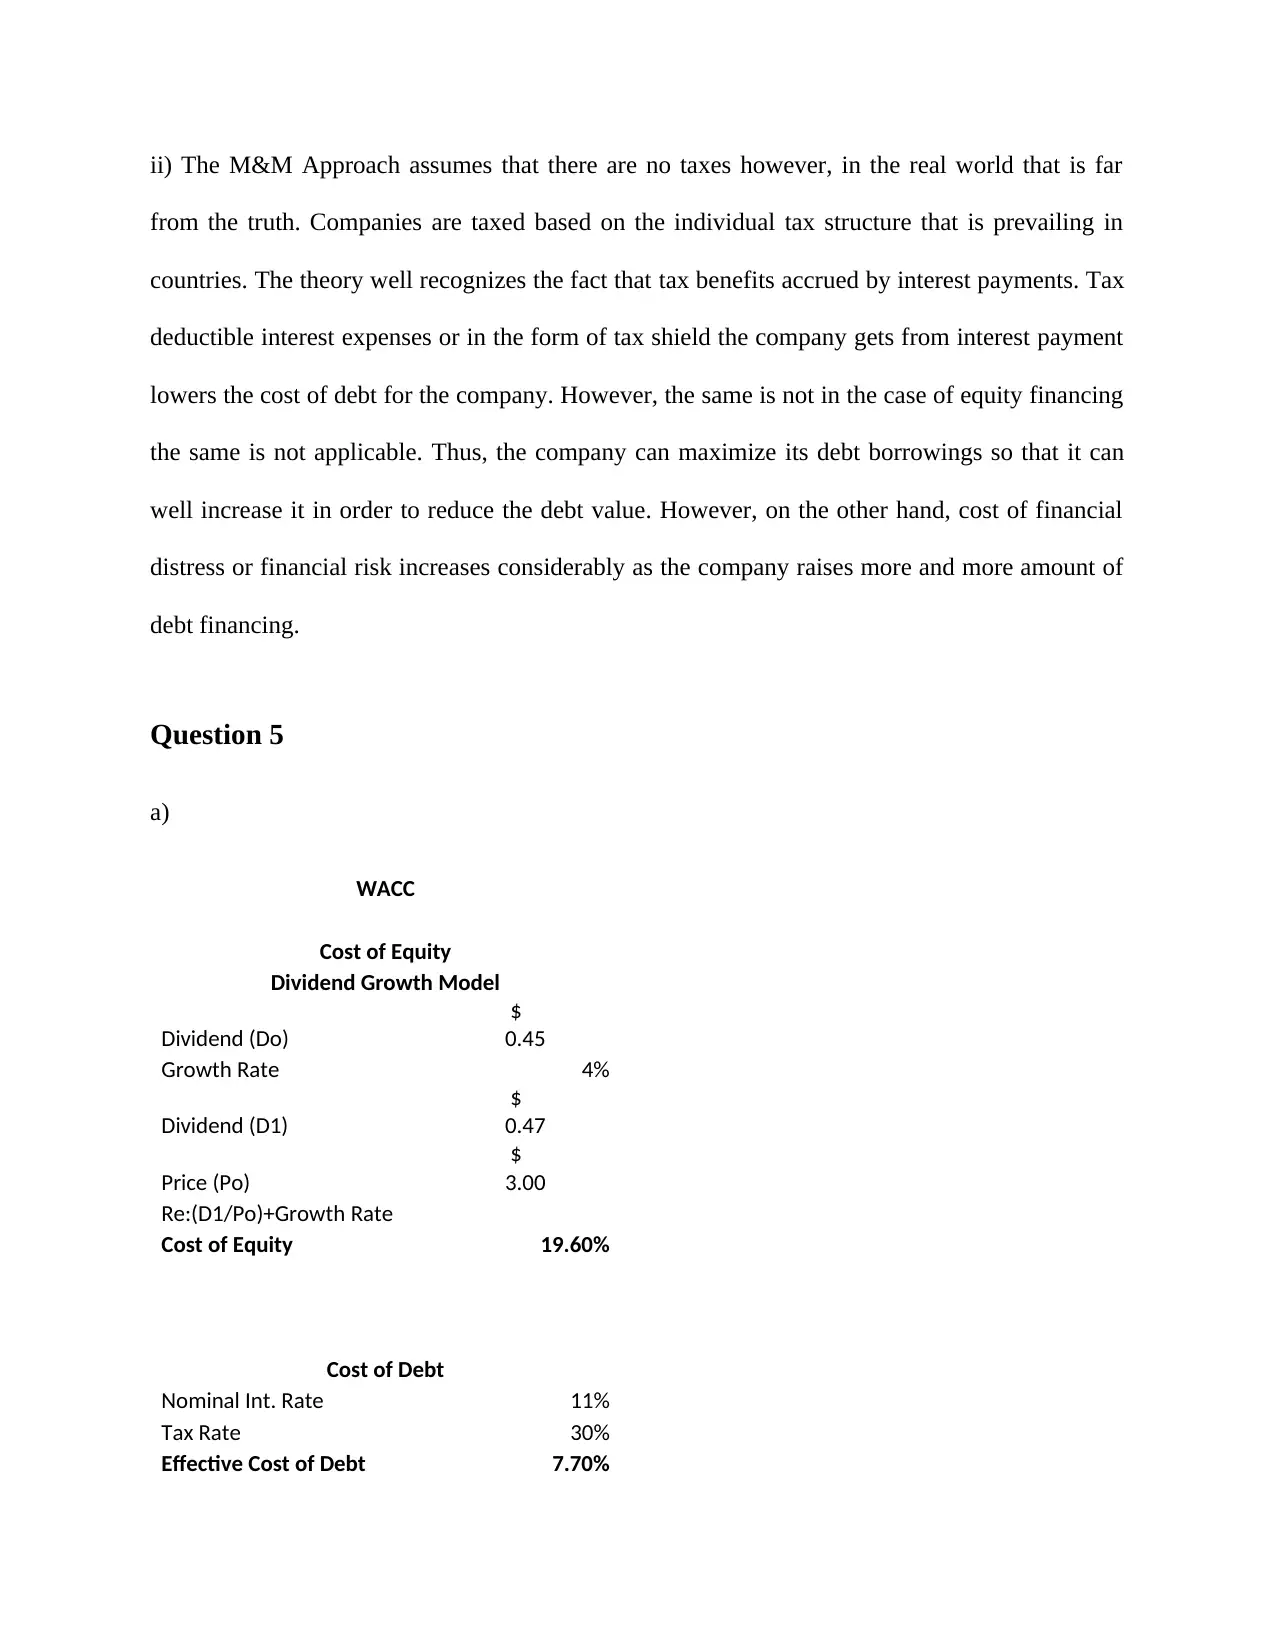
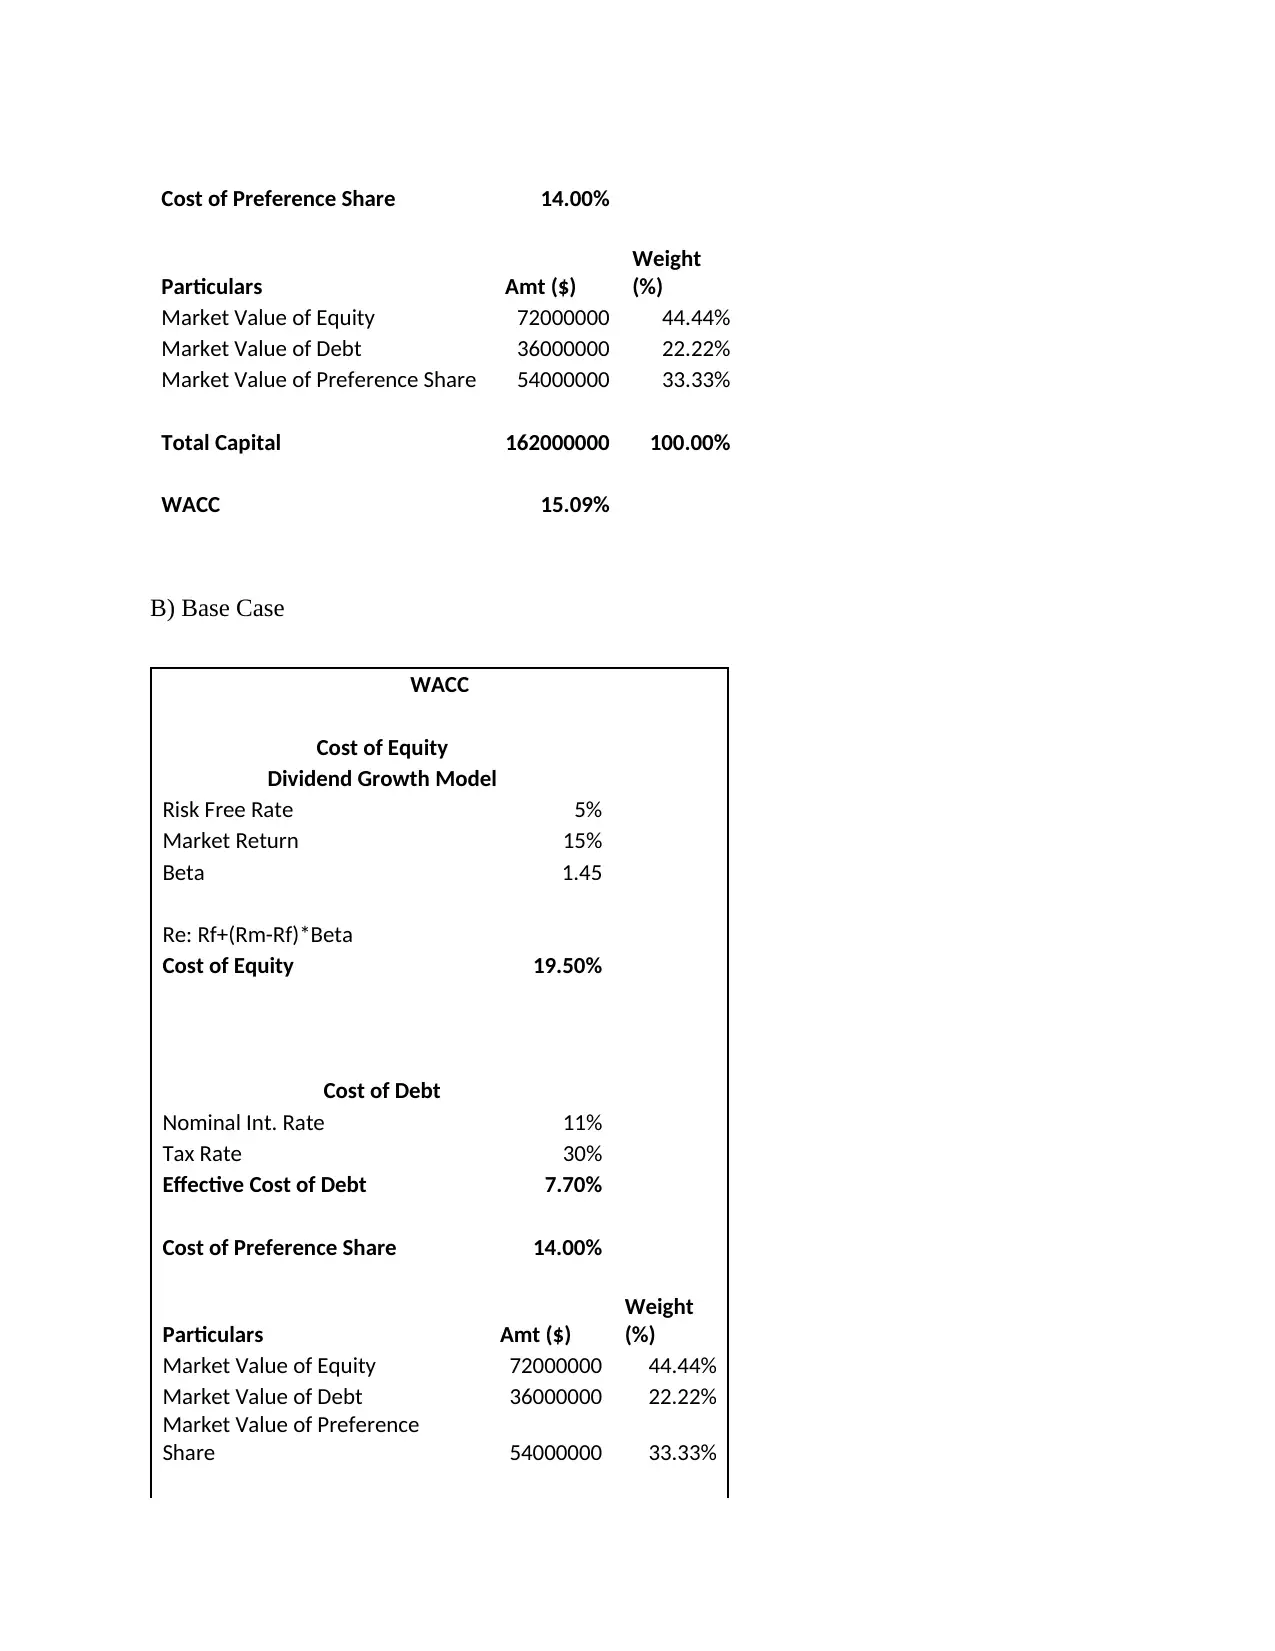
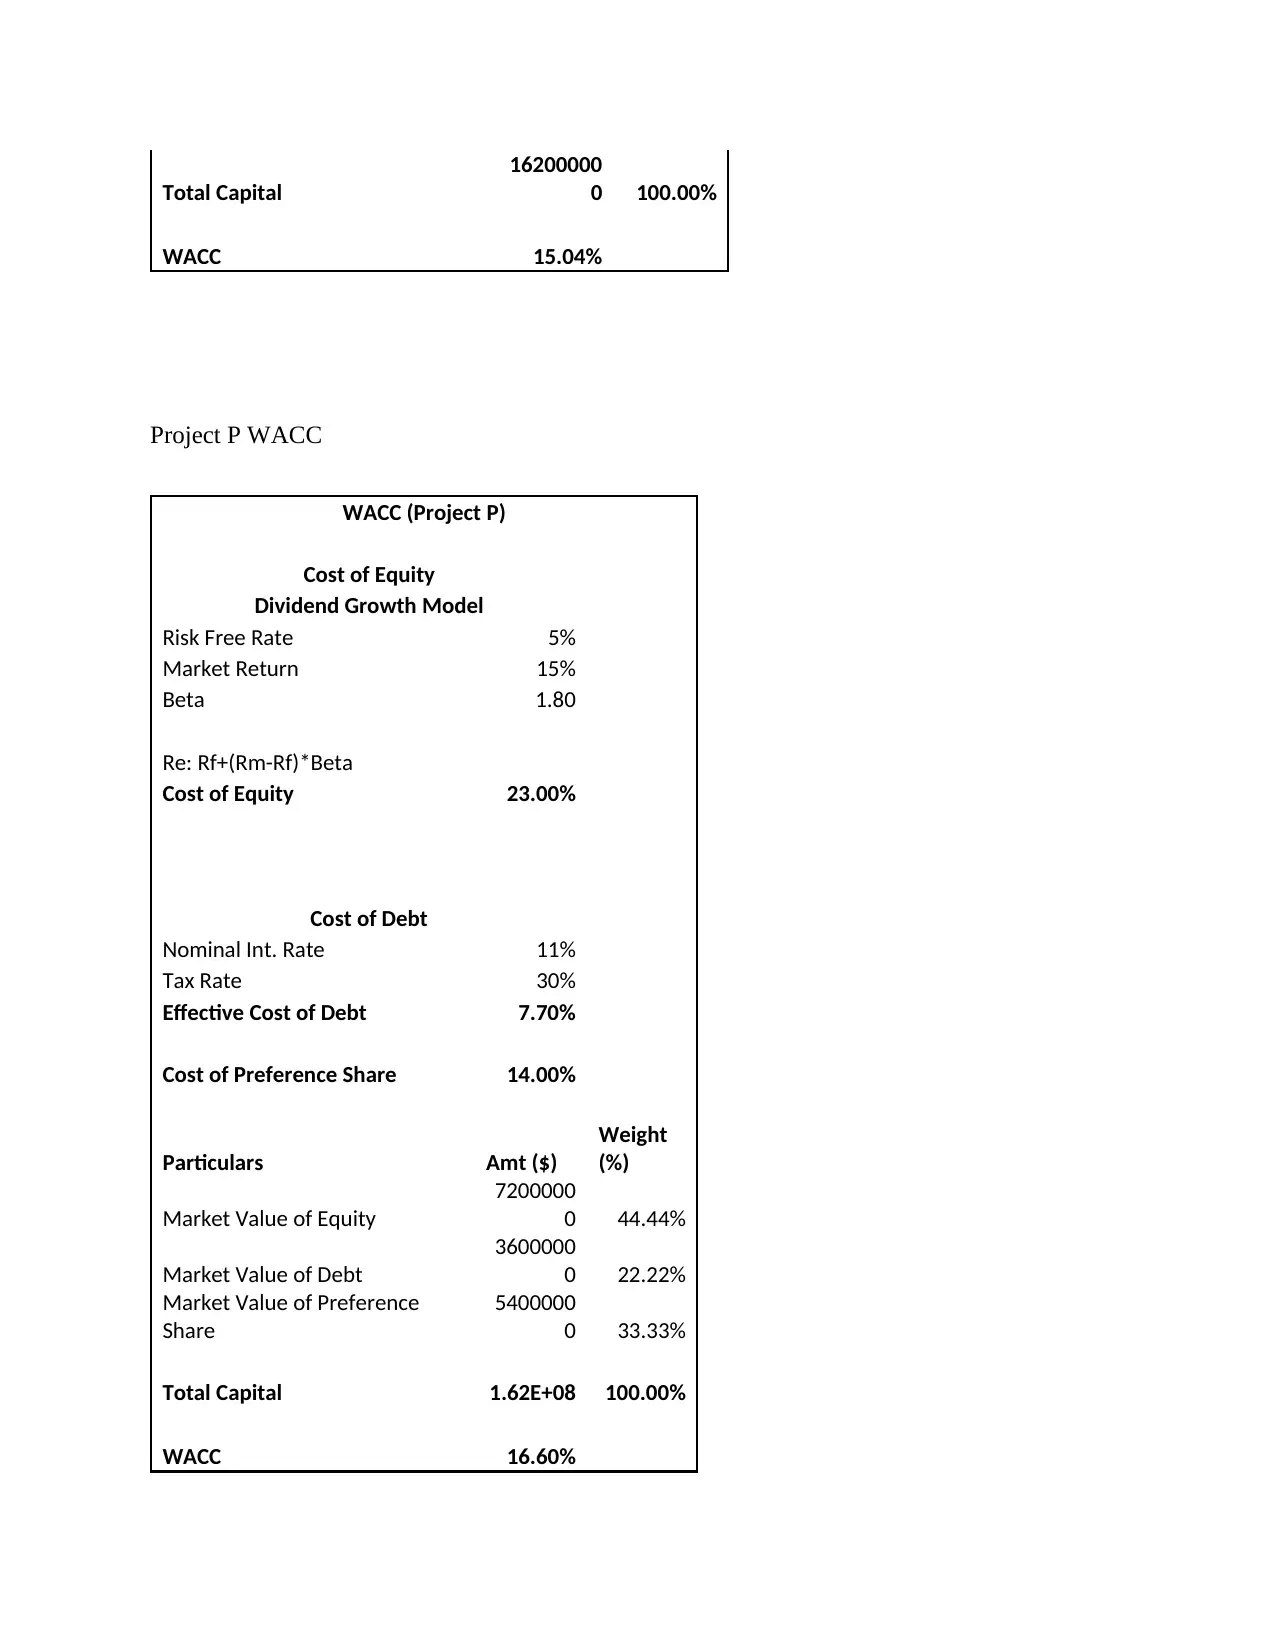
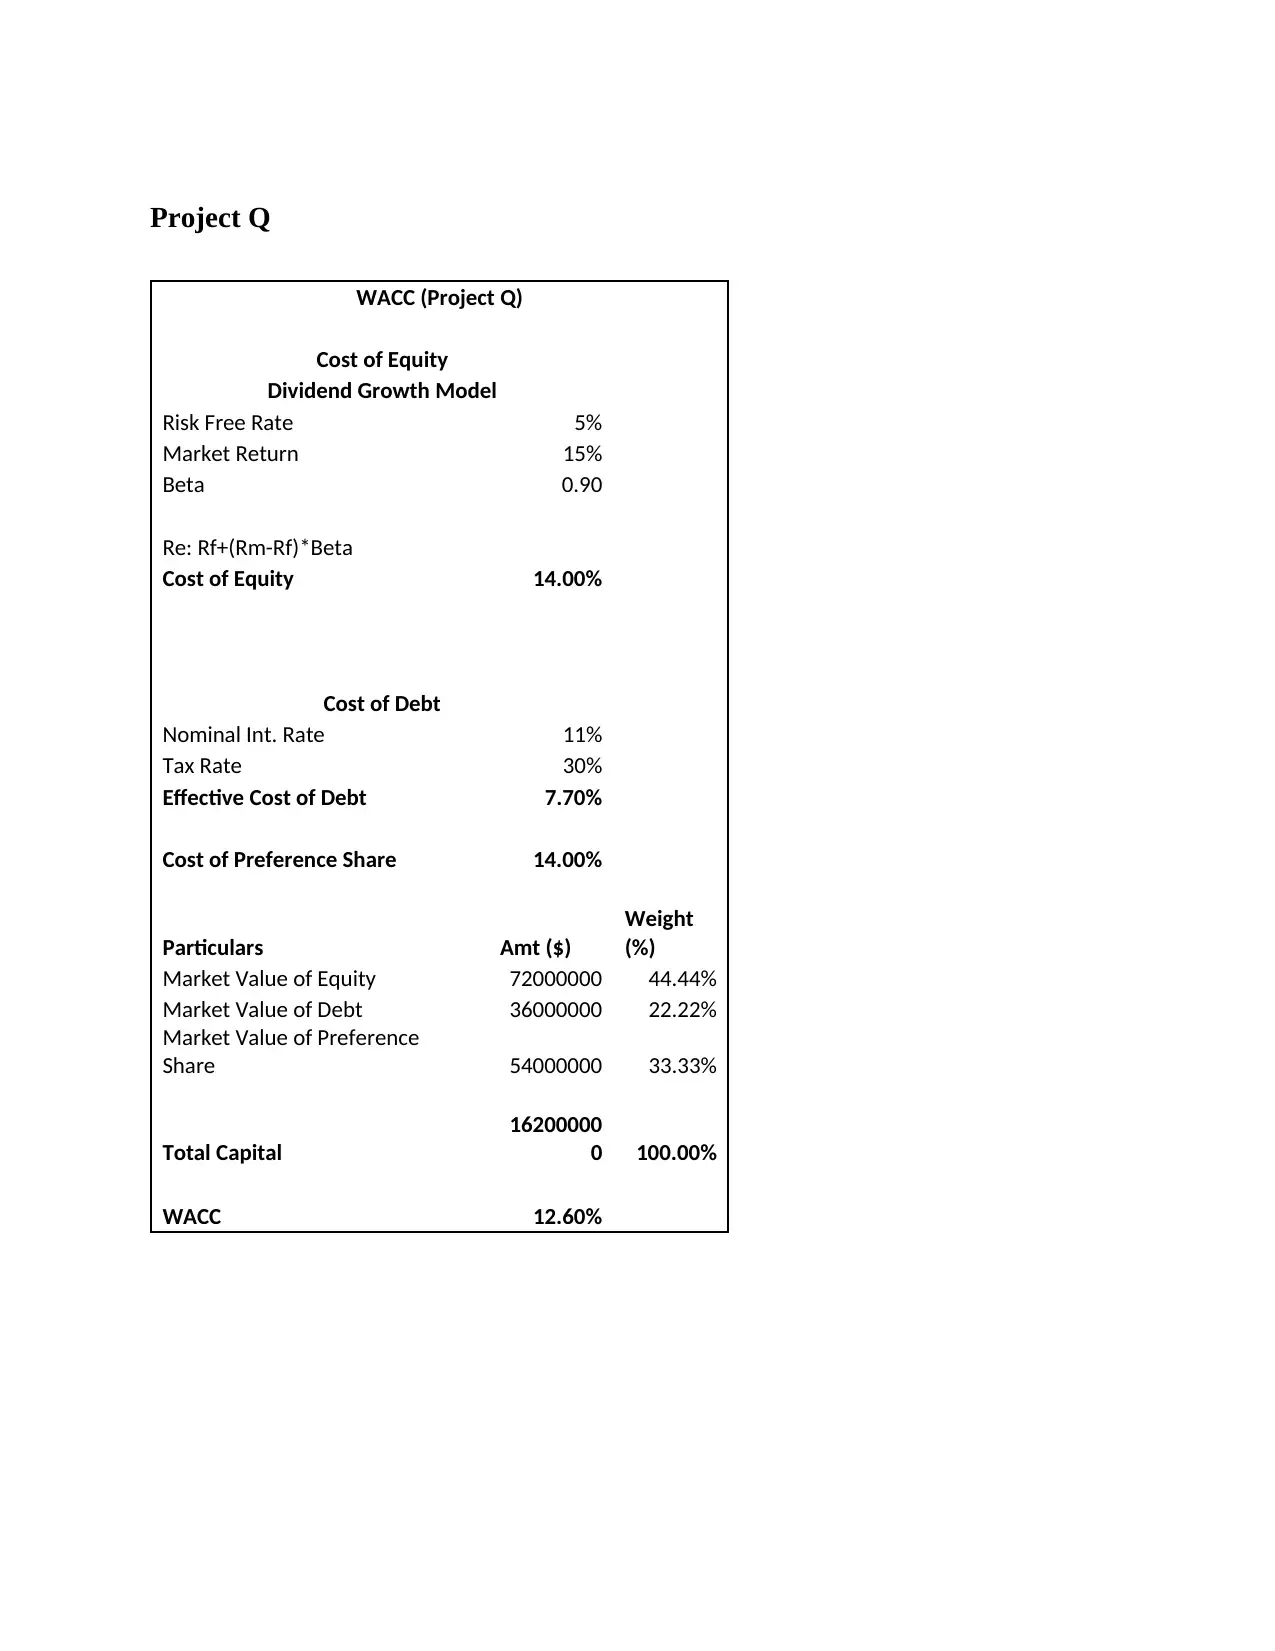
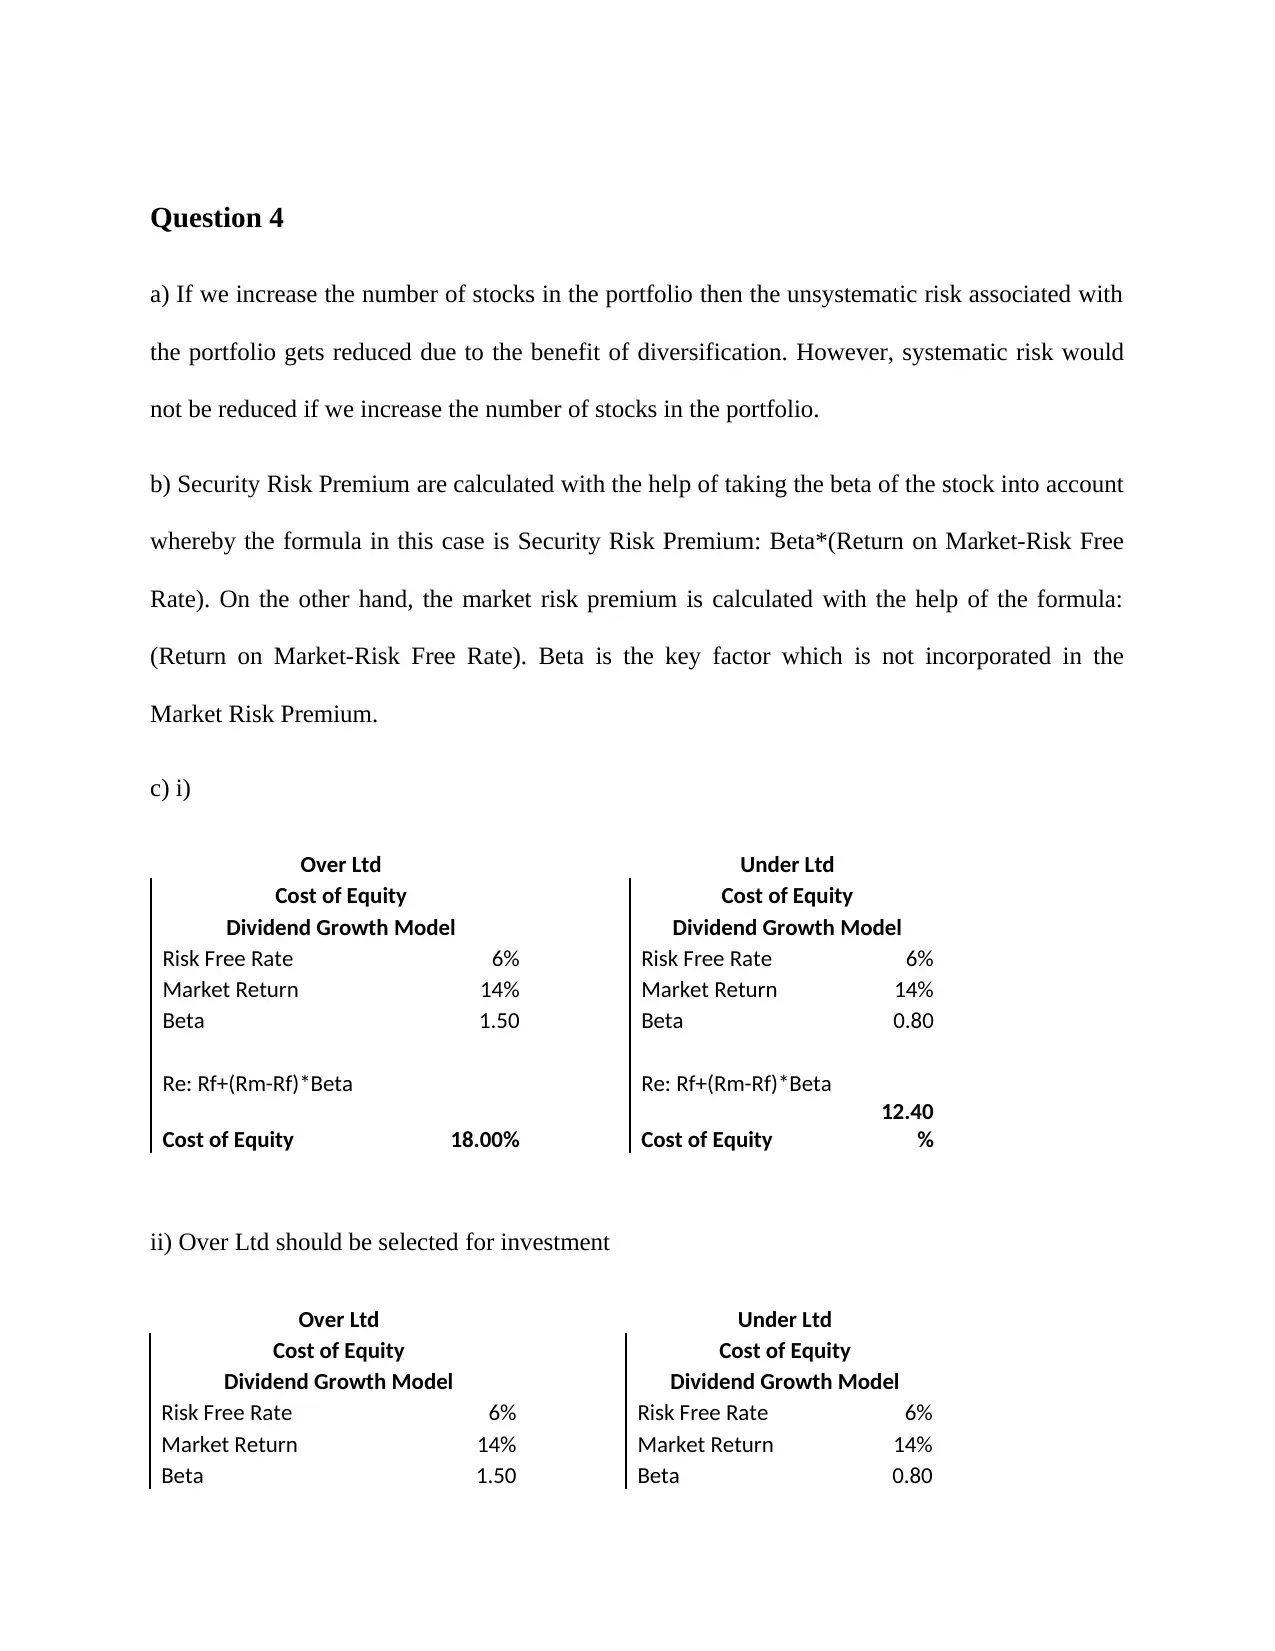
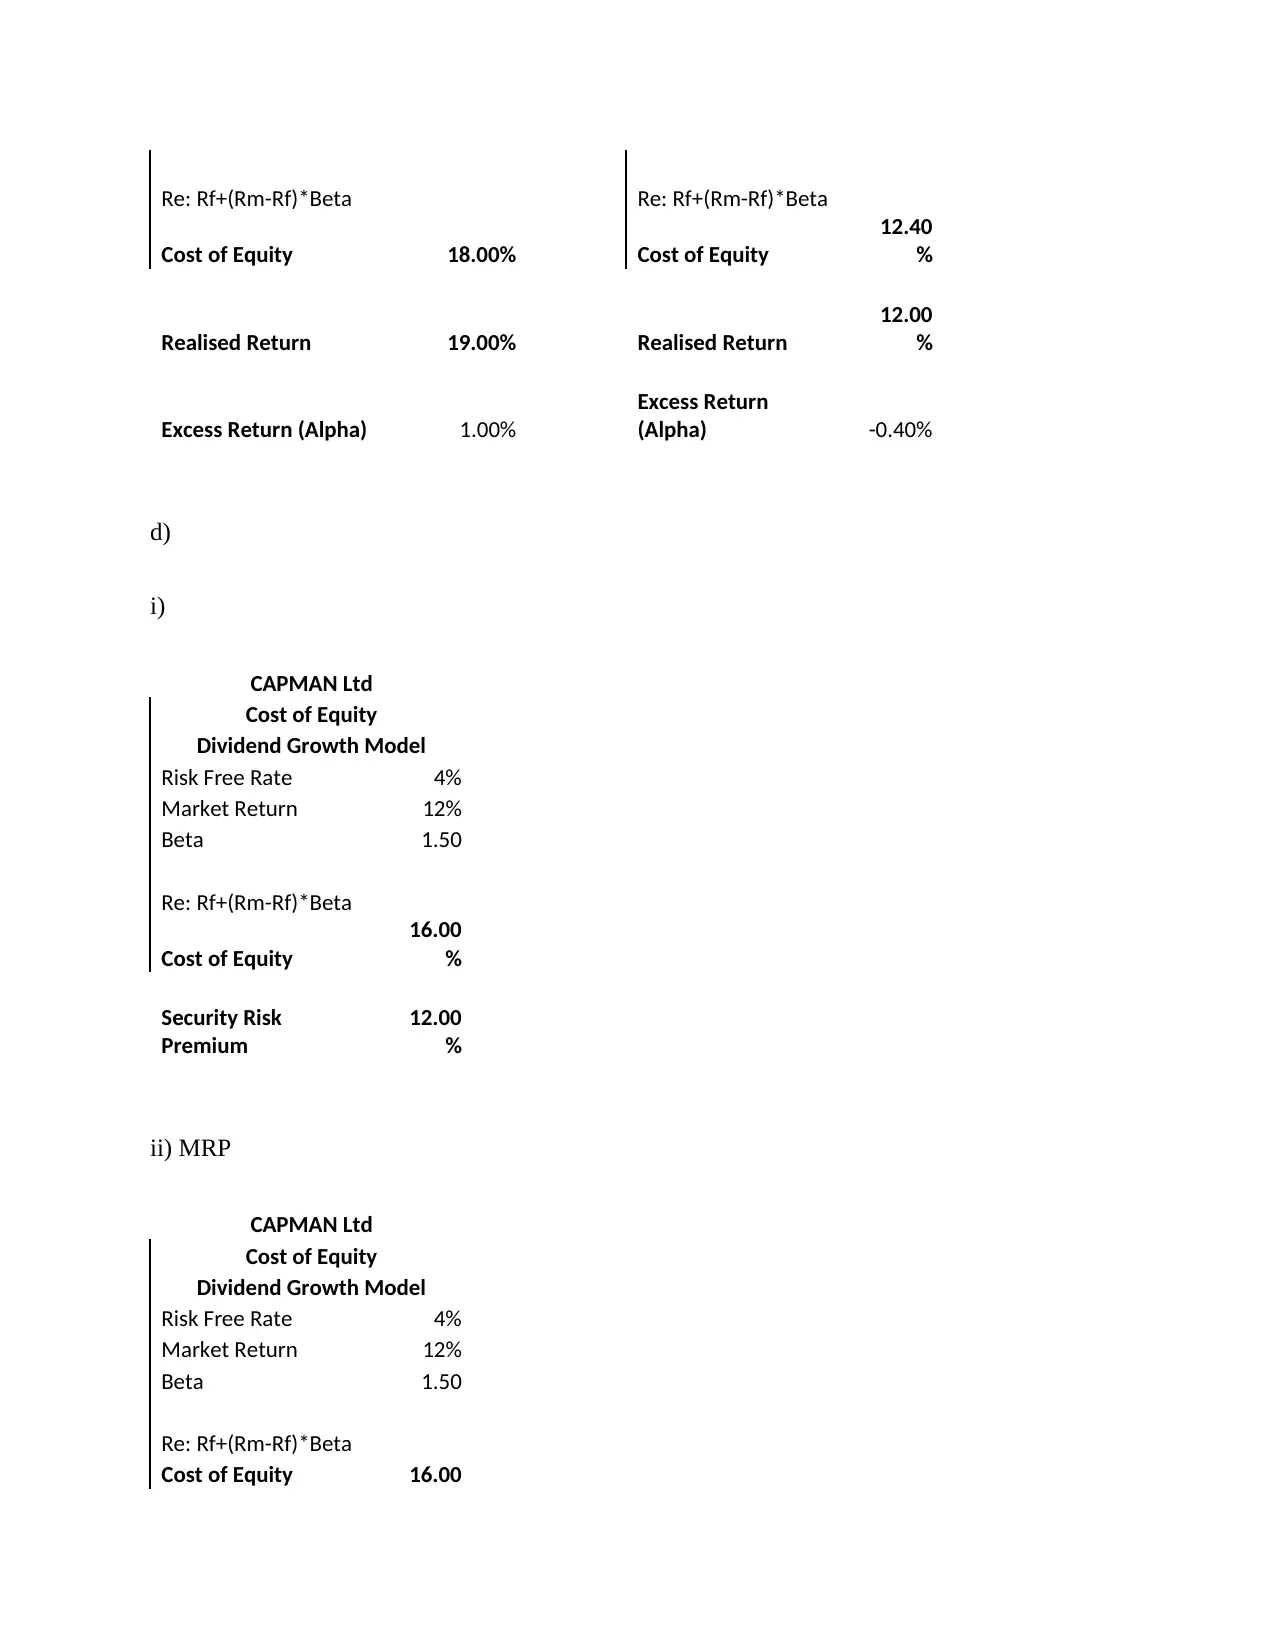
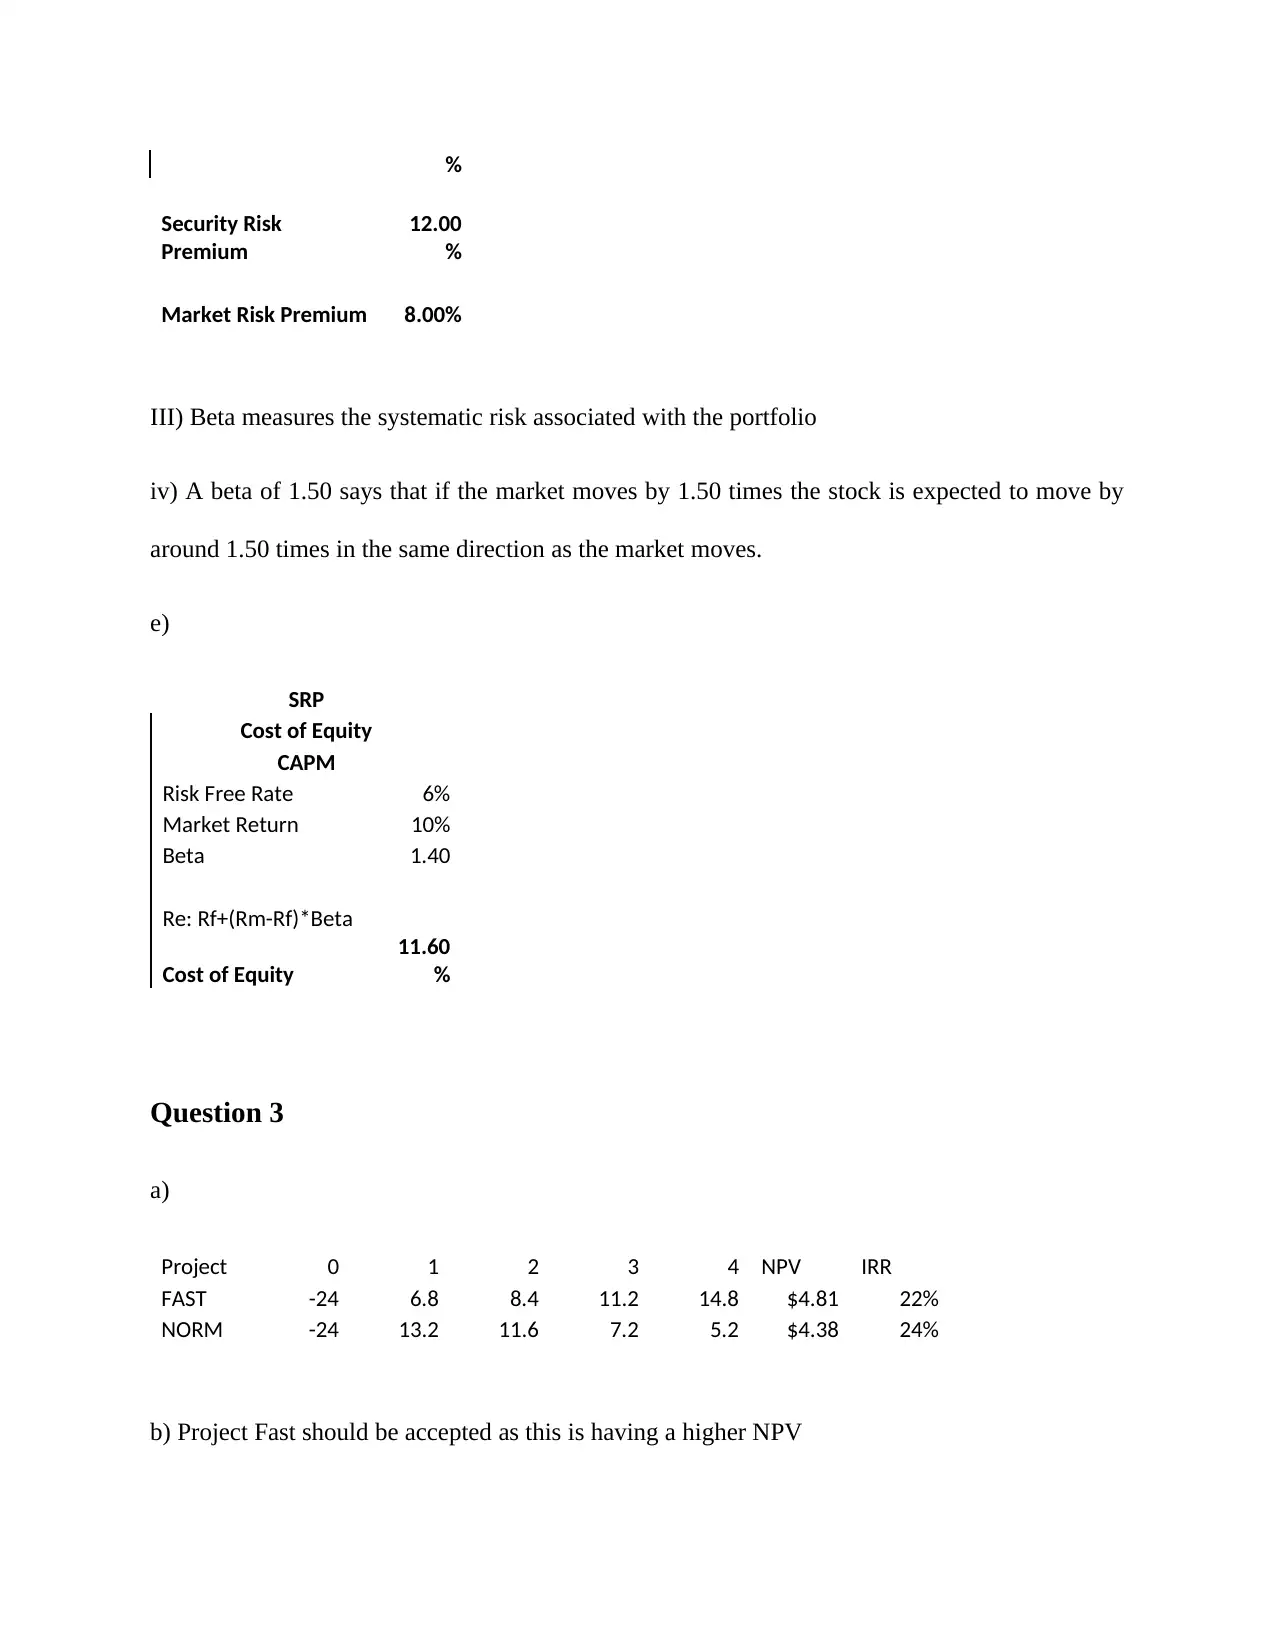
This document presents a comprehensive solution to a finance assignment, addressing key concepts in financial management. The solution begins with an analysis of equity finance, exploring sources like private placements, venture capital, and business angels, while also calculating right share values. It further delves into valuation techniques, including after-tax cash flow analysis, market value calculations, and the application of the M&M theory in capital structure decisions. The assignment also covers the calculation of the Weighted Average Cost of Capital (WACC) using both the dividend growth model and CAPM, along with the analysis of project-specific WACCs. Furthermore, it tackles risk and return concepts, including portfolio diversification, security risk premiums, and the Capital Asset Pricing Model (CAPM). The solutions include detailed calculations of NPV, IRR, and beta, offering a complete overview of financial analysis for investment and capital structure decisions.

Question 7
a) The two different sources of equity finance that are available with the company for raising
equity finance is through private placement of stocks with the potential investors or the venture
capital firms and even through the Business Angels.
Business Angels: Business Angels are wealthy high net worth individuals that invests in a high
growth business in return for a share in the company. The Business Angels are often referred as
experienced entrepreneurs, who not only support the operations of the company with their
experience and ideas they also provide capital support required for expansion and carrying on
business activities. The key risk involved in tis financing approach will be that the Owners would
not be able to solely enjoy the profitability and growth aspects of the company they have to share
their profit with the Business Angels.
Venture Capital: The venture capital are also known as a private equity financing that are
looking or willing to invest a hefty amount of money for a higher form of return on equity
desired by the venture capitalist. The key risk that the company would be running in this case
would be in the form of pressure on profitability margins and better performance so that the
Venture Capital get their desired amount of return.
b)
i)
Right Share Required
Finance Amount
8,000,00
0
Price of Rights Share 4
Paraphrase This Document
Need a fresh take? Get an instant paraphrase of this document with our AI Paraphraser

Total Number of
Shares
2,000,00
0
ii) Shares Required for Buying Right Share can be well derived with the help of existing shares
the company is having and the new shares that will be issued. In total for every investors having
3 shares will be getting 1 right share. The ratio is 3:1
Shares Required for Buying Right
Share
Existing Shares 6,000,000
New Shares Issued 2,000,000
Share Required 3
iii) Theoretical Ex-Right Share Price
Theoretical Ex-Right Share Price
Current Market Cap
30,000,00
0
Outstanding Shares 6,000,000
Share Price 5
Additional Equity Raised 8,000,000
New Market Cap
38,000,00
0
Outstanding Shares 6,000,000
New Share Price 6.33
iv) Value of Rights Share
Value of Rights Share
New Share Price 6.33
Existing Share Price 5
Value of Right Share 1.33

v) New Value of Bright Ltd
New Value of Bright Ltd
Current Market Cap
30,000,00
0
Additional Equity Raised 8,000,000
Total Value of Bright Ltd
38,000,00
0
Question 6
a) i) Convert Ltd After Tax Cash Flows
Particulars Amount ($)
EBIT 80,000
Interest 0
Tax Rate 30%
Tax Amount 24,000
After Tax Cash Flow 56,000
ii)
Market Value
Growth Rate
Perpetuit
y
After Tax Cash Flow 56,000
Cost of Capital 14%
Value: Cash Flow/Cost of Capital
Value 400,000
iii)
Particulars Amount
⊘ This is a preview!⊘
Do you want full access?
Subscribe today to unlock all pages.

Trusted by 1+ million students worldwide

($)
EBIT 80,000
Interest
(100,000*10%) -10,000
Tax Rate 30%
Tax Amount -24,000
After Tax Cash Flow 46,000
New Market Value
Growth Rate Perpetuity
After Tax Cash Flow 46,000
Cost of Capital 14%
Value: Cash Flow/Cost of Capital
Value 328,571
iv)
New Value of Equity
Market Value 328,571
Less: Debt 100,000
New Value of Equity 228,571
b)
i) The M&M theory approach which well says that with the assumption of no taxes well says that
the capital structure does not affect or influence the valuation of the firm. In other terms it can be
said that the leveraging would not help the company increasing the market value for the
company. The same also suggest that debt holders that are in the company and equity
shareholders both have the same priority in terms of earnings which are split equally. It also says
that with the increase in the debt component in the financing part, the equity shareholders tend to
face or have a higher amount of risk. Hence increase in risk leads to increase in the cost of equity
for the company and the overall cost of capital for the company.
Paraphrase This Document
Need a fresh take? Get an instant paraphrase of this document with our AI Paraphraser

ii) The M&M Approach assumes that there are no taxes however, in the real world that is far
from the truth. Companies are taxed based on the individual tax structure that is prevailing in
countries. The theory well recognizes the fact that tax benefits accrued by interest payments. Tax
deductible interest expenses or in the form of tax shield the company gets from interest payment
lowers the cost of debt for the company. However, the same is not in the case of equity financing
the same is not applicable. Thus, the company can maximize its debt borrowings so that it can
well increase it in order to reduce the debt value. However, on the other hand, cost of financial
distress or financial risk increases considerably as the company raises more and more amount of
debt financing.
Question 5
a)
WACC
Cost of Equity
Dividend Growth Model
Dividend (Do)
$
0.45
Growth Rate 4%
Dividend (D1)
$
0.47
Price (Po)
$
3.00
Re:(D1/Po)+Growth Rate
Cost of Equity 19.60%
Cost of Debt
Nominal Int. Rate 11%
Tax Rate 30%
Effective Cost of Debt 7.70%

Cost of Preference Share 14.00%
Particulars Amt ($)
Weight
(%)
Market Value of Equity 72000000 44.44%
Market Value of Debt 36000000 22.22%
Market Value of Preference Share 54000000 33.33%
Total Capital 162000000 100.00%
WACC 15.09%
B) Base Case
WACC
Cost of Equity
Dividend Growth Model
Risk Free Rate 5%
Market Return 15%
Beta 1.45
Re: Rf+(Rm-Rf)*Beta
Cost of Equity 19.50%
Cost of Debt
Nominal Int. Rate 11%
Tax Rate 30%
Effective Cost of Debt 7.70%
Cost of Preference Share 14.00%
Particulars Amt ($)
Weight
(%)
Market Value of Equity 72000000 44.44%
Market Value of Debt 36000000 22.22%
Market Value of Preference
Share 54000000 33.33%
Particulars Amt ($)
Weight
(%)
Market Value of Equity 72000000 44.44%
Market Value of Debt 36000000 22.22%
Market Value of Preference Share 54000000 33.33%
Total Capital 162000000 100.00%
WACC 15.09%
B) Base Case
WACC
Cost of Equity
Dividend Growth Model
Risk Free Rate 5%
Market Return 15%
Beta 1.45
Re: Rf+(Rm-Rf)*Beta
Cost of Equity 19.50%
Cost of Debt
Nominal Int. Rate 11%
Tax Rate 30%
Effective Cost of Debt 7.70%
Cost of Preference Share 14.00%
Particulars Amt ($)
Weight
(%)
Market Value of Equity 72000000 44.44%
Market Value of Debt 36000000 22.22%
Market Value of Preference
Share 54000000 33.33%
⊘ This is a preview!⊘
Do you want full access?
Subscribe today to unlock all pages.

Trusted by 1+ million students worldwide

Total Capital
16200000
0 100.00%
WACC 15.04%
Project P WACC
WACC (Project P)
Cost of Equity
Dividend Growth Model
Risk Free Rate 5%
Market Return 15%
Beta 1.80
Re: Rf+(Rm-Rf)*Beta
Cost of Equity 23.00%
Cost of Debt
Nominal Int. Rate 11%
Tax Rate 30%
Effective Cost of Debt 7.70%
Cost of Preference Share 14.00%
Particulars Amt ($)
Weight
(%)
Market Value of Equity
7200000
0 44.44%
Market Value of Debt
3600000
0 22.22%
Market Value of Preference
Share
5400000
0 33.33%
Total Capital 1.62E+08 100.00%
WACC 16.60%
Paraphrase This Document
Need a fresh take? Get an instant paraphrase of this document with our AI Paraphraser


Project Q
WACC (Project Q)
Cost of Equity
Dividend Growth Model
Risk Free Rate 5%
Market Return 15%
Beta 0.90
Re: Rf+(Rm-Rf)*Beta
Cost of Equity 14.00%
Cost of Debt
Nominal Int. Rate 11%
Tax Rate 30%
Effective Cost of Debt 7.70%
Cost of Preference Share 14.00%
Particulars Amt ($)
Weight
(%)
Market Value of Equity 72000000 44.44%
Market Value of Debt 36000000 22.22%
Market Value of Preference
Share 54000000 33.33%
Total Capital
16200000
0 100.00%
WACC 12.60%
⊘ This is a preview!⊘
Do you want full access?
Subscribe today to unlock all pages.

Trusted by 1+ million students worldwide

Question 4
a) If we increase the number of stocks in the portfolio then the unsystematic risk associated with
the portfolio gets reduced due to the benefit of diversification. However, systematic risk would
not be reduced if we increase the number of stocks in the portfolio.
b) Security Risk Premium are calculated with the help of taking the beta of the stock into account
whereby the formula in this case is Security Risk Premium: Beta*(Return on Market-Risk Free
Rate). On the other hand, the market risk premium is calculated with the help of the formula:
(Return on Market-Risk Free Rate). Beta is the key factor which is not incorporated in the
Market Risk Premium.
c) i)
Over Ltd Under Ltd
Cost of Equity Cost of Equity
Dividend Growth Model Dividend Growth Model
Risk Free Rate 6% Risk Free Rate 6%
Market Return 14% Market Return 14%
Beta 1.50 Beta 0.80
Re: Rf+(Rm-Rf)*Beta Re: Rf+(Rm-Rf)*Beta
Cost of Equity 18.00% Cost of Equity
12.40
%
ii) Over Ltd should be selected for investment
Over Ltd Under Ltd
Cost of Equity Cost of Equity
Dividend Growth Model Dividend Growth Model
Risk Free Rate 6% Risk Free Rate 6%
Market Return 14% Market Return 14%
Beta 1.50 Beta 0.80
Paraphrase This Document
Need a fresh take? Get an instant paraphrase of this document with our AI Paraphraser

Re: Rf+(Rm-Rf)*Beta Re: Rf+(Rm-Rf)*Beta
Cost of Equity 18.00% Cost of Equity
12.40
%
Realised Return 19.00% Realised Return
12.00
%
Excess Return (Alpha) 1.00%
Excess Return
(Alpha) -0.40%
d)
i)
CAPMAN Ltd
Cost of Equity
Dividend Growth Model
Risk Free Rate 4%
Market Return 12%
Beta 1.50
Re: Rf+(Rm-Rf)*Beta
Cost of Equity
16.00
%
Security Risk
Premium
12.00
%
ii) MRP
CAPMAN Ltd
Cost of Equity
Dividend Growth Model
Risk Free Rate 4%
Market Return 12%
Beta 1.50
Re: Rf+(Rm-Rf)*Beta
Cost of Equity 16.00

%
Security Risk
Premium
12.00
%
Market Risk Premium 8.00%
III) Beta measures the systematic risk associated with the portfolio
iv) A beta of 1.50 says that if the market moves by 1.50 times the stock is expected to move by
around 1.50 times in the same direction as the market moves.
e)
SRP
Cost of Equity
CAPM
Risk Free Rate 6%
Market Return 10%
Beta 1.40
Re: Rf+(Rm-Rf)*Beta
Cost of Equity
11.60
%
Question 3
a)
Project 0 1 2 3 4 NPV IRR
FAST -24 6.8 8.4 11.2 14.8 $4.81 22%
NORM -24 13.2 11.6 7.2 5.2 $4.38 24%
b) Project Fast should be accepted as this is having a higher NPV
⊘ This is a preview!⊘
Do you want full access?
Subscribe today to unlock all pages.

Trusted by 1+ million students worldwide
1 out of 13
Related Documents

Your All-in-One AI-Powered Toolkit for Academic Success.
 +13062052269
info@desklib.com
Available 24*7 on WhatsApp / Email
Unlock your academic potential
Copyright © 2020–2025 A2Z Services. All Rights Reserved. Developed and managed by ZUCOL.