Accounting and Finance Assignment: Gravepals, Cornpeace, Dane Jones
VerifiedAdded on 2021/01/02
|15
|3802
|248
Homework Assignment
AI Summary
This document presents a comprehensive solution to a finance assignment, addressing various aspects of accounting and financial management. Part A focuses on Gravepals Plc, providing an income statement and statement of financial position for 2017. Part B analyzes Cornpeace Ltd, including contribution per unit, break-even point (BEP) and margin of safety (MOS) calculations, profit estimations, and the effectiveness of marketing strategies. It also explores the assumptions of the break-even model. Part C delves into Dane Jones Ltd, calculating the payback period (PBP), accounting rate of return (ARR), and net present value (NPV). It includes a report analyzing the merits and limitations of investment appraisal techniques, along with an examination of the benefits and limitations of budgets as a strategic planning tool. The assignment covers financial statement preparation, cost-volume-profit analysis, investment appraisal, and budgeting, offering a complete overview of key finance concepts.

UGB 163 –
Introduction to Accounting and
Finance
Introduction to Accounting and
Finance
Paraphrase This Document
Need a fresh take? Get an instant paraphrase of this document with our AI Paraphraser
Contents
Part A – Gravepals Plc....................................................................................................................2
1.Preparation of the Income Statement for the year ended 2017 for Gravepals Plc....................3
2.Preparation of the Statement of Financial Position as at 31 December 2017 for Gravepals
Plc................................................................................................................................................4
Part B – Cornpeace Ltd....................................................................................................................5
a) Estimation of contribution per unit..........................................................................................5
b) calculation of BEP and MOS..................................................................................................5
c) Calculation of profit for the firm if it produces and sells 48,000 units..................................6
d) Effectiveness of Increase in marketing and advertising costs and raising of unit price by
9% and volume by 17%...............................................................................................................6
e) Identification and explanation of assumptions of Break-even model including analysing
whether the model can successfully be utilised by a range of differing businesses....................7
Part C – Dane Jones Ltd..................................................................................................................8
a) Calculation of the PBP, ARR and NPV..................................................................................8
b) Produce a report that explains and analyses the key merits and limitations of the differing
investment appraisal techniques................................................................................................10
c) identification and explanation of the key benefits and limitations of budgets as a strategic
planning tool..............................................................................................................................12
Budget as a tool of strategic Planning...................................................................................12
Key benefits of Budget as a tool for Strategic planning........................................................12
Limitations of Budget as a tool for strategic planning..........................................................13
Part A – Gravepals Plc
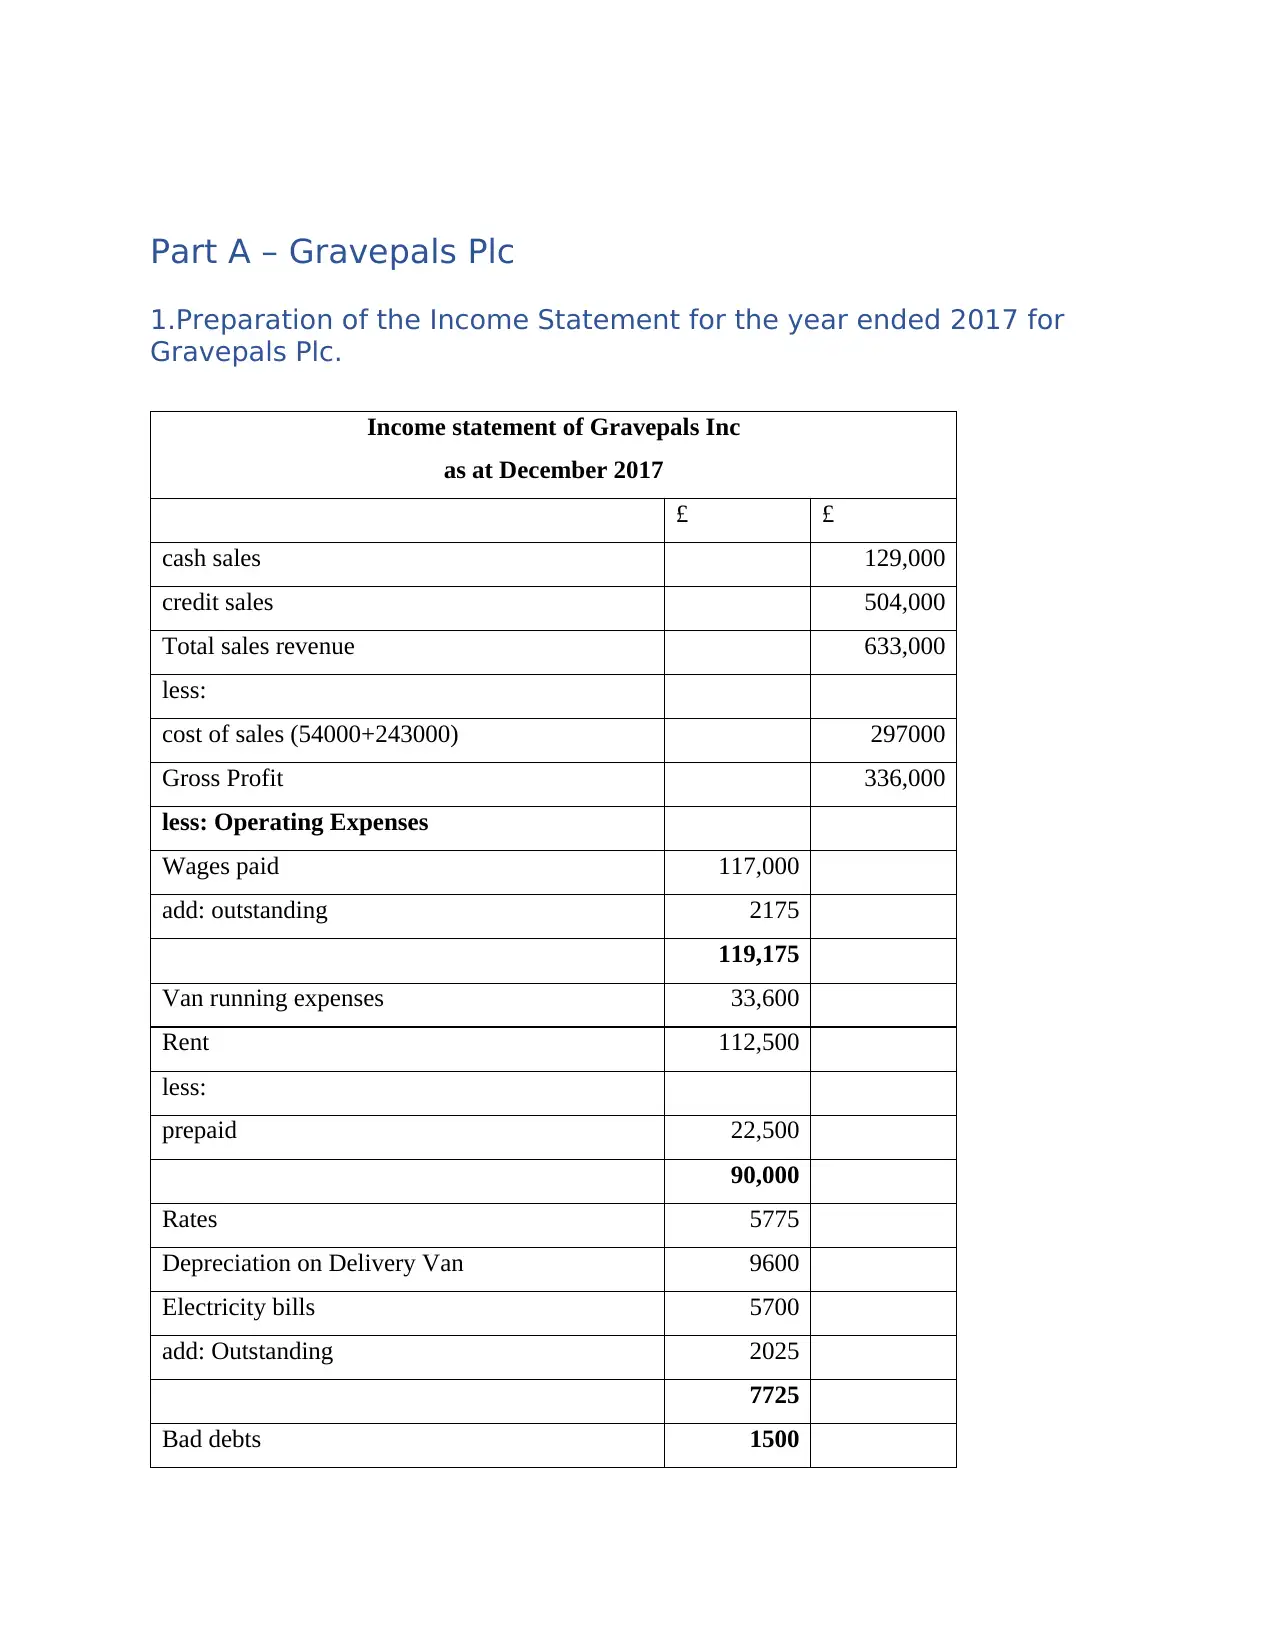
1.Preparation of the Income Statement for the year ended 2017 for
Gravepals Plc.
Income statement of Gravepals Inc
as at December 2017
£ £
cash sales 129,000
credit sales 504,000
Total sales revenue 633,000
less:
cost of sales (54000+243000) 297000
Gross Profit 336,000
less: Operating Expenses
Wages paid 117,000
add: outstanding 2175
119,175
Van running expenses 33,600
Rent 112,500
less:
prepaid 22,500
90,000
Rates 5775
Depreciation on Delivery Van 9600
Electricity bills 5700
add: Outstanding 2025
7725
Bad debts 1500
⊘ This is a preview!⊘
Do you want full access?
Subscribe today to unlock all pages.
Trusted by 1+ million students worldwide
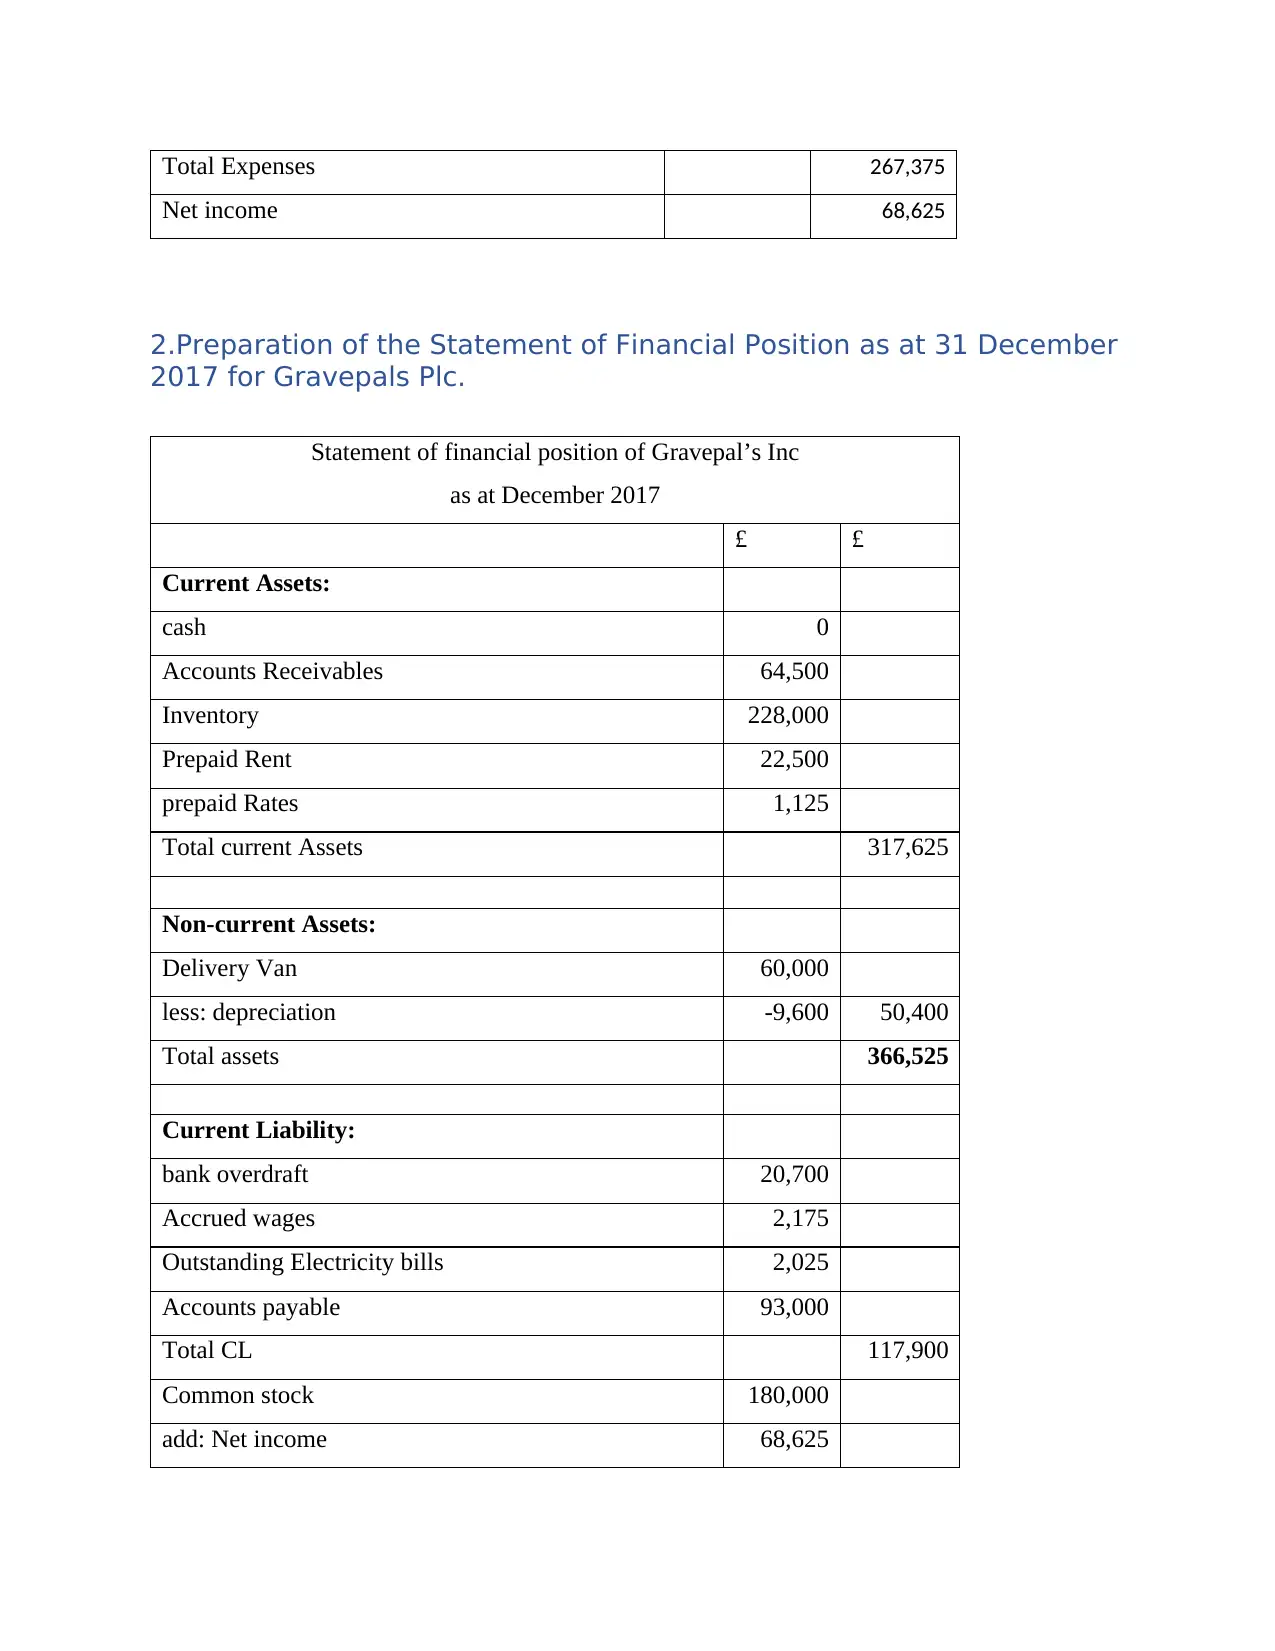
Total Expenses 267,375
Net income 68,625
2.Preparation of the Statement of Financial Position as at 31 December
2017 for Gravepals Plc.
Statement of financial position of Gravepal’s Inc
as at December 2017
£ £
Current Assets:
cash 0
Accounts Receivables 64,500
Inventory 228,000
Prepaid Rent 22,500
prepaid Rates 1,125
Total current Assets 317,625
Non-current Assets:
Delivery Van 60,000
less: depreciation -9,600 50,400
Total assets 366,525
Current Liability:
bank overdraft 20,700
Accrued wages 2,175
Outstanding Electricity bills 2,025
Accounts payable 93,000
Total CL 117,900
Common stock 180,000
add: Net income 68,625
Paraphrase This Document
Need a fresh take? Get an instant paraphrase of this document with our AI Paraphraser
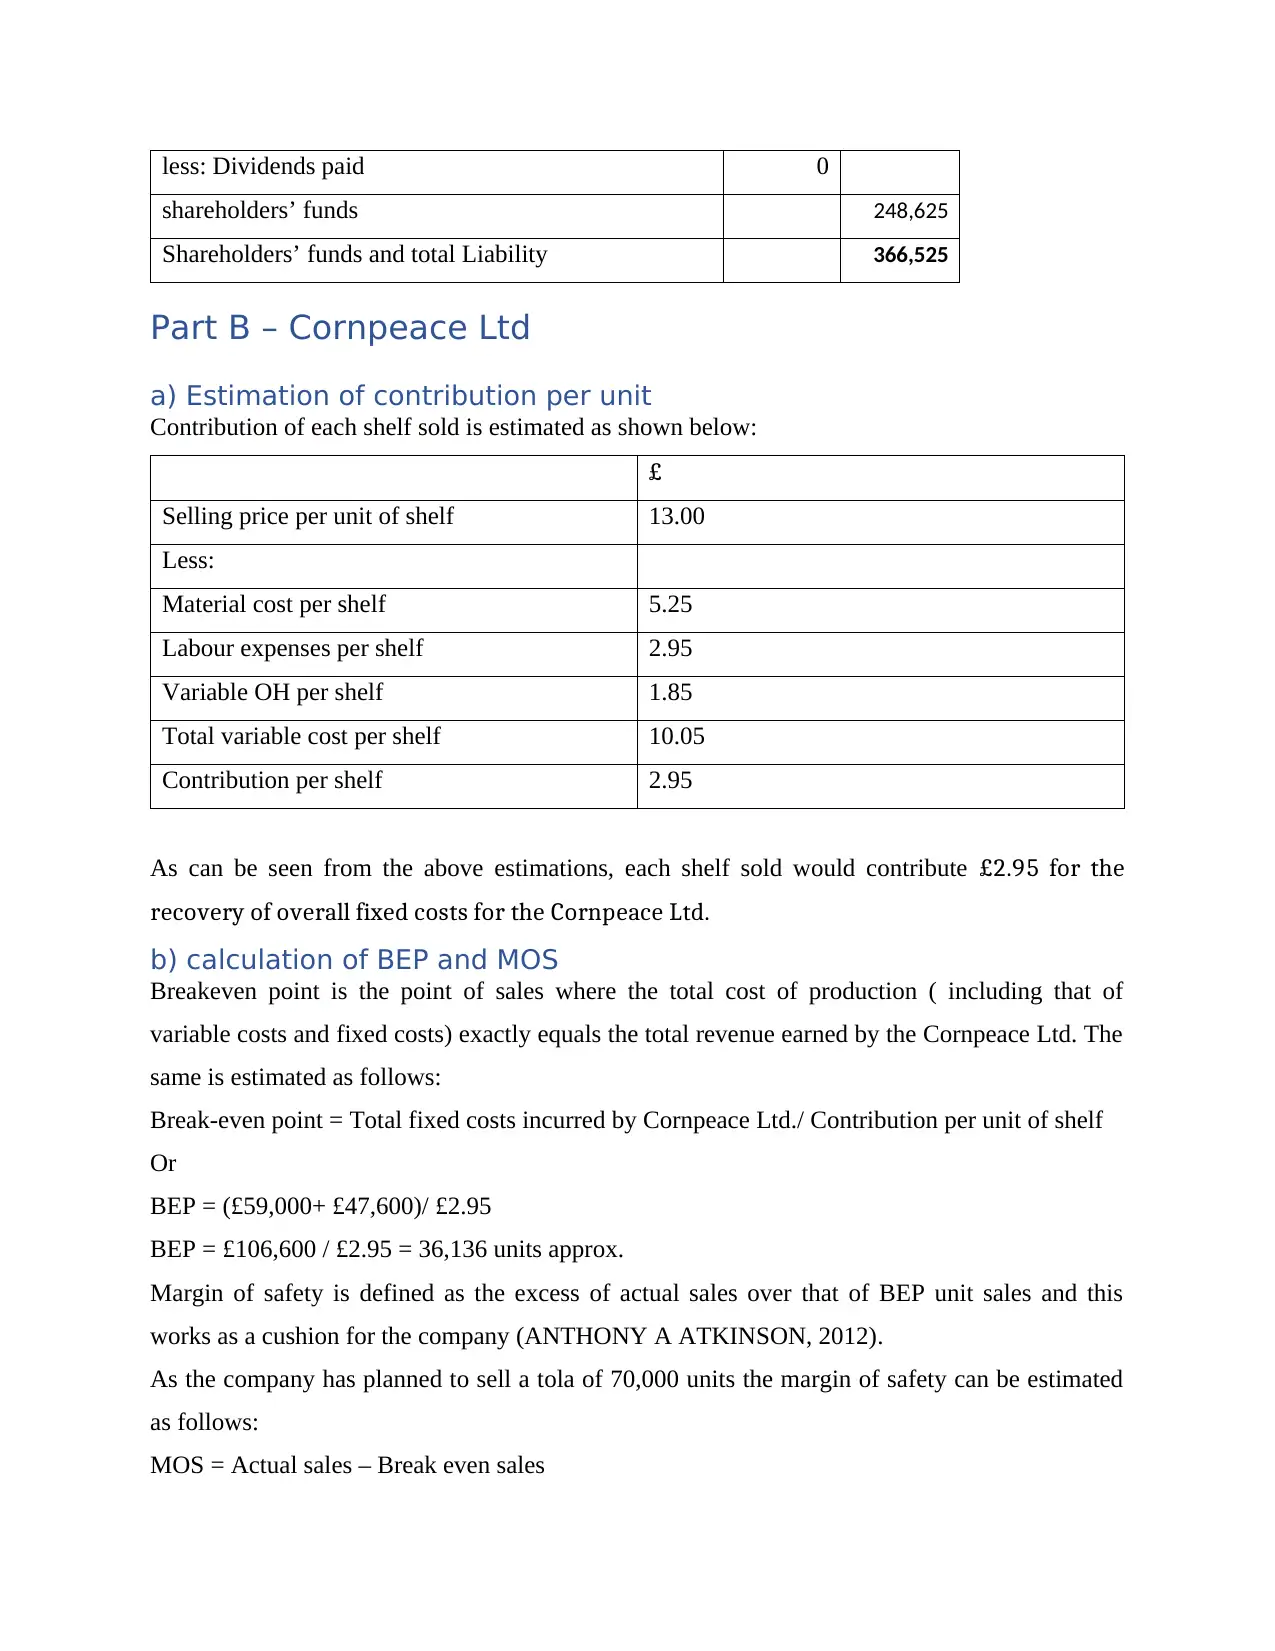
less: Dividends paid 0
shareholders’ funds 248,625
Shareholders’ funds and total Liability 366,525
Part B – Cornpeace Ltd
a) Estimation of contribution per unit
Contribution of each shelf sold is estimated as shown below:
£
Selling price per unit of shelf 13.00
Less:
Material cost per shelf 5.25
Labour expenses per shelf 2.95
Variable OH per shelf 1.85
Total variable cost per shelf 10.05
Contribution per shelf 2.95
As can be seen from the above estimations, each shelf sold would contribute £2.95 for the
recovery of overall fixed costs for the Cornpeace Ltd.
b) calculation of BEP and MOS
Breakeven point is the point of sales where the total cost of production ( including that of
variable costs and fixed costs) exactly equals the total revenue earned by the Cornpeace Ltd. The
same is estimated as follows:
Break-even point = Total fixed costs incurred by Cornpeace Ltd./ Contribution per unit of shelf
Or
BEP = (£59,000+ £47,600)/ £2.95
BEP = £106,600 / £2.95 = 36,136 units approx.
Margin of safety is defined as the excess of actual sales over that of BEP unit sales and this
works as a cushion for the company (ANTHONY A ATKINSON, 2012).
As the company has planned to sell a tola of 70,000 units the margin of safety can be estimated
as follows:
MOS = Actual sales – Break even sales
MOS = 70,000 units – 36,136 units
MOS = 33,864 units.
This means the actual sales of the company is much higher than the break even sales.
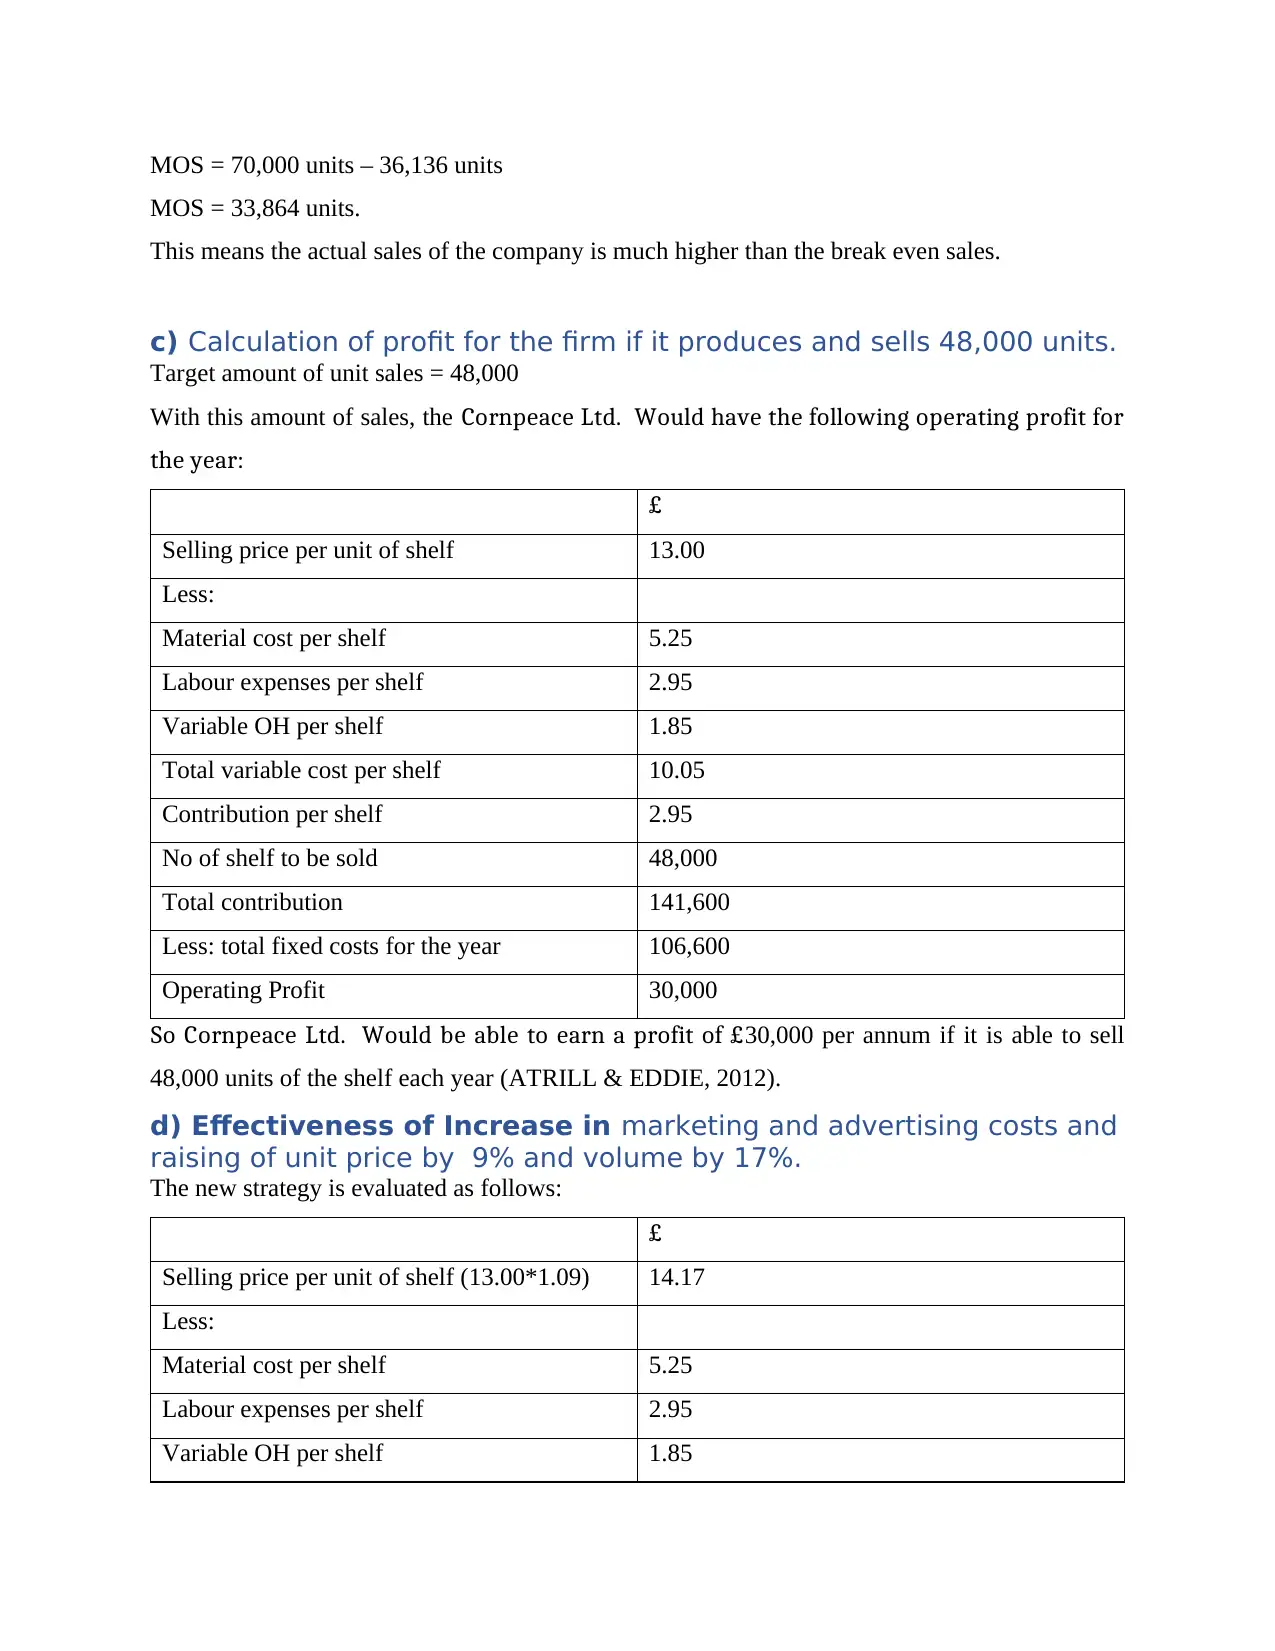
c) Calculation of profit for the firm if it produces and sells 48,000 units.
Target amount of unit sales = 48,000
With this amount of sales, the Cornpeace Ltd. Would have the following operating profit for
the year:
£
Selling price per unit of shelf 13.00
Less:
Material cost per shelf 5.25
Labour expenses per shelf 2.95
Variable OH per shelf 1.85
Total variable cost per shelf 10.05
Contribution per shelf 2.95
No of shelf to be sold 48,000
Total contribution 141,600
Less: total fixed costs for the year 106,600
Operating Profit 30,000
So Cornpeace Ltd. Would be able to earn a profit of £30,000 per annum if it is able to sell
48,000 units of the shelf each year (ATRILL & EDDIE, 2012).
d) Effectiveness of Increase in marketing and advertising costs and
raising of unit price by 9% and volume by 17%.
The new strategy is evaluated as follows:
£
Selling price per unit of shelf (13.00*1.09) 14.17
Less:
Material cost per shelf 5.25
Labour expenses per shelf 2.95
Variable OH per shelf 1.85
MOS = 33,864 units.
This means the actual sales of the company is much higher than the break even sales.
c) Calculation of profit for the firm if it produces and sells 48,000 units.
Target amount of unit sales = 48,000
With this amount of sales, the Cornpeace Ltd. Would have the following operating profit for
the year:
£
Selling price per unit of shelf 13.00
Less:
Material cost per shelf 5.25
Labour expenses per shelf 2.95
Variable OH per shelf 1.85
Total variable cost per shelf 10.05
Contribution per shelf 2.95
No of shelf to be sold 48,000
Total contribution 141,600
Less: total fixed costs for the year 106,600
Operating Profit 30,000
So Cornpeace Ltd. Would be able to earn a profit of £30,000 per annum if it is able to sell
48,000 units of the shelf each year (ATRILL & EDDIE, 2012).
d) Effectiveness of Increase in marketing and advertising costs and
raising of unit price by 9% and volume by 17%.
The new strategy is evaluated as follows:
£
Selling price per unit of shelf (13.00*1.09) 14.17
Less:
Material cost per shelf 5.25
Labour expenses per shelf 2.95
Variable OH per shelf 1.85
⊘ This is a preview!⊘
Do you want full access?
Subscribe today to unlock all pages.
Trusted by 1+ million students worldwide
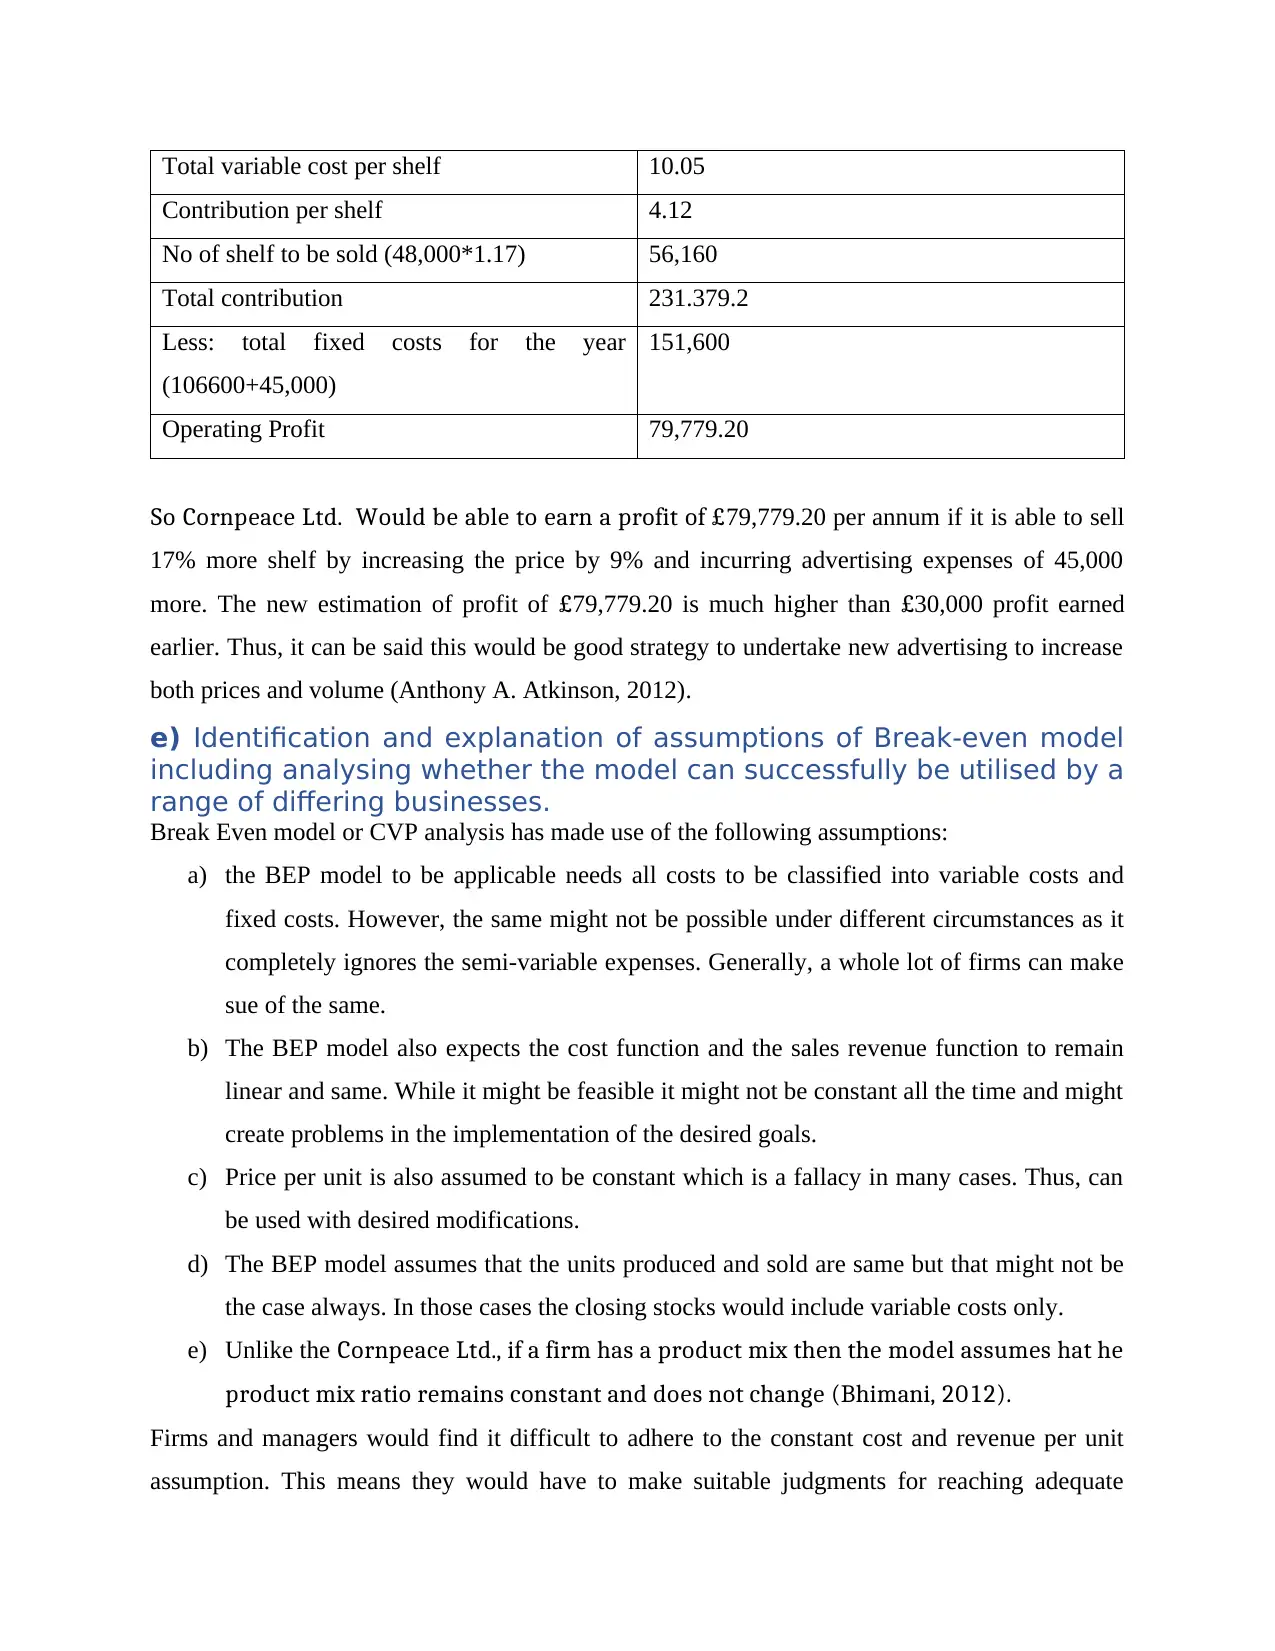
Total variable cost per shelf 10.05
Contribution per shelf 4.12
No of shelf to be sold (48,000*1.17) 56,160
Total contribution 231.379.2
Less: total fixed costs for the year
(106600+45,000)
151,600
Operating Profit 79,779.20
So Cornpeace Ltd. Would be able to earn a profit of £79,779.20 per annum if it is able to sell
17% more shelf by increasing the price by 9% and incurring advertising expenses of 45,000
more. The new estimation of profit of £79,779.20 is much higher than £30,000 profit earned
earlier. Thus, it can be said this would be good strategy to undertake new advertising to increase
both prices and volume (Anthony A. Atkinson, 2012).
e) Identification and explanation of assumptions of Break-even model
including analysing whether the model can successfully be utilised by a
range of differing businesses.
Break Even model or CVP analysis has made use of the following assumptions:
a) the BEP model to be applicable needs all costs to be classified into variable costs and
fixed costs. However, the same might not be possible under different circumstances as it
completely ignores the semi-variable expenses. Generally, a whole lot of firms can make
sue of the same.
b) The BEP model also expects the cost function and the sales revenue function to remain
linear and same. While it might be feasible it might not be constant all the time and might
create problems in the implementation of the desired goals.
c) Price per unit is also assumed to be constant which is a fallacy in many cases. Thus, can
be used with desired modifications.
d) The BEP model assumes that the units produced and sold are same but that might not be
the case always. In those cases the closing stocks would include variable costs only.
e) Unlike the Cornpeace Ltd., if a firm has a product mix then the model assumes hat he
product mix ratio remains constant and does not change (Bhimani, 2012).
Firms and managers would find it difficult to adhere to the constant cost and revenue per unit
assumption. This means they would have to make suitable judgments for reaching adequate
Paraphrase This Document
Need a fresh take? Get an instant paraphrase of this document with our AI Paraphraser
results. Also, costs would not remain linear in the long run and most probably it would decline
with higher production in the long run. So managers would be needed to keep a watch on the
cost functions and make necessary changes to the model. Because the BEP model is based on a
number of restrictive assumptions the same only can act as approximation tools and not as a pure
and real tool for making long range decisions. It would only act true in the short run when cost
and revenue functions are more or less expected to remain linear (Brearly, 2012).
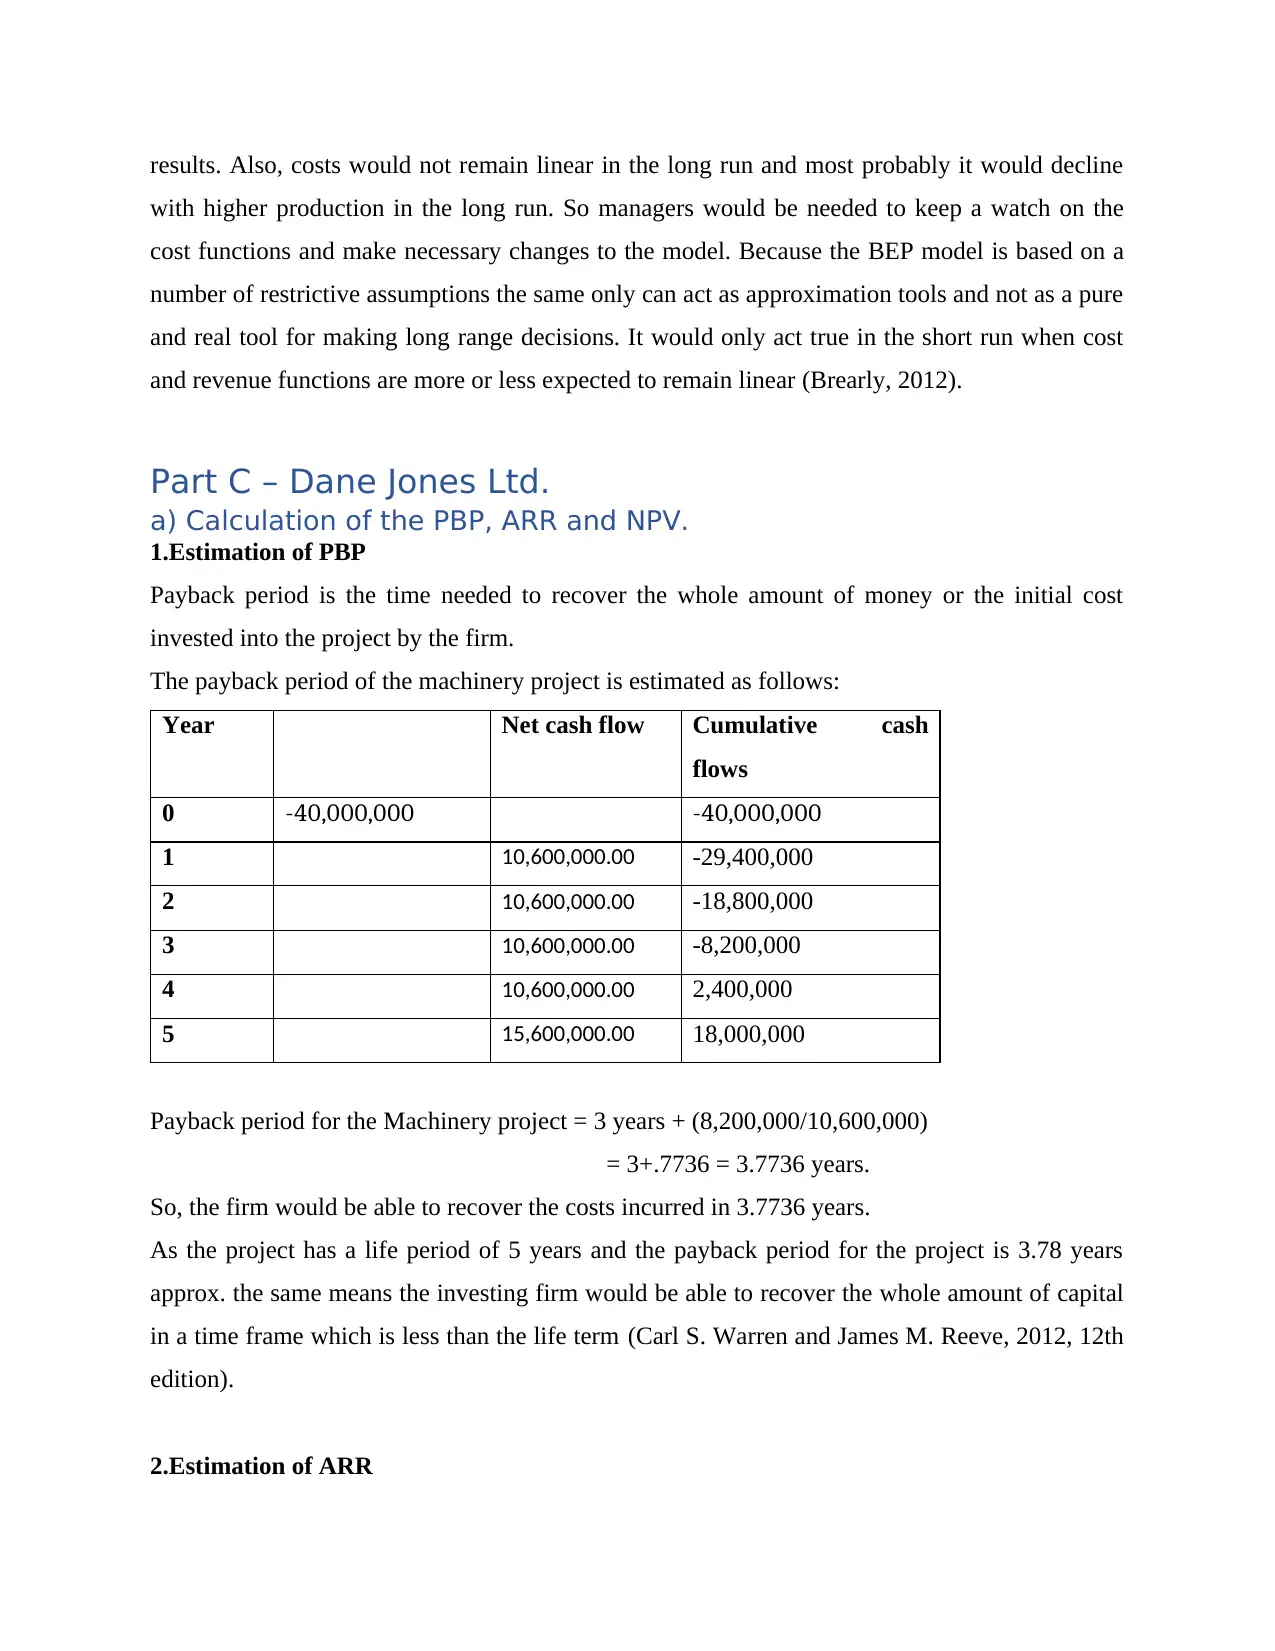
Part C – Dane Jones Ltd.
a) Calculation of the PBP, ARR and NPV.
1.Estimation of PBP
Payback period is the time needed to recover the whole amount of money or the initial cost
invested into the project by the firm.
The payback period of the machinery project is estimated as follows:
Year Net cash flow Cumulative cash
flows
0 -40,000,000 -40,000,000
1 10,600,000.00 -29,400,000
2 10,600,000.00 -18,800,000
3 10,600,000.00 -8,200,000
4 10,600,000.00 2,400,000
5 15,600,000.00 18,000,000
Payback period for the Machinery project = 3 years + (8,200,000/10,600,000)
= 3+.7736 = 3.7736 years.
So, the firm would be able to recover the costs incurred in 3.7736 years.
As the project has a life period of 5 years and the payback period for the project is 3.78 years
approx. the same means the investing firm would be able to recover the whole amount of capital
in a time frame which is less than the life term (Carl S. Warren and James M. Reeve, 2012, 12th
edition).
2.Estimation of ARR
with higher production in the long run. So managers would be needed to keep a watch on the
cost functions and make necessary changes to the model. Because the BEP model is based on a
number of restrictive assumptions the same only can act as approximation tools and not as a pure
and real tool for making long range decisions. It would only act true in the short run when cost
and revenue functions are more or less expected to remain linear (Brearly, 2012).
Part C – Dane Jones Ltd.
a) Calculation of the PBP, ARR and NPV.
1.Estimation of PBP
Payback period is the time needed to recover the whole amount of money or the initial cost
invested into the project by the firm.
The payback period of the machinery project is estimated as follows:
Year Net cash flow Cumulative cash
flows
0 -40,000,000 -40,000,000
1 10,600,000.00 -29,400,000
2 10,600,000.00 -18,800,000
3 10,600,000.00 -8,200,000
4 10,600,000.00 2,400,000
5 15,600,000.00 18,000,000
Payback period for the Machinery project = 3 years + (8,200,000/10,600,000)
= 3+.7736 = 3.7736 years.
So, the firm would be able to recover the costs incurred in 3.7736 years.
As the project has a life period of 5 years and the payback period for the project is 3.78 years
approx. the same means the investing firm would be able to recover the whole amount of capital
in a time frame which is less than the life term (Carl S. Warren and James M. Reeve, 2012, 12th
edition).
2.Estimation of ARR
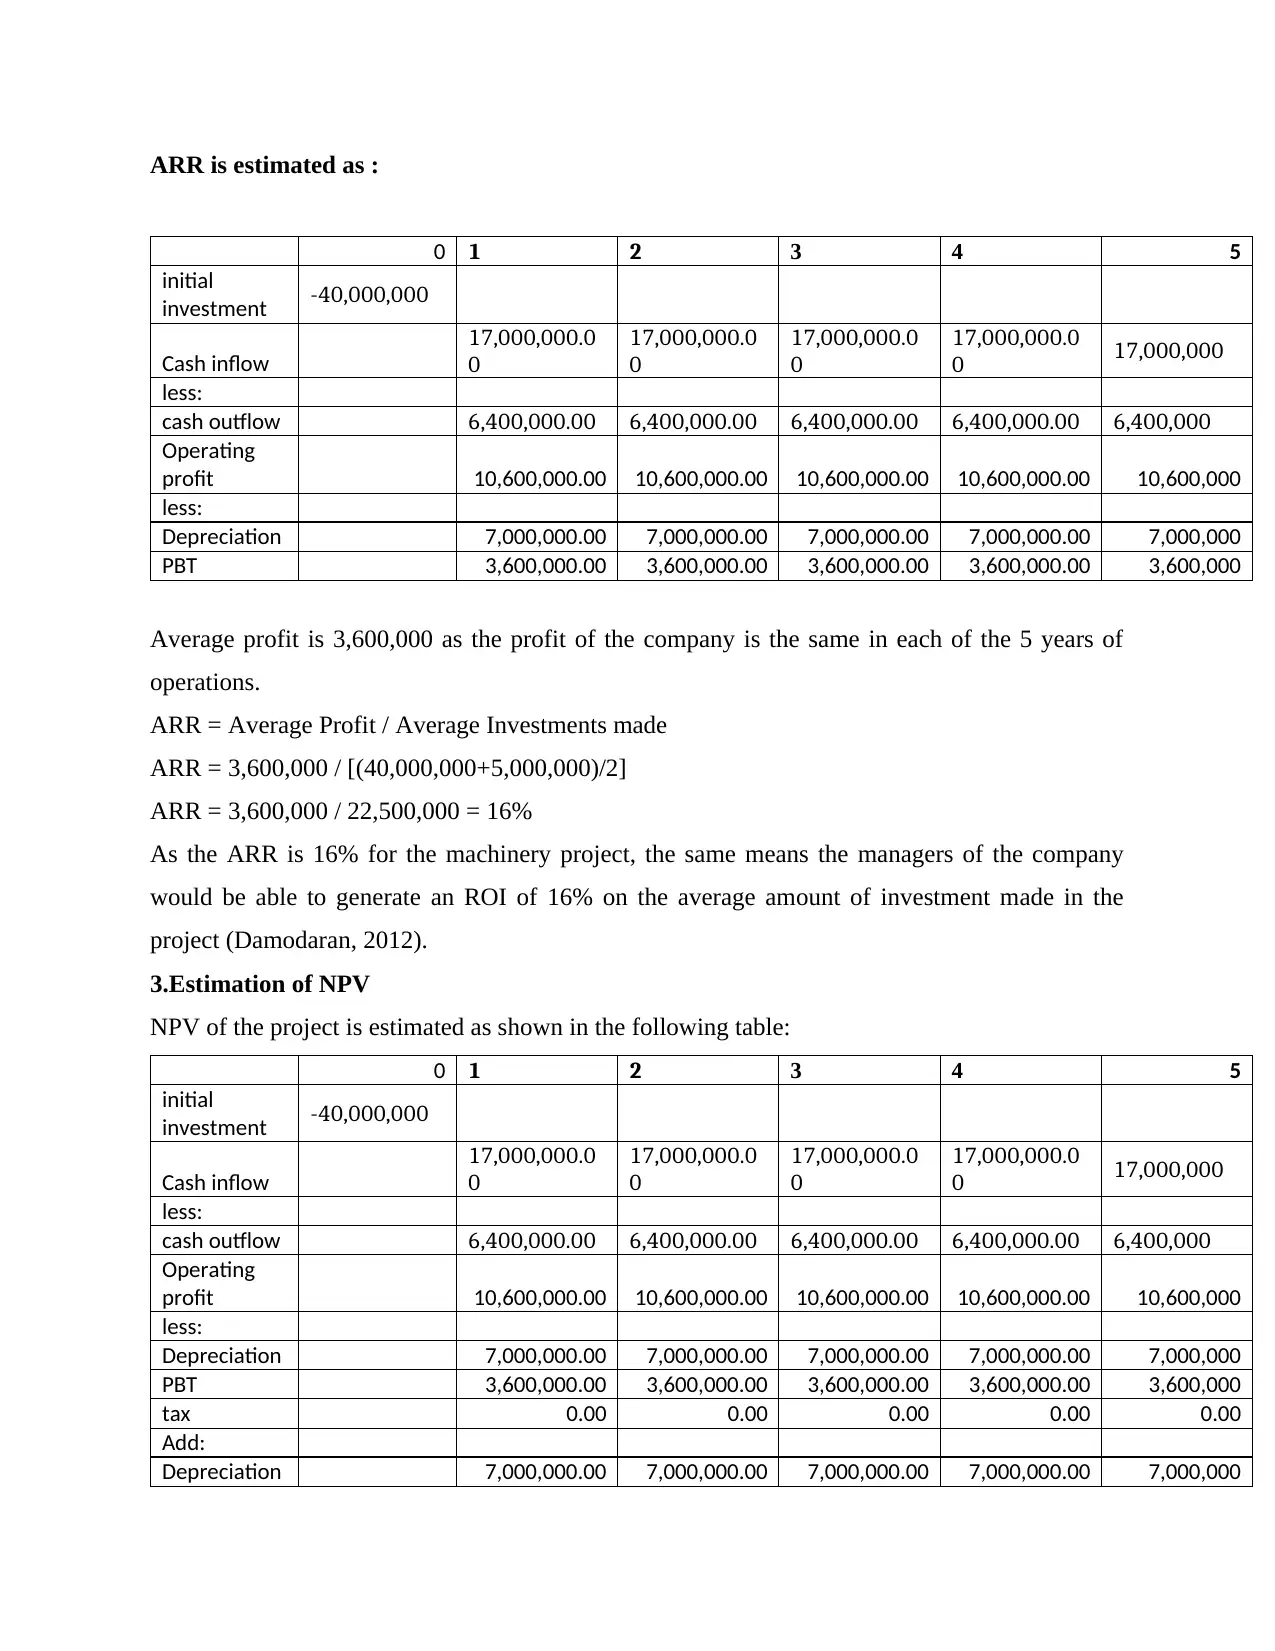
ARR is estimated as :
0 1 2 3 4 5
initial
investment -40,000,000
Cash inflow
17,000,000.0
0
17,000,000.0
0
17,000,000.0
0
17,000,000.0
0 17,000,000
less:
cash outflow 6,400,000.00 6,400,000.00 6,400,000.00 6,400,000.00 6,400,000
Operating
profit 10,600,000.00 10,600,000.00 10,600,000.00 10,600,000.00 10,600,000
less:
Depreciation 7,000,000.00 7,000,000.00 7,000,000.00 7,000,000.00 7,000,000
PBT 3,600,000.00 3,600,000.00 3,600,000.00 3,600,000.00 3,600,000
Average profit is 3,600,000 as the profit of the company is the same in each of the 5 years of
operations.
ARR = Average Profit / Average Investments made
ARR = 3,600,000 / [(40,000,000+5,000,000)/2]
ARR = 3,600,000 / 22,500,000 = 16%
As the ARR is 16% for the machinery project, the same means the managers of the company
would be able to generate an ROI of 16% on the average amount of investment made in the
project (Damodaran, 2012).
3.Estimation of NPV
NPV of the project is estimated as shown in the following table:
0 1 2 3 4 5
initial
investment -40,000,000
Cash inflow
17,000,000.0
0
17,000,000.0
0
17,000,000.0
0
17,000,000.0
0 17,000,000
less:
cash outflow 6,400,000.00 6,400,000.00 6,400,000.00 6,400,000.00 6,400,000
Operating
profit 10,600,000.00 10,600,000.00 10,600,000.00 10,600,000.00 10,600,000
less:
Depreciation 7,000,000.00 7,000,000.00 7,000,000.00 7,000,000.00 7,000,000
PBT 3,600,000.00 3,600,000.00 3,600,000.00 3,600,000.00 3,600,000
tax 0.00 0.00 0.00 0.00 0.00
Add:
Depreciation 7,000,000.00 7,000,000.00 7,000,000.00 7,000,000.00 7,000,000
0 1 2 3 4 5
initial
investment -40,000,000
Cash inflow
17,000,000.0
0
17,000,000.0
0
17,000,000.0
0
17,000,000.0
0 17,000,000
less:
cash outflow 6,400,000.00 6,400,000.00 6,400,000.00 6,400,000.00 6,400,000
Operating
profit 10,600,000.00 10,600,000.00 10,600,000.00 10,600,000.00 10,600,000
less:
Depreciation 7,000,000.00 7,000,000.00 7,000,000.00 7,000,000.00 7,000,000
PBT 3,600,000.00 3,600,000.00 3,600,000.00 3,600,000.00 3,600,000
Average profit is 3,600,000 as the profit of the company is the same in each of the 5 years of
operations.
ARR = Average Profit / Average Investments made
ARR = 3,600,000 / [(40,000,000+5,000,000)/2]
ARR = 3,600,000 / 22,500,000 = 16%
As the ARR is 16% for the machinery project, the same means the managers of the company
would be able to generate an ROI of 16% on the average amount of investment made in the
project (Damodaran, 2012).
3.Estimation of NPV
NPV of the project is estimated as shown in the following table:
0 1 2 3 4 5
initial
investment -40,000,000
Cash inflow
17,000,000.0
0
17,000,000.0
0
17,000,000.0
0
17,000,000.0
0 17,000,000
less:
cash outflow 6,400,000.00 6,400,000.00 6,400,000.00 6,400,000.00 6,400,000
Operating
profit 10,600,000.00 10,600,000.00 10,600,000.00 10,600,000.00 10,600,000
less:
Depreciation 7,000,000.00 7,000,000.00 7,000,000.00 7,000,000.00 7,000,000
PBT 3,600,000.00 3,600,000.00 3,600,000.00 3,600,000.00 3,600,000
tax 0.00 0.00 0.00 0.00 0.00
Add:
Depreciation 7,000,000.00 7,000,000.00 7,000,000.00 7,000,000.00 7,000,000
⊘ This is a preview!⊘
Do you want full access?
Subscribe today to unlock all pages.
Trusted by 1+ million students worldwide
Scrap
Realized 5,000,000
Net cash
flows -40,000,000 10,600,000.00 10,600,000.00 10,600,000.00 10,600,000.00 15,600,000
PVF @ 7% 1.00 0.93 0.87 0.82 0.76 0.71
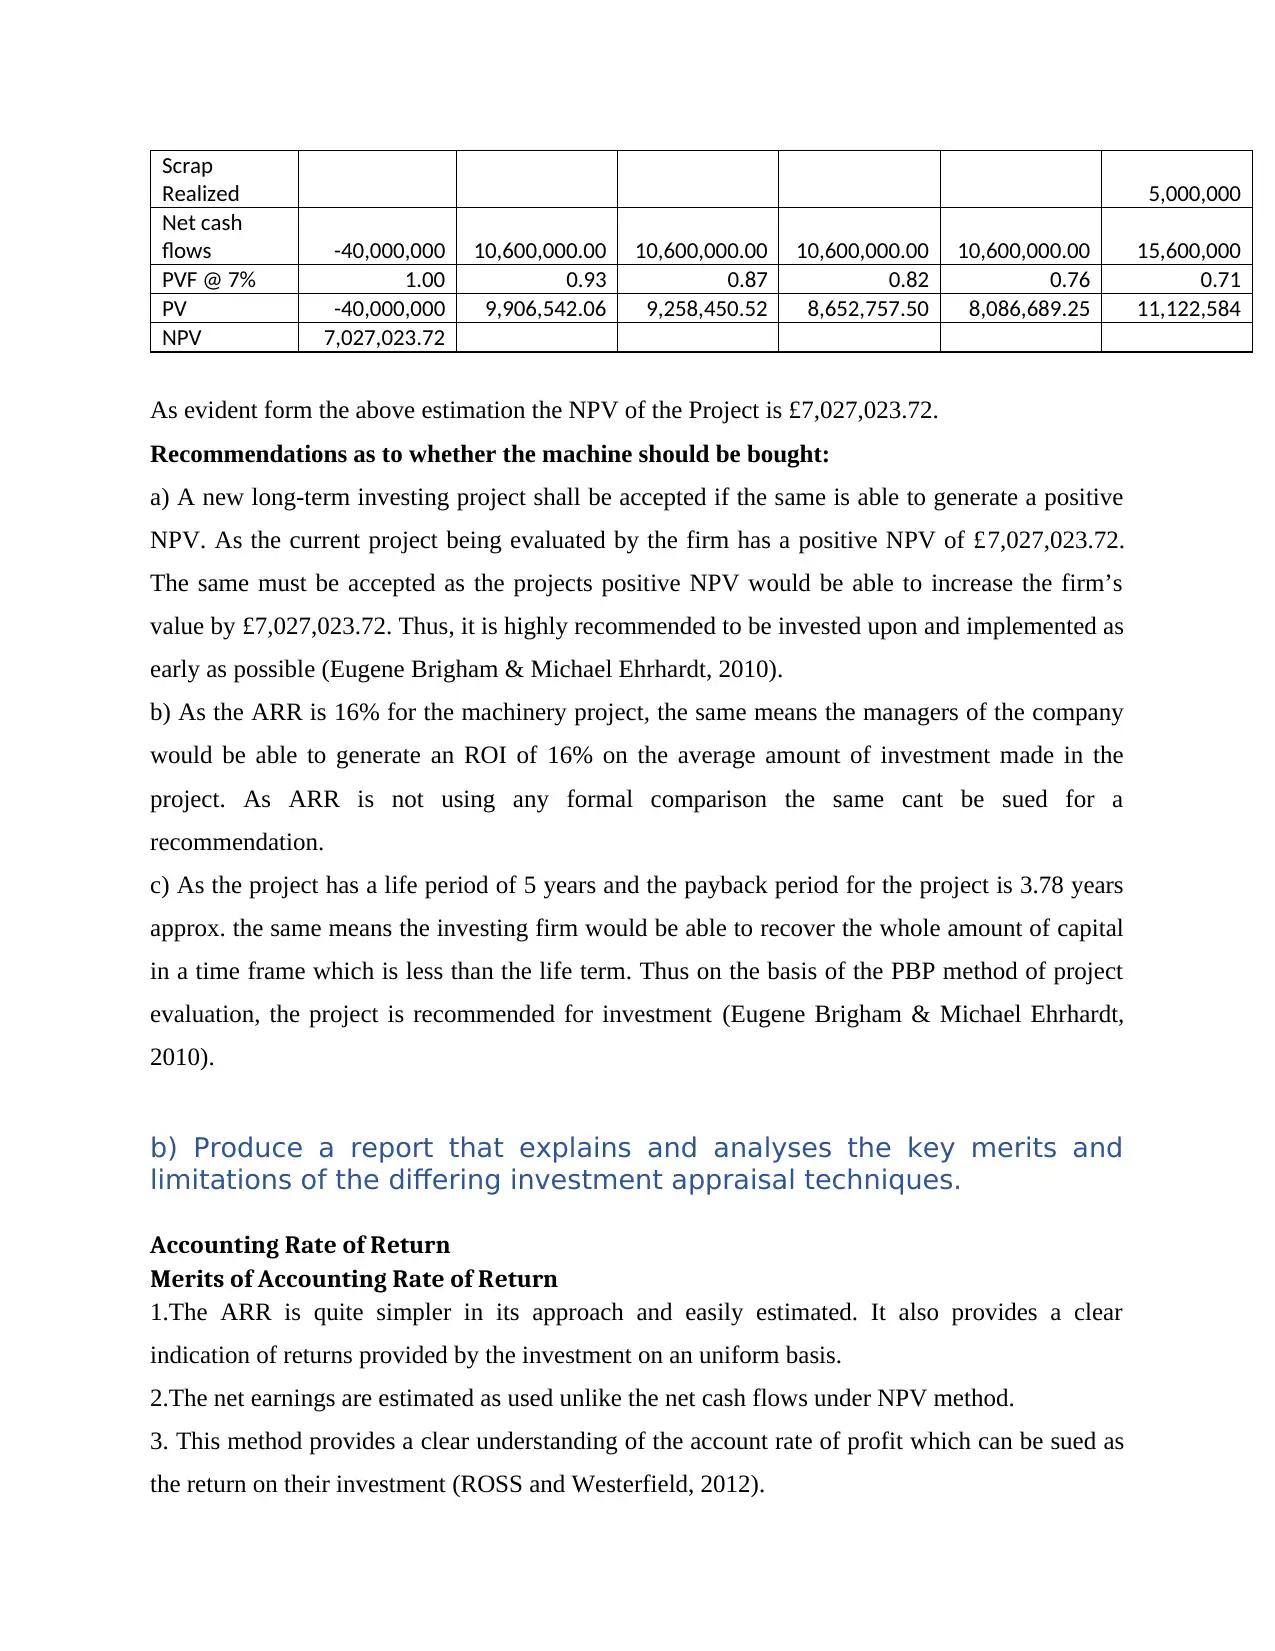
PV -40,000,000 9,906,542.06 9,258,450.52 8,652,757.50 8,086,689.25 11,122,584
NPV 7,027,023.72
As evident form the above estimation the NPV of the Project is £7,027,023.72.
Recommendations as to whether the machine should be bought:
a) A new long-term investing project shall be accepted if the same is able to generate a positive
NPV. As the current project being evaluated by the firm has a positive NPV of £7,027,023.72.
The same must be accepted as the projects positive NPV would be able to increase the firm’s
value by £7,027,023.72. Thus, it is highly recommended to be invested upon and implemented as
early as possible (Eugene Brigham & Michael Ehrhardt, 2010).
b) As the ARR is 16% for the machinery project, the same means the managers of the company
would be able to generate an ROI of 16% on the average amount of investment made in the
project. As ARR is not using any formal comparison the same cant be sued for a
recommendation.
c) As the project has a life period of 5 years and the payback period for the project is 3.78 years
approx. the same means the investing firm would be able to recover the whole amount of capital
in a time frame which is less than the life term. Thus on the basis of the PBP method of project
evaluation, the project is recommended for investment (Eugene Brigham & Michael Ehrhardt,
2010).
b) Produce a report that explains and analyses the key merits and
limitations of the differing investment appraisal techniques.
Accounting Rate of Return
Merits of Accounting Rate of Return
1.The ARR is quite simpler in its approach and easily estimated. It also provides a clear
indication of returns provided by the investment on an uniform basis.
2.The net earnings are estimated as used unlike the net cash flows under NPV method.
3. This method provides a clear understanding of the account rate of profit which can be sued as
the return on their investment (ROSS and Westerfield, 2012).
Realized 5,000,000
Net cash
flows -40,000,000 10,600,000.00 10,600,000.00 10,600,000.00 10,600,000.00 15,600,000
PVF @ 7% 1.00 0.93 0.87 0.82 0.76 0.71
PV -40,000,000 9,906,542.06 9,258,450.52 8,652,757.50 8,086,689.25 11,122,584
NPV 7,027,023.72
As evident form the above estimation the NPV of the Project is £7,027,023.72.
Recommendations as to whether the machine should be bought:
a) A new long-term investing project shall be accepted if the same is able to generate a positive
NPV. As the current project being evaluated by the firm has a positive NPV of £7,027,023.72.
The same must be accepted as the projects positive NPV would be able to increase the firm’s
value by £7,027,023.72. Thus, it is highly recommended to be invested upon and implemented as
early as possible (Eugene Brigham & Michael Ehrhardt, 2010).
b) As the ARR is 16% for the machinery project, the same means the managers of the company
would be able to generate an ROI of 16% on the average amount of investment made in the
project. As ARR is not using any formal comparison the same cant be sued for a
recommendation.
c) As the project has a life period of 5 years and the payback period for the project is 3.78 years
approx. the same means the investing firm would be able to recover the whole amount of capital
in a time frame which is less than the life term. Thus on the basis of the PBP method of project
evaluation, the project is recommended for investment (Eugene Brigham & Michael Ehrhardt,
2010).
b) Produce a report that explains and analyses the key merits and
limitations of the differing investment appraisal techniques.
Accounting Rate of Return
Merits of Accounting Rate of Return
1.The ARR is quite simpler in its approach and easily estimated. It also provides a clear
indication of returns provided by the investment on an uniform basis.
2.The net earnings are estimated as used unlike the net cash flows under NPV method.
3. This method provides a clear understanding of the account rate of profit which can be sued as
the return on their investment (ROSS and Westerfield, 2012).
Paraphrase This Document
Need a fresh take? Get an instant paraphrase of this document with our AI Paraphraser
4. Current performance is easily estimated and compared.
Limitations of Accounting Rate of Return
Despite being a simple method ARR has many shortcomings which makes it harder to use to
evaluate projects on a financial analysis:
a) it does not use financial concept and is a purely accounting measure and thus ignored.
b) This method like PBP does not use TVM.
c) This method fails to find a fair return against which the ROI can be compared.
d) External factors like risks are ignored making it impossible to adjust the real profitability
(Brearly, 2012).
Payback Period
Merits of payback period
a) It is one of the simplest methods of project cost evaluation and also easier to
understand.
b) This method is extremely useful to determine the liquidity associated with a project.
c) When there is uncertainty surrounding a project managers prefer the PBP to be
used to find if the project shall be pursued for further estimations or not.
Limitations of Payback period
a) The most visible limitations pertaining to this method is that it ignores the
discounting method and also does not use the time value of cash flows involved.
b) This method ignores the cash flows which occurs after the payback period is
determined.
c) Under this method there is no baas which can be rationally apply to all projects
universally and thus decisions are likely to be under the subjective bias of managers
in charge (Fabozz & Drake, 2009. ).
Net Present Value (NPV)
Merits of Net Present value method
a) The most obvious benefit of the NPV method is that it considers the time value of money
and discounts the cash flows with an appropriate level of capital cost known as the
discount rate.
b) NPV is able to provide a single value in dollar to demonstrate the benefit that would be
derived form the implementation of the project.
c) The cost of capital and the relevant risk is inserted into the discount rates and hence the
cash flows discounted with the same demonstrates the value that can be added to the firm.
Limitations of Net Present value method
Despite a no of benefits of the NPV method the method also has a number of drawbacks which is
listed as follows:
a) One of the biggest drawbacks of NPV is the estimation of the cost of capital that can be
sued to discount the cash flows. If the discount rate is wrongly estimated, then the NPV
would be wrongly estimated as well. If the cost of capital is higher than many good
investing options might be rejected.
b) NPV method despite being widley used is incapable of being used fairly for estimating
the true worth of projects of different sizes (Bhimani, 2012).
c) NPV method would not be successful in providing a definitive idea of project worth
when the size of the projects differs too much and also when the projects life period are
not equal.
c) identification and explanation of the key benefits and limitations of
budgets as a strategic planning tool.
As per the desire of the management of the company the following report has bene prepared to
showcase the utility of the budgeting tool in the development of the company’s business and to
understand the key benefits of the process and limitations of the same. The report would make
sure management is aware of possible benefits and at the same are able to avoid harmful side
effects.
Budget as a tool of strategic Planning
⊘ This is a preview!⊘
Do you want full access?
Subscribe today to unlock all pages.
Trusted by 1+ million students worldwide
1 out of 15
Related Documents


Your All-in-One AI-Powered Toolkit for Academic Success.
+13062052269
info@desklib.com
Available 24*7 on WhatsApp / Email
![[object Object]](/_next/static/media/star-bottom.7253800d.svg)
Unlock your academic potential
Copyright © 2020–2026 A2Z Services. All Rights Reserved. Developed and managed by ZUCOL.