Finance for Business Assignment: Valuation and Financial Analysis

Verified

Added on  2021/04/16

|6
|847
|26
Homework Assignment
AI Summary
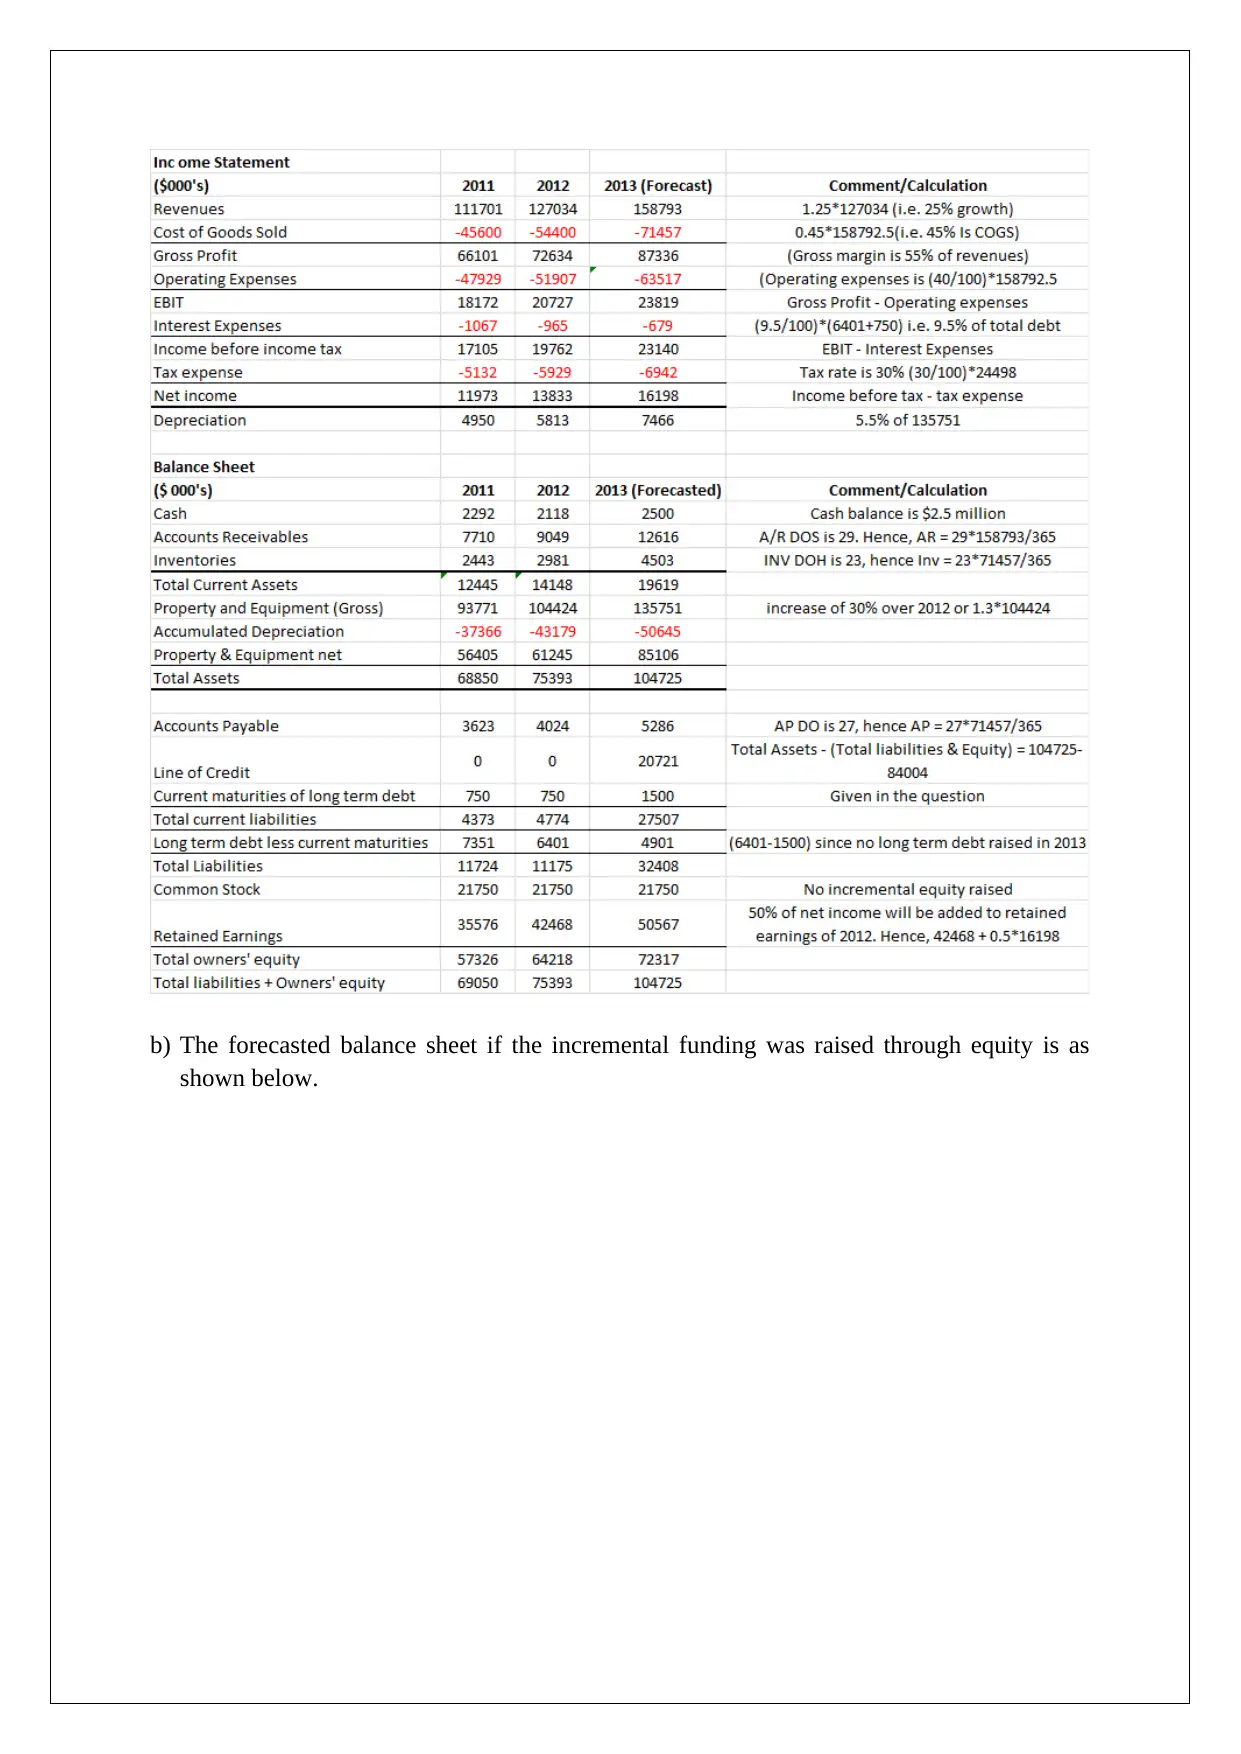
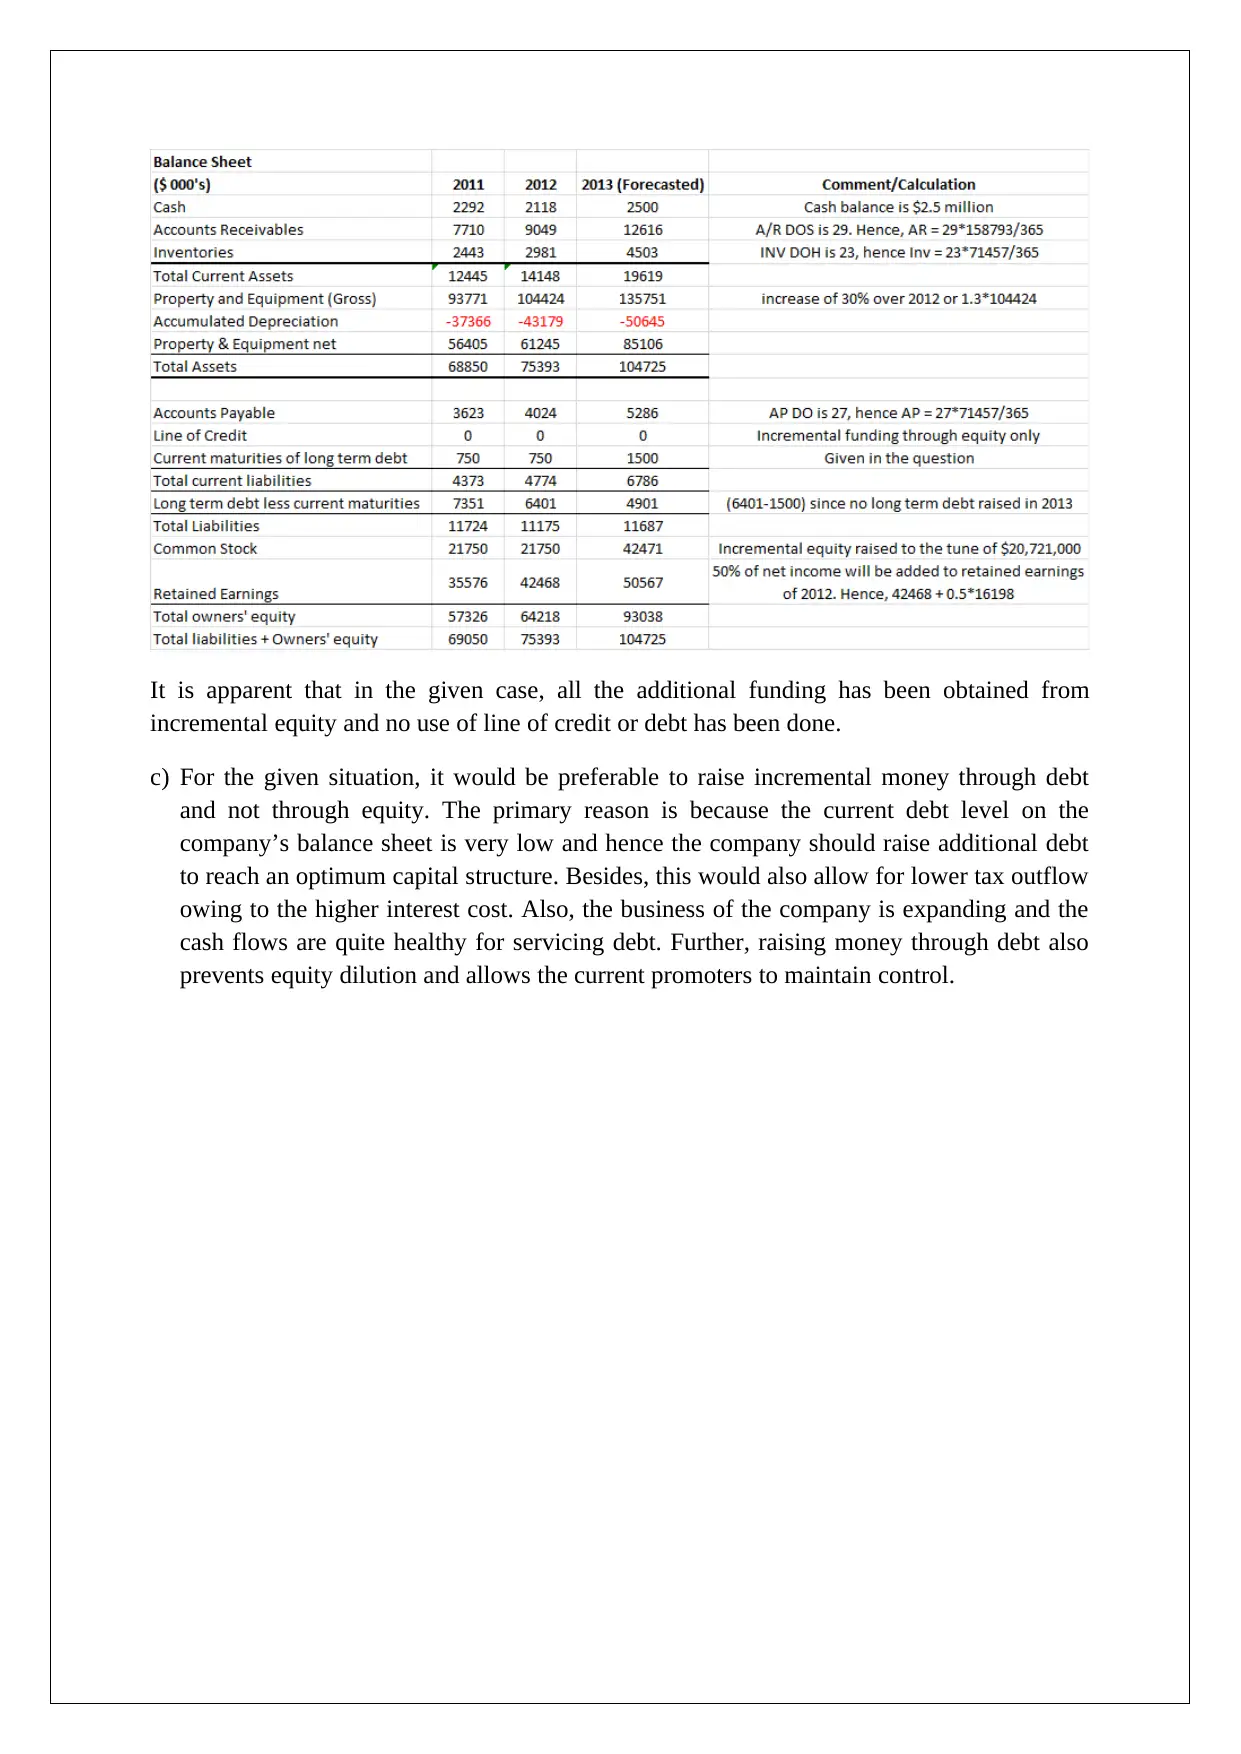
This document presents a comprehensive solution to a finance assignment, addressing key concepts such as Free Cash Flow (FCF) calculation, valuation methods, and financial analysis. The solution meticulously computes FCF for 2016 and 2017, calculates terminal value, and determines the present value of a firm. It explores various valuation multiples, including P/E, P/BV, and Market Capitalization/Revenue, to estimate the intrinsic value per share. The assignment also covers the analysis of Accounts Receivable Days Sales Outstanding (DSO), Accounts Payable Days Outstanding (AP DO), and Inventory Days on Hand (INV DOH). Furthermore, it provides a comparative analysis of debt versus equity financing options, recommending debt financing based on the company's financial position and expansion plans. The document concludes with a discussion on optimal capital structure and its implications for tax outflow and equity dilution.
Document Page
Finance For Business
STUDENT ID:
[Pick the date]
tabler-icon-diamond-filled.svg

Paraphrase This Document

Need a fresh take? Get an instant paraphrase of this document with our AI Paraphraser
Document Page
Question 1
a) The formula for Free Cash Flow or FCF is as indicated below.
Input Value Computation
Forecasted EBIT for 2016 = $271,415
Forecasted EBIT for 2017 = $284,986
Tax rate = 35%
Forecasted Depreciation for 2016 = $144,360
Forecasted Depreciation for 2017 = $157,640
Net working capital = Current Assets – Current Liabilities
Forecasted net working capital for 2015 = 354357 – (103445+280000) = - $29,088
Forecasted net working capital for 2016 = 392464 – (115859+260000) = $16,605
Forecasted net working capital for 2017 = 435144 – (129762 + 240000) = $65,382
Change in working capital for 2016 = (16605-(-29088)) = $45,693
Change in working capital for 2017 = (65382- 16605) = $48,777
Capital expenditure in 2016 = Gross property & Equipment in 2016 - Gross property &
Equipment in 2015 = 2887180 – 2634240 = $ 252,940
Capital expenditure in 2017 = Gross property & Equipment in 2017 - Gross property &
Equipment in 2016 = 3152770 - 2887180 = $ 265,590
Computation of FCF
Using the computed input values, the requisite FCF can be computed as shown below.
Estimated FCF for 2016 = 271415(1-0.35) + 144360 – 45693 – 252940 = $22,146.75
Estimated FCF for 2017 = 284986(1-0.35) + 157640 - 48777 - 265590 = $28,513.9
Computation of Terminal Value
Document Page
Estimated FCF for 2017 = $28,513.9
Perpetual growth rate after 2017 = 3% per annum
WACC = 6.5%
Hence, terminal value = 28513.9*(1+0.03)/(0.065-0.003) = $839,123.3
b) In order to find the present value of the firm, the future FCF need to be discounted using
the given WACC.
FCF 2013 = $43,000, FCF 2014 = $75,000, FCF 2015 = $82,000, FCF 2016 = $96,000
FCF 2017 = $112,000 & Terminal value = $2,100,000
Also, WACC = 6.5%
Hence, value of firm in 2012 = (43000/1.065) + (75000/1.0652) + (82000/1.0653) +
(96000/1.0654) + (112000/1.0655) + (2100000/1.0655) = $ 1,863,503
Outstanding shares in 2012 = 50,000
Hence, per share equity value = 1863503/50000 = $37.27
c) The various multiples that can be applied in the given case are P/E, EV/EBITDA. P/BV
and Mcap/Revenue.
P/E Multiple
Based on the given data for the comparable firms, the P/E multiple is computed as
captured in the table shown below.
For the computation of average P/E, Southwest Solar is not considered owing to negative
value of EPS. However, this method is not suitable for SolarTek considering that in 2012,
the company incurred a loss and had a negative EPS.
Price/Book Value or P/BV
The P/BV of the various comparable firms in 2012 is summarised below.
Document Page
Hence, intrinsic price per share for SolarTek in 2012 = 2.76*(621670/50000) = $34.33
Market Capitalization/Revenue or Mcap/Revenue
The Mcap/Revenue of the various comparable firms in 2012 is summarised below.
Hence, market capitalisation of SolarTek in 2012 – 0.55*1840720 = $1,010,427
Shares outstanding = 50,000
Intrinsic value per share for SolarTek in 2012 = 1010427/50000 = $20.21
EV/EBITDA
This method would not be useful for the valuation of Solartek since in 2012 the company
has a negative EBITDA.
Conclusion
In order to compute the fair price of SolarTek share, it would be prudent to take the average
of the fair price of the share determined through various multiples method.
Fair value of SolarTek share in 2012 = (34.33+20.21)/2 = $ 27.27
Question 2
a) The computation for A/R DSO, AP DO and INV DOH for 2013 is as highlighted below.
The forecasted income statement & balance sheet for 2013 along with requisite explanation is
as indicated below.
tabler-icon-diamond-filled.svg

Paraphrase This Document

Need a fresh take? Get an instant paraphrase of this document with our AI Paraphraser
Document Page
b) The forecasted balance sheet if the incremental funding was raised through equity is as
shown below.
Document Page
It is apparent that in the given case, all the additional funding has been obtained from
incremental equity and no use of line of credit or debt has been done.
c) For the given situation, it would be preferable to raise incremental money through debt
and not through equity. The primary reason is because the current debt level on the
company’s balance sheet is very low and hence the company should raise additional debt
to reach an optimum capital structure. Besides, this would also allow for lower tax outflow
owing to the higher interest cost. Also, the business of the company is expanding and the
cash flows are quite healthy for servicing debt. Further, raising money through debt also
prevents equity dilution and allows the current promoters to maintain control.
chevron_up_icon
1 out of 6
circle_padding
hide_on_mobile
zoom_out_icon
[object Object]