Comprehensive Financial Analysis of Metlifecare: HI5002 Assignment
VerifiedAdded on 2023/06/12
|15
|4027
|305
Case Study
AI Summary
This case study provides a comprehensive financial analysis of Metlifecare Limited, an ASX-listed company in the healthcare industry, focusing on its financial performance and investment potential. The analysis includes an examination of the company's ownership structure, key financial ratios (short-term solvency, long-term solvency, asset utilization, profitability, and market value), and stock movement over the past two years, comparing it with the All Ordinary Index. The report further discusses recent announcements by the company, calculates the weighted average cost of capital (WACC), explores the optimal debt structure, and reviews the dividend policy. Based on the analysis, the assignment determines whether Metlifecare's stock can be considered a conservative investment and provides a final investment recommendation.

Running head: FINANCE FOR BUSINESS – MASTERS
Finance for business - Masters
Name of the student
Name of the university
Author note
Finance for business - Masters
Name of the student
Name of the university
Author note
Paraphrase This Document
Need a fresh take? Get an instant paraphrase of this document with our AI Paraphraser
FINANCE FOR BUSINESS - MASTERS 1
Table of Contents
1. Description of the company.......................................................................................2
2. Specification of the structure of ownership governance............................................2
3. Fundamental ratios.....................................................................................................4
4. Information from ASX website..................................................................................4
5. Recent announcement................................................................................................7
6. Stock field..................................................................................................................7
7. WACC (weighted average cost of capital).................................................................9
8. Optimal debt structure..............................................................................................10
9. Dividend policy........................................................................................................11
10. Recommendation..................................................................................................12
Reference.........................................................................................................................13
FINANCE FOR BUSINESS - MASTERS 2
1. Description of the company
Metlife care Limited is an ASX listed company that was formed in the year 1984
and the company is based in Auckland, New Xealand. It operates and owns the
retirement villages. The entity is engaged in delivering care and rewarding lifestyle to
more than 5000 peoples. The company’s villages also offer wide range of care from the
independent apartments and villas through to hospitals, rest homes and serviced
apartments. It further provides retirement living all over the Auckland, Bay of Plenty,
Hamilton, Kapiti Coast and Manawatu. The entity offers different levels of support and
care based on the user and village’s requirement. The aged care assistance of the
company ranges from hospital options, rest homes and serviced apartments. Further, the
assistance for living are designed specifically for the residents that includes the
continuous support with regard to the medical assistance and daily tasks
(Metlifecare.co.nz 2018). The independent accommodation for living includes cottages,
apartments and villas. Various subsidiaries included under the company are Metlifecare
Bayswater Limited, Forest Lake Gardens Limited and Hibiscus Coast Village Holding
Limited. The company falls under the healthcare industry of New Zealand. If the past
performance of the company is taken into consideration it can be observed that the
company was able to improve the net income gradually over the past 2 years of time.
Further, the earning of the company has been increased by 10.01% in the recent year as
compared to the previous year. The reason of growth was that the company was able to
increase its revenue through efficient control on the costs. It led to the profitability and
margin expansion over the time (Metlifecare.co.nz 2018).
2. Specification of the structure of ownership governance
i) Major substantial shareholders
As per the Corporation Act the substantial shareholder is the person who holds
5% or more 5% of shares or voting rights in the company. Name of the substantial
shareholders of the company shall be disclosed through notes to the accounts. If the
company provides list of top 20 shareholders of the company in the annual report
substantial shareholder’s names are provided in the top of the list (Baños-Caballero,
⊘ This is a preview!⊘
Do you want full access?
Subscribe today to unlock all pages.
Trusted by 1+ million students worldwide
FINANCE FOR BUSINESS - MASTERS 3
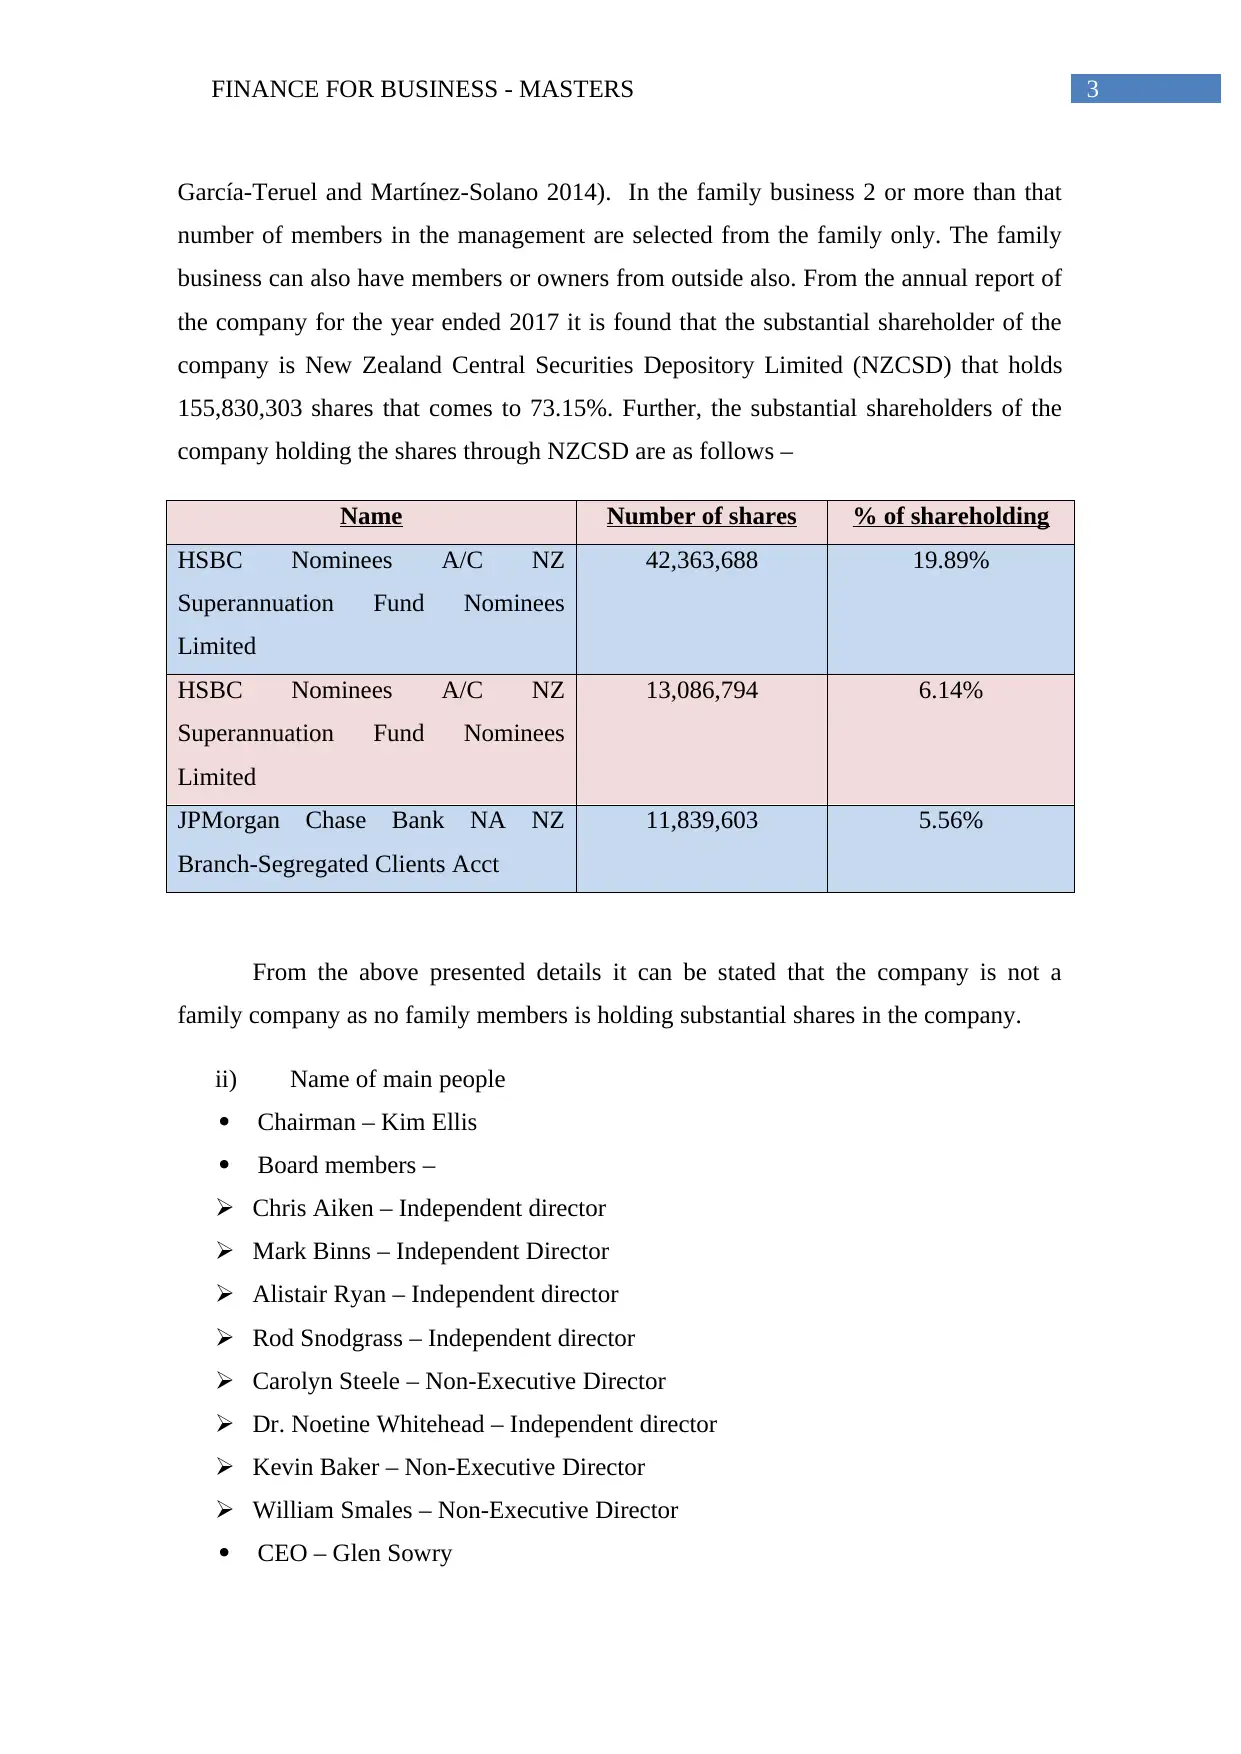
García-Teruel and Martínez-Solano 2014). In the family business 2 or more than that
number of members in the management are selected from the family only. The family
business can also have members or owners from outside also. From the annual report of
the company for the year ended 2017 it is found that the substantial shareholder of the
company is New Zealand Central Securities Depository Limited (NZCSD) that holds
155,830,303 shares that comes to 73.15%. Further, the substantial shareholders of the
company holding the shares through NZCSD are as follows –
Name Number of shares % of shareholding
HSBC Nominees A/C NZ
Superannuation Fund Nominees
Limited
42,363,688 19.89%
HSBC Nominees A/C NZ
Superannuation Fund Nominees
Limited
13,086,794 6.14%
JPMorgan Chase Bank NA NZ
Branch-Segregated Clients Acct
11,839,603 5.56%
From the above presented details it can be stated that the company is not a
family company as no family members is holding substantial shares in the company.
ii) Name of main people
Chairman – Kim Ellis
Board members –
Chris Aiken – Independent director
Mark Binns – Independent Director
Alistair Ryan – Independent director
Rod Snodgrass – Independent director
Carolyn Steele – Non-Executive Director
Dr. Noetine Whitehead – Independent director
Kevin Baker – Non-Executive Director
William Smales – Non-Executive Director
CEO – Glen Sowry
Paraphrase This Document
Need a fresh take? Get an instant paraphrase of this document with our AI Paraphraser
FINANCE FOR BUSINESS - MASTERS 4
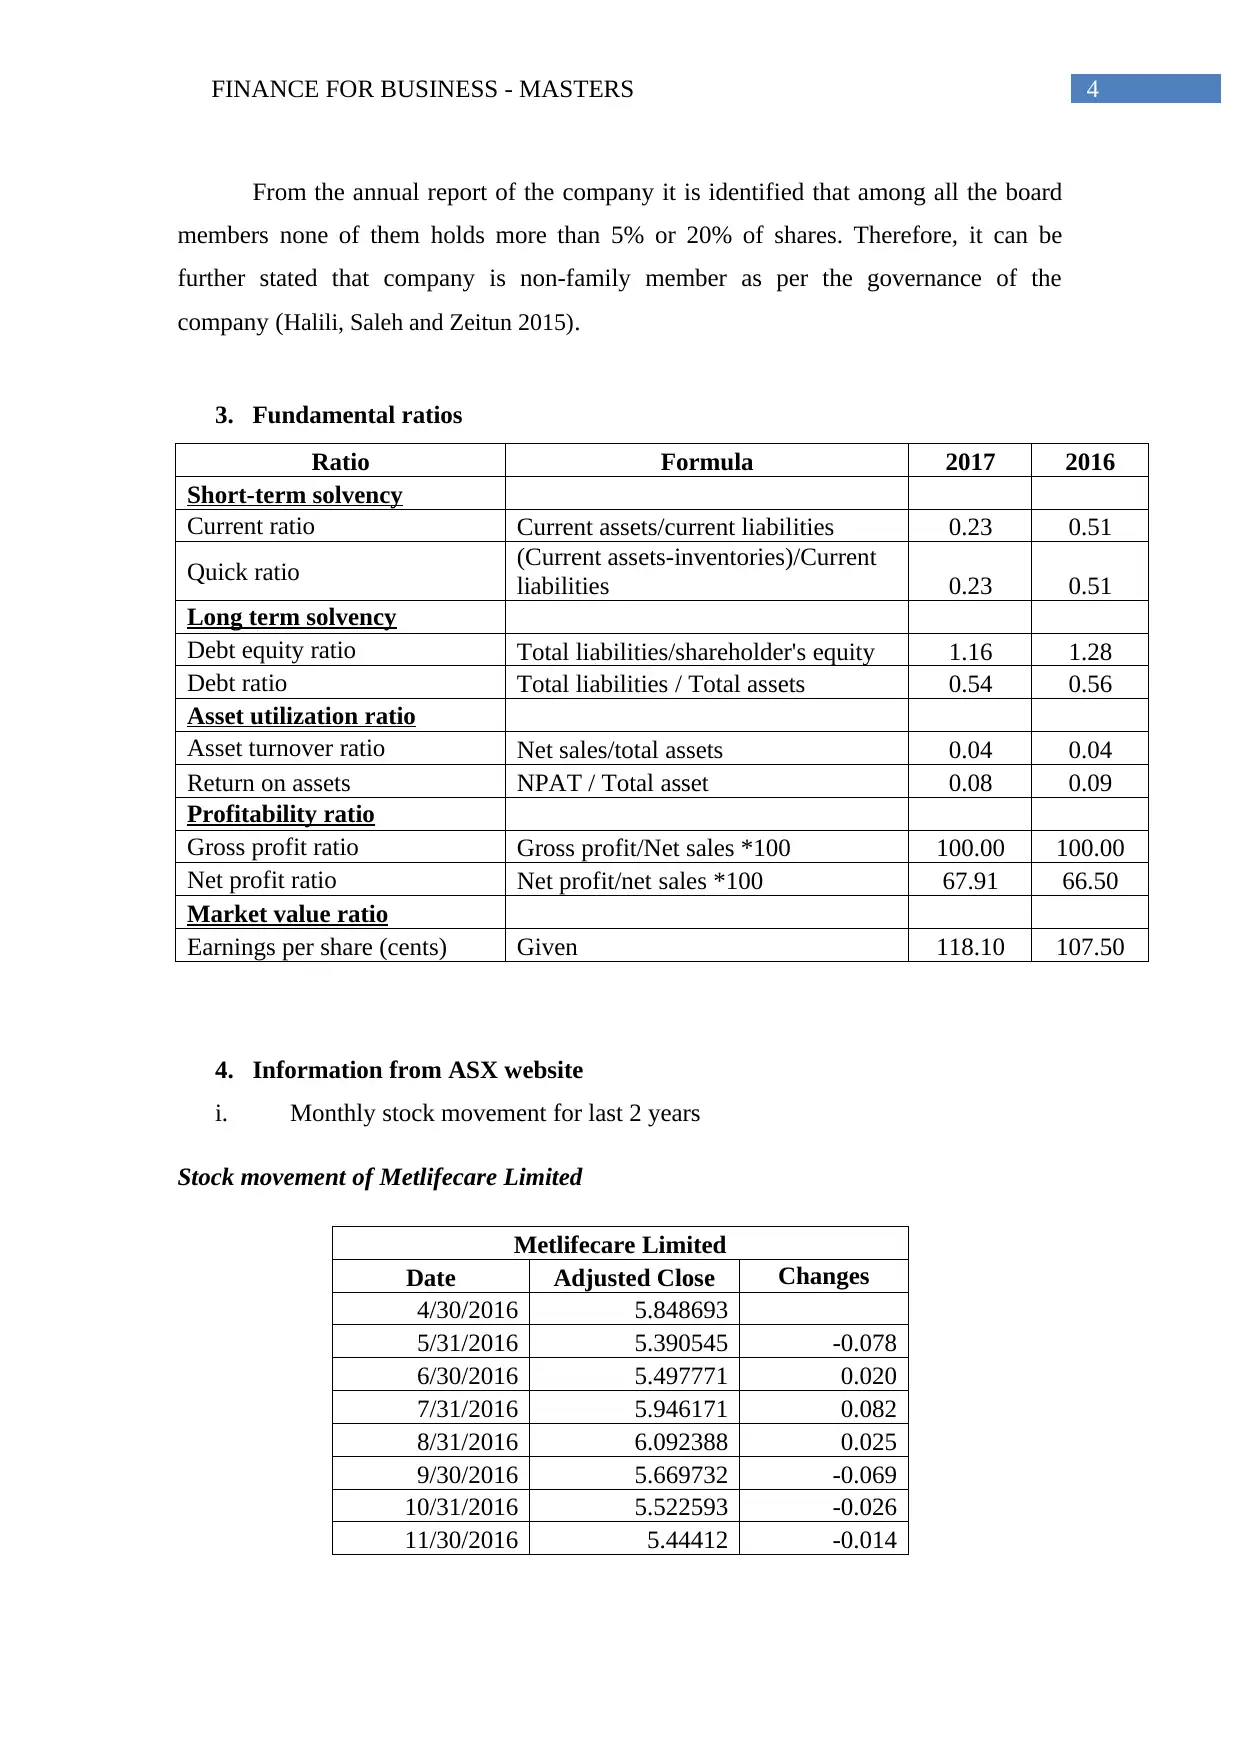
From the annual report of the company it is identified that among all the board
members none of them holds more than 5% or 20% of shares. Therefore, it can be
further stated that company is non-family member as per the governance of the
company (Halili, Saleh and Zeitun 2015).
3. Fundamental ratios
Ratio Formula 2017 2016
Short-term solvency
Current ratio Current assets/current liabilities 0.23 0.51
Quick ratio (Current assets-inventories)/Current
liabilities 0.23 0.51
Long term solvency
Debt equity ratio Total liabilities/shareholder's equity 1.16 1.28
Debt ratio Total liabilities / Total assets 0.54 0.56
Asset utilization ratio
Asset turnover ratio Net sales/total assets 0.04 0.04
Return on assets NPAT / Total asset 0.08 0.09
Profitability ratio
Gross profit ratio Gross profit/Net sales *100 100.00 100.00
Net profit ratio Net profit/net sales *100 67.91 66.50
Market value ratio
Earnings per share (cents) Given 118.10 107.50
4. Information from ASX website
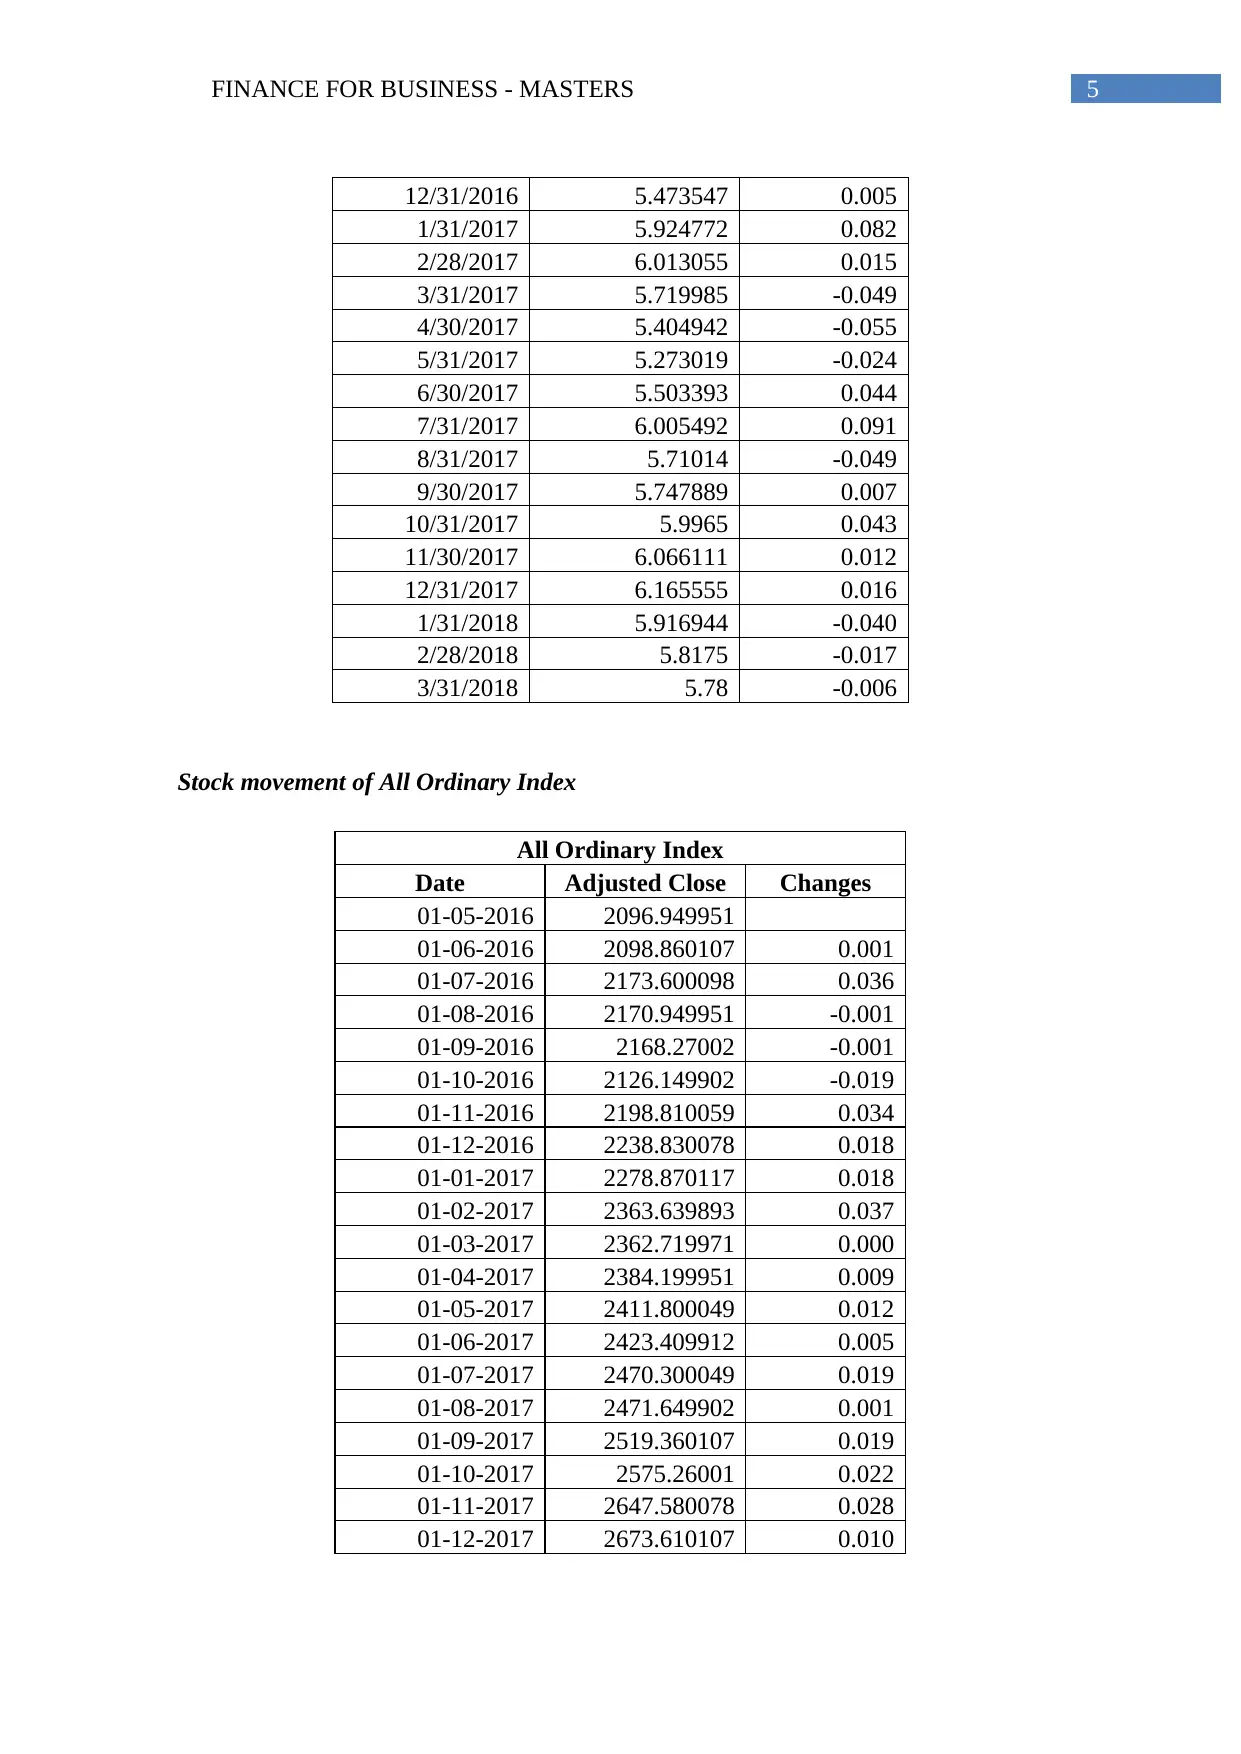
i. Monthly stock movement for last 2 years
Stock movement of Metlifecare Limited
Metlifecare Limited
Date Adjusted Close Changes
4/30/2016 5.848693
5/31/2016 5.390545 -0.078
6/30/2016 5.497771 0.020
7/31/2016 5.946171 0.082
8/31/2016 6.092388 0.025
9/30/2016 5.669732 -0.069
10/31/2016 5.522593 -0.026
11/30/2016 5.44412 -0.014
From the annual report of the company it is identified that among all the board
members none of them holds more than 5% or 20% of shares. Therefore, it can be
further stated that company is non-family member as per the governance of the
company (Halili, Saleh and Zeitun 2015).
3. Fundamental ratios
Ratio Formula 2017 2016
Short-term solvency
Current ratio Current assets/current liabilities 0.23 0.51
Quick ratio (Current assets-inventories)/Current
liabilities 0.23 0.51
Long term solvency
Debt equity ratio Total liabilities/shareholder's equity 1.16 1.28
Debt ratio Total liabilities / Total assets 0.54 0.56
Asset utilization ratio
Asset turnover ratio Net sales/total assets 0.04 0.04
Return on assets NPAT / Total asset 0.08 0.09
Profitability ratio
Gross profit ratio Gross profit/Net sales *100 100.00 100.00
Net profit ratio Net profit/net sales *100 67.91 66.50
Market value ratio
Earnings per share (cents) Given 118.10 107.50
4. Information from ASX website
i. Monthly stock movement for last 2 years
Stock movement of Metlifecare Limited
Metlifecare Limited
Date Adjusted Close Changes
4/30/2016 5.848693
5/31/2016 5.390545 -0.078
6/30/2016 5.497771 0.020
7/31/2016 5.946171 0.082
8/31/2016 6.092388 0.025
9/30/2016 5.669732 -0.069
10/31/2016 5.522593 -0.026
11/30/2016 5.44412 -0.014
FINANCE FOR BUSINESS - MASTERS 5
12/31/2016 5.473547 0.005
1/31/2017 5.924772 0.082
2/28/2017 6.013055 0.015
3/31/2017 5.719985 -0.049
4/30/2017 5.404942 -0.055
5/31/2017 5.273019 -0.024
6/30/2017 5.503393 0.044
7/31/2017 6.005492 0.091
8/31/2017 5.71014 -0.049
9/30/2017 5.747889 0.007
10/31/2017 5.9965 0.043
11/30/2017 6.066111 0.012
12/31/2017 6.165555 0.016
1/31/2018 5.916944 -0.040
2/28/2018 5.8175 -0.017
3/31/2018 5.78 -0.006
Stock movement of All Ordinary Index
All Ordinary Index
Date Adjusted Close Changes
01-05-2016 2096.949951
01-06-2016 2098.860107 0.001
01-07-2016 2173.600098 0.036
01-08-2016 2170.949951 -0.001
01-09-2016 2168.27002 -0.001
01-10-2016 2126.149902 -0.019
01-11-2016 2198.810059 0.034
01-12-2016 2238.830078 0.018
01-01-2017 2278.870117 0.018
01-02-2017 2363.639893 0.037
01-03-2017 2362.719971 0.000
01-04-2017 2384.199951 0.009
01-05-2017 2411.800049 0.012
01-06-2017 2423.409912 0.005
01-07-2017 2470.300049 0.019
01-08-2017 2471.649902 0.001
01-09-2017 2519.360107 0.019
01-10-2017 2575.26001 0.022
01-11-2017 2647.580078 0.028
01-12-2017 2673.610107 0.010
⊘ This is a preview!⊘
Do you want full access?
Subscribe today to unlock all pages.
Trusted by 1+ million students worldwide
FINANCE FOR BUSINESS - MASTERS 6
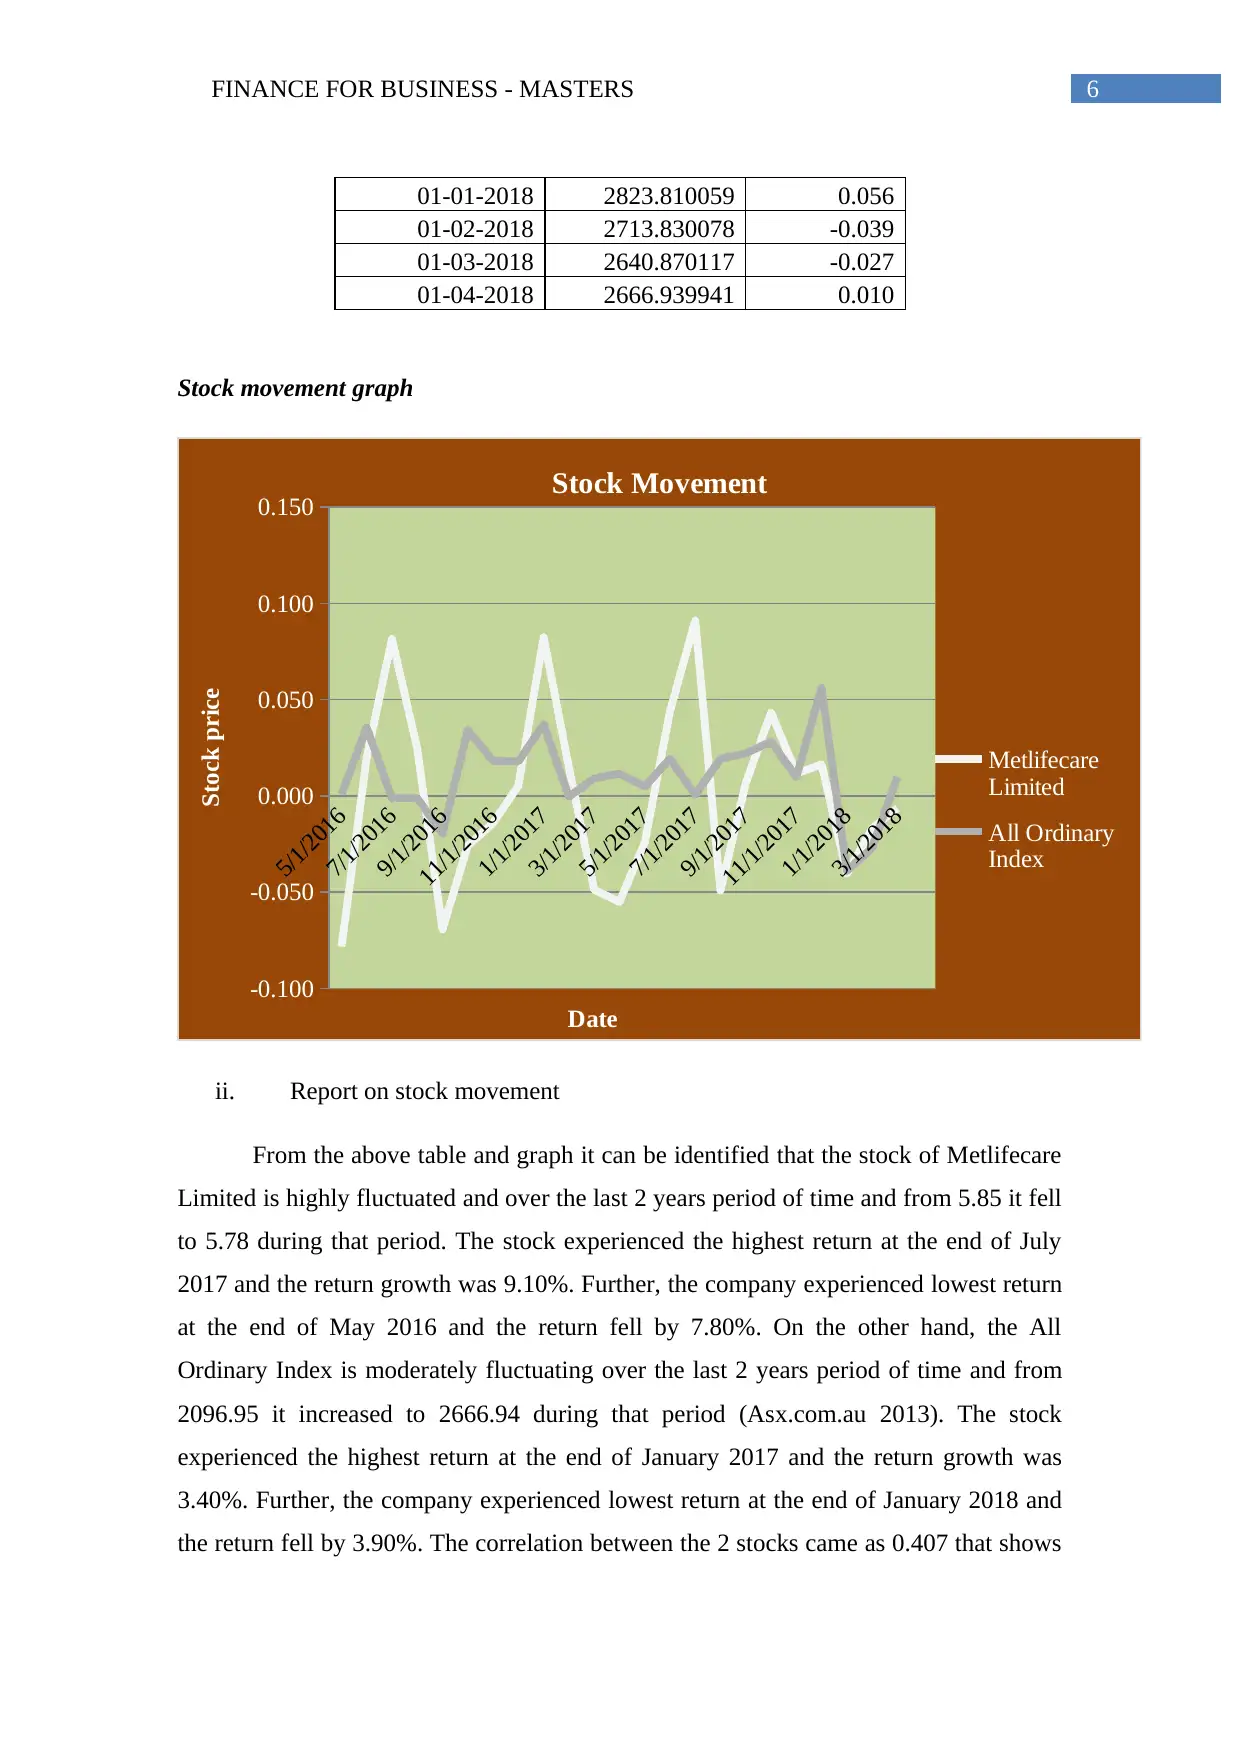
01-01-2018 2823.810059 0.056
01-02-2018 2713.830078 -0.039
01-03-2018 2640.870117 -0.027
01-04-2018 2666.939941 0.010
Stock movement graph
5/1/2016
7/1/2016
9/1/2016
11/1/2016
1/1/2017
3/1/2017
5/1/2017
7/1/2017
9/1/2017
11/1/2017
1/1/2018
3/1/2018
-0.100
-0.050
0.000
0.050
0.100
0.150 Stock Movement
Metlifecare
Limited
All Ordinary
Index
Date
Stock price
ii. Report on stock movement
From the above table and graph it can be identified that the stock of Metlifecare
Limited is highly fluctuated and over the last 2 years period of time and from 5.85 it fell
to 5.78 during that period. The stock experienced the highest return at the end of July
2017 and the return growth was 9.10%. Further, the company experienced lowest return
at the end of May 2016 and the return fell by 7.80%. On the other hand, the All
Ordinary Index is moderately fluctuating over the last 2 years period of time and from
2096.95 it increased to 2666.94 during that period (Asx.com.au 2013). The stock
experienced the highest return at the end of January 2017 and the return growth was
3.40%. Further, the company experienced lowest return at the end of January 2018 and
the return fell by 3.90%. The correlation between the 2 stocks came as 0.407 that shows
Paraphrase This Document
Need a fresh take? Get an instant paraphrase of this document with our AI Paraphraser
FINANCE FOR BUSINESS - MASTERS 7
positive correlation between 2 stocks. The positive correlation states that with the
increase in the All Ordinary Index the stock price of Metlifecare will also go up and on
the contrary, with the reduction in the All Ordinary Index the stock price of Metlifecare
will also go down (Allred 2018).
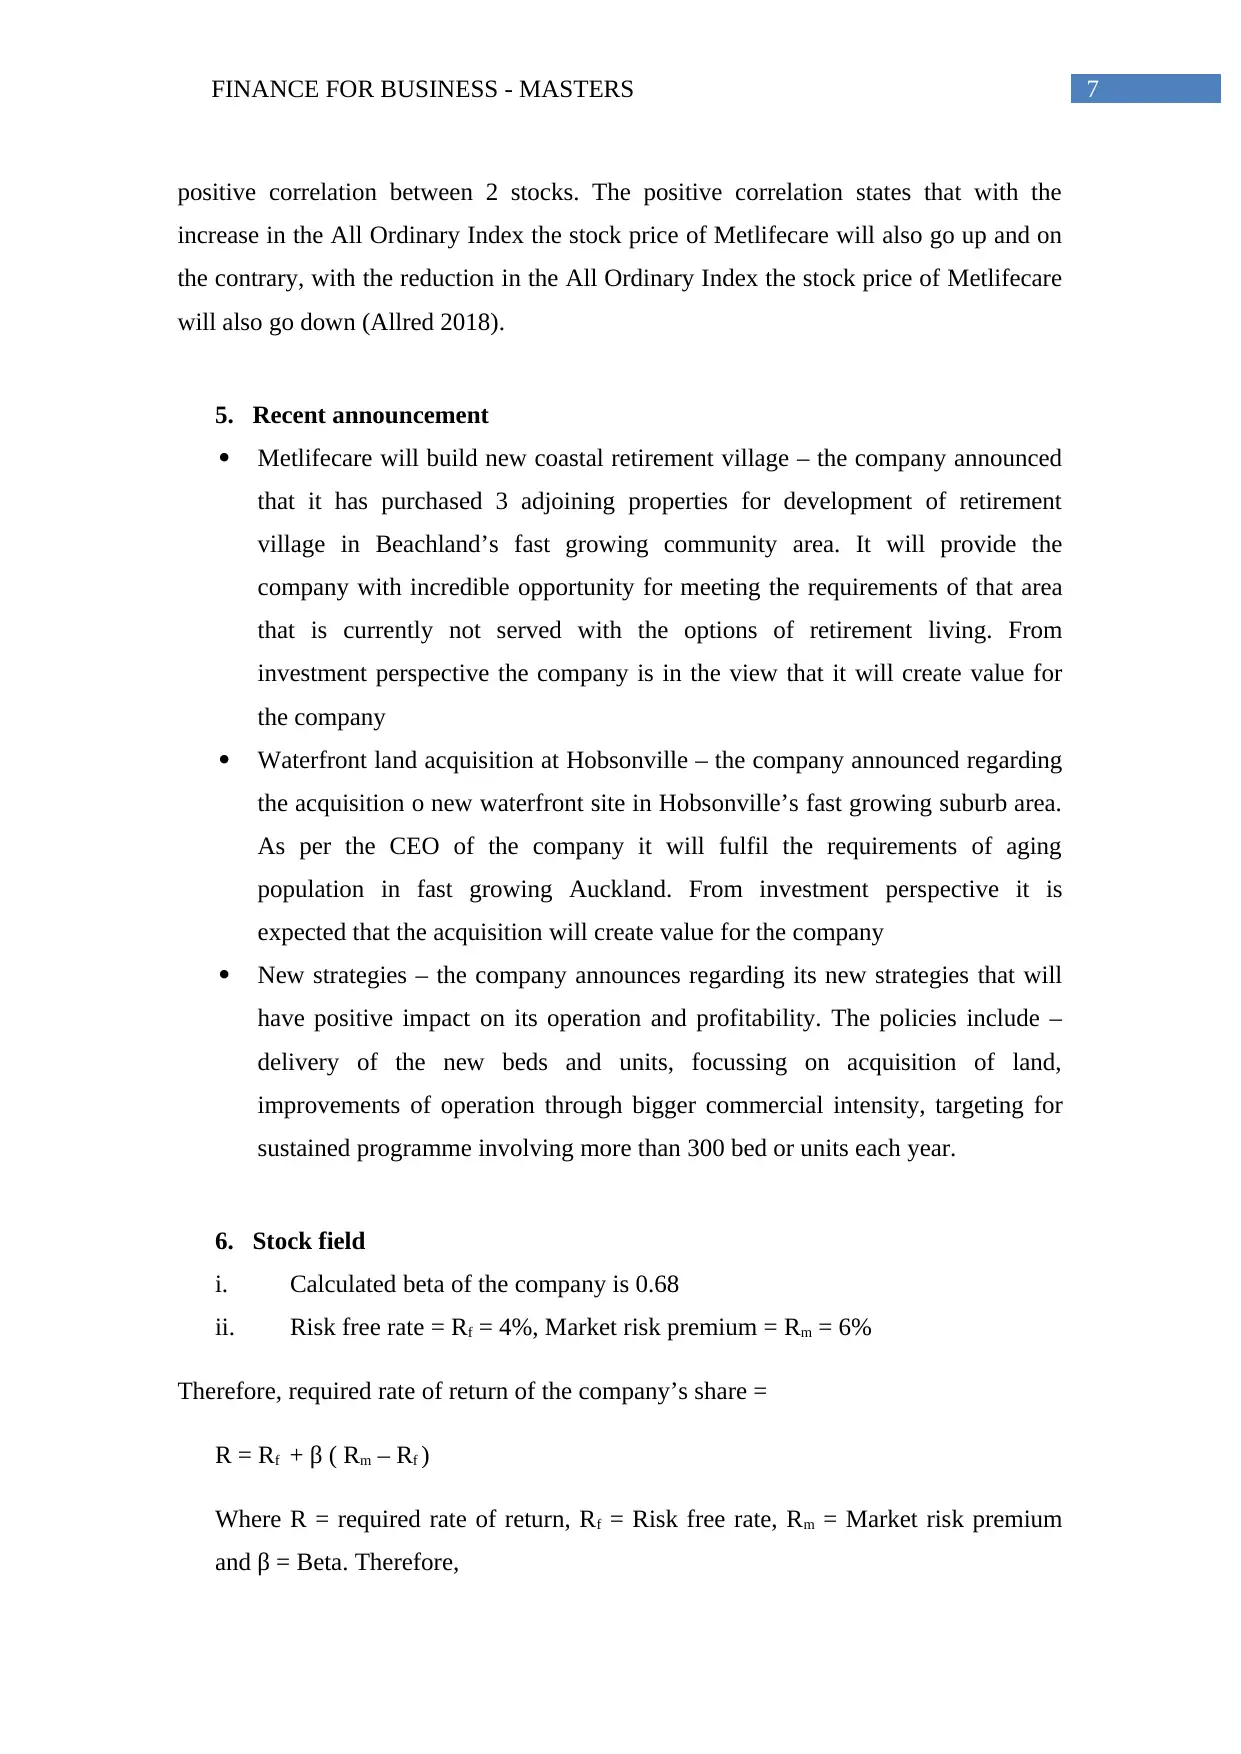
5. Recent announcement
Metlifecare will build new coastal retirement village – the company announced
that it has purchased 3 adjoining properties for development of retirement
village in Beachland’s fast growing community area. It will provide the
company with incredible opportunity for meeting the requirements of that area
that is currently not served with the options of retirement living. From
investment perspective the company is in the view that it will create value for
the company
Waterfront land acquisition at Hobsonville – the company announced regarding
the acquisition o new waterfront site in Hobsonville’s fast growing suburb area.
As per the CEO of the company it will fulfil the requirements of aging
population in fast growing Auckland. From investment perspective it is
expected that the acquisition will create value for the company
New strategies – the company announces regarding its new strategies that will
have positive impact on its operation and profitability. The policies include –
delivery of the new beds and units, focussing on acquisition of land,
improvements of operation through bigger commercial intensity, targeting for
sustained programme involving more than 300 bed or units each year.
6. Stock field
i. Calculated beta of the company is 0.68
ii. Risk free rate = Rf = 4%, Market risk premium = Rm = 6%
Therefore, required rate of return of the company’s share =
R = Rf + β ( Rm – Rf )
Where R = required rate of return, Rf = Risk free rate, Rm = Market risk premium
and β = Beta. Therefore,
positive correlation between 2 stocks. The positive correlation states that with the
increase in the All Ordinary Index the stock price of Metlifecare will also go up and on
the contrary, with the reduction in the All Ordinary Index the stock price of Metlifecare
will also go down (Allred 2018).
5. Recent announcement
Metlifecare will build new coastal retirement village – the company announced
that it has purchased 3 adjoining properties for development of retirement
village in Beachland’s fast growing community area. It will provide the
company with incredible opportunity for meeting the requirements of that area
that is currently not served with the options of retirement living. From
investment perspective the company is in the view that it will create value for
the company
Waterfront land acquisition at Hobsonville – the company announced regarding
the acquisition o new waterfront site in Hobsonville’s fast growing suburb area.
As per the CEO of the company it will fulfil the requirements of aging
population in fast growing Auckland. From investment perspective it is
expected that the acquisition will create value for the company
New strategies – the company announces regarding its new strategies that will
have positive impact on its operation and profitability. The policies include –
delivery of the new beds and units, focussing on acquisition of land,
improvements of operation through bigger commercial intensity, targeting for
sustained programme involving more than 300 bed or units each year.
6. Stock field
i. Calculated beta of the company is 0.68
ii. Risk free rate = Rf = 4%, Market risk premium = Rm = 6%
Therefore, required rate of return of the company’s share =
R = Rf + β ( Rm – Rf )
Where R = required rate of return, Rf = Risk free rate, Rm = Market risk premium
and β = Beta. Therefore,
FINANCE FOR BUSINESS - MASTERS 8
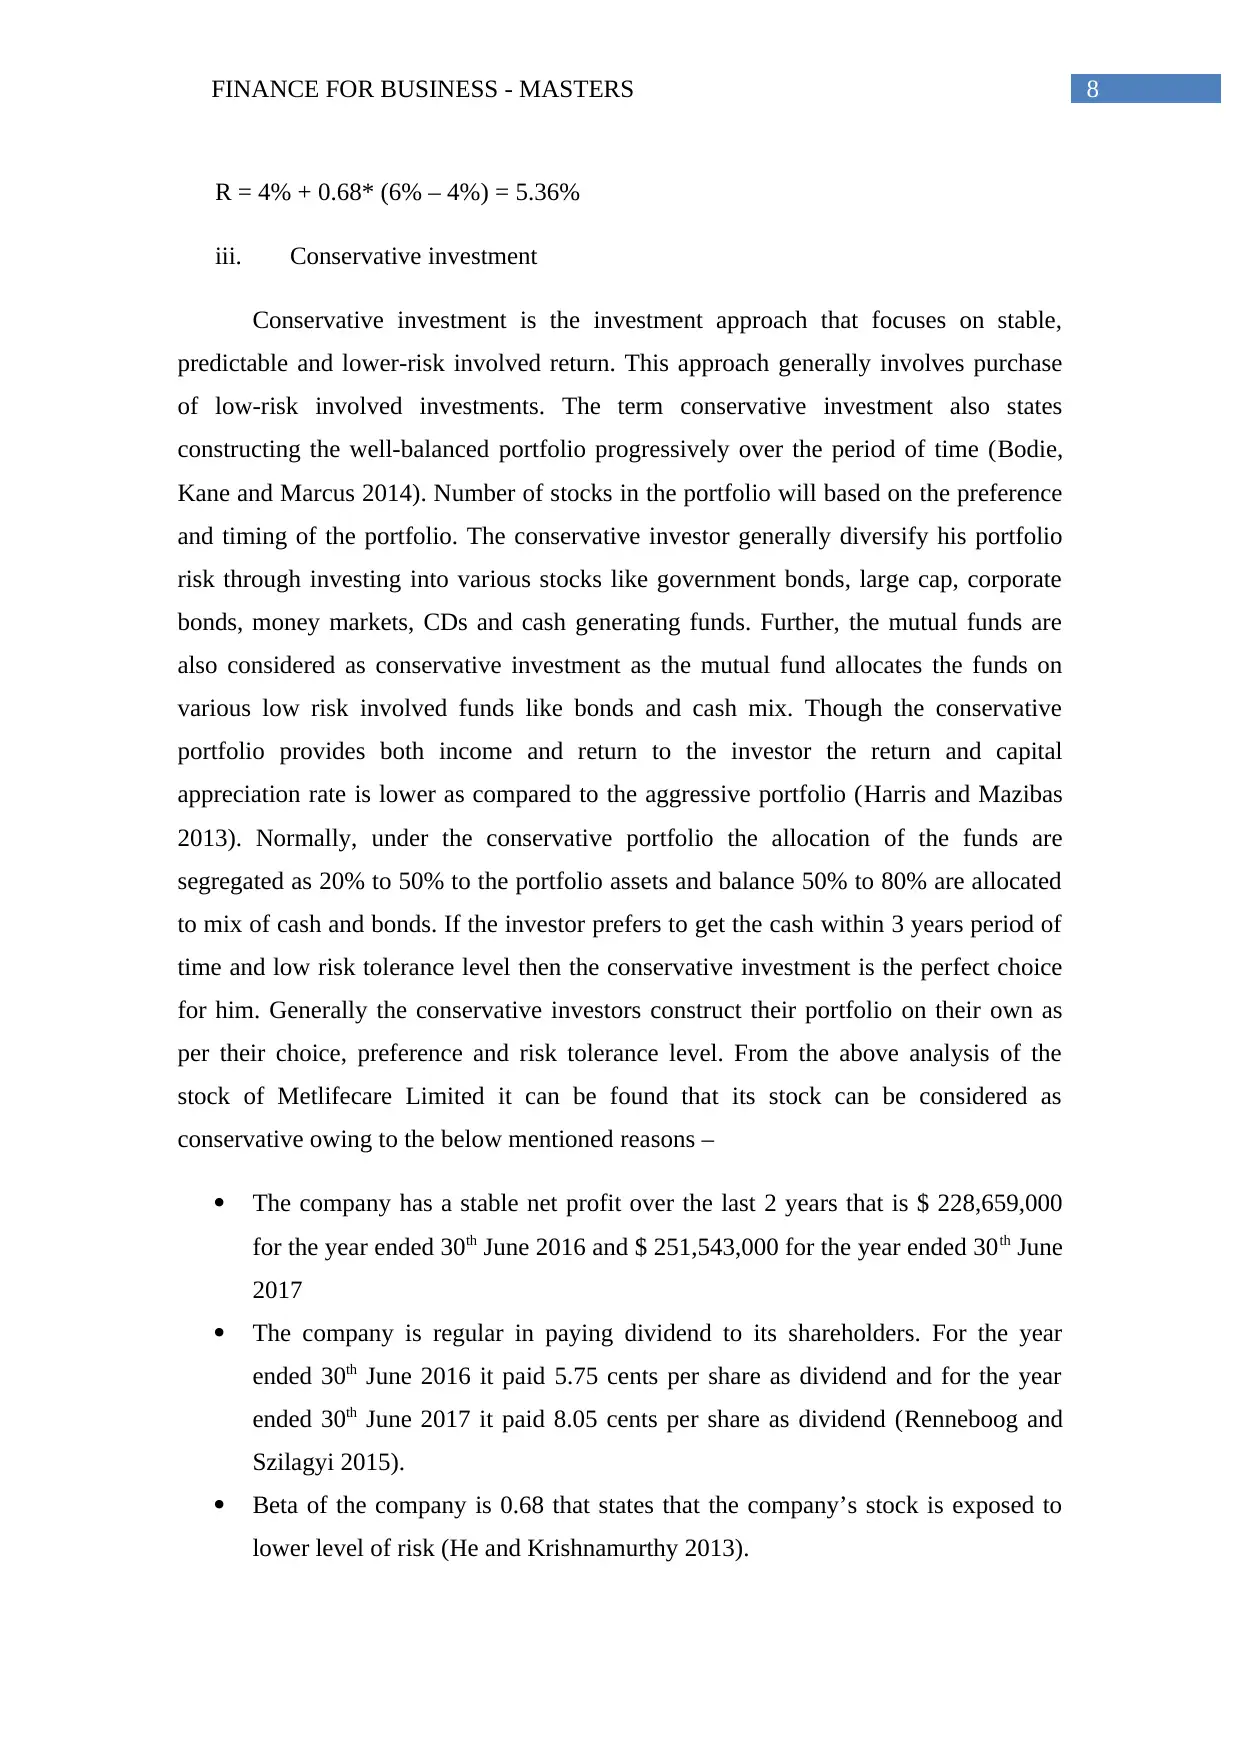
R = 4% + 0.68* (6% – 4%) = 5.36%
iii. Conservative investment
Conservative investment is the investment approach that focuses on stable,
predictable and lower-risk involved return. This approach generally involves purchase
of low-risk involved investments. The term conservative investment also states
constructing the well-balanced portfolio progressively over the period of time (Bodie,
Kane and Marcus 2014). Number of stocks in the portfolio will based on the preference
and timing of the portfolio. The conservative investor generally diversify his portfolio
risk through investing into various stocks like government bonds, large cap, corporate
bonds, money markets, CDs and cash generating funds. Further, the mutual funds are
also considered as conservative investment as the mutual fund allocates the funds on
various low risk involved funds like bonds and cash mix. Though the conservative
portfolio provides both income and return to the investor the return and capital
appreciation rate is lower as compared to the aggressive portfolio (Harris and Mazibas
2013). Normally, under the conservative portfolio the allocation of the funds are
segregated as 20% to 50% to the portfolio assets and balance 50% to 80% are allocated
to mix of cash and bonds. If the investor prefers to get the cash within 3 years period of
time and low risk tolerance level then the conservative investment is the perfect choice
for him. Generally the conservative investors construct their portfolio on their own as
per their choice, preference and risk tolerance level. From the above analysis of the
stock of Metlifecare Limited it can be found that its stock can be considered as
conservative owing to the below mentioned reasons –
The company has a stable net profit over the last 2 years that is $ 228,659,000
for the year ended 30th June 2016 and $ 251,543,000 for the year ended 30th June
2017
The company is regular in paying dividend to its shareholders. For the year
ended 30th June 2016 it paid 5.75 cents per share as dividend and for the year
ended 30th June 2017 it paid 8.05 cents per share as dividend (Renneboog and
Szilagyi 2015).
Beta of the company is 0.68 that states that the company’s stock is exposed to
lower level of risk (He and Krishnamurthy 2013).
⊘ This is a preview!⊘
Do you want full access?
Subscribe today to unlock all pages.
Trusted by 1+ million students worldwide
FINANCE FOR BUSINESS - MASTERS 9
Hence, considering all these facts stock of Metlifecare Limited is can be
considered as conservative investment.
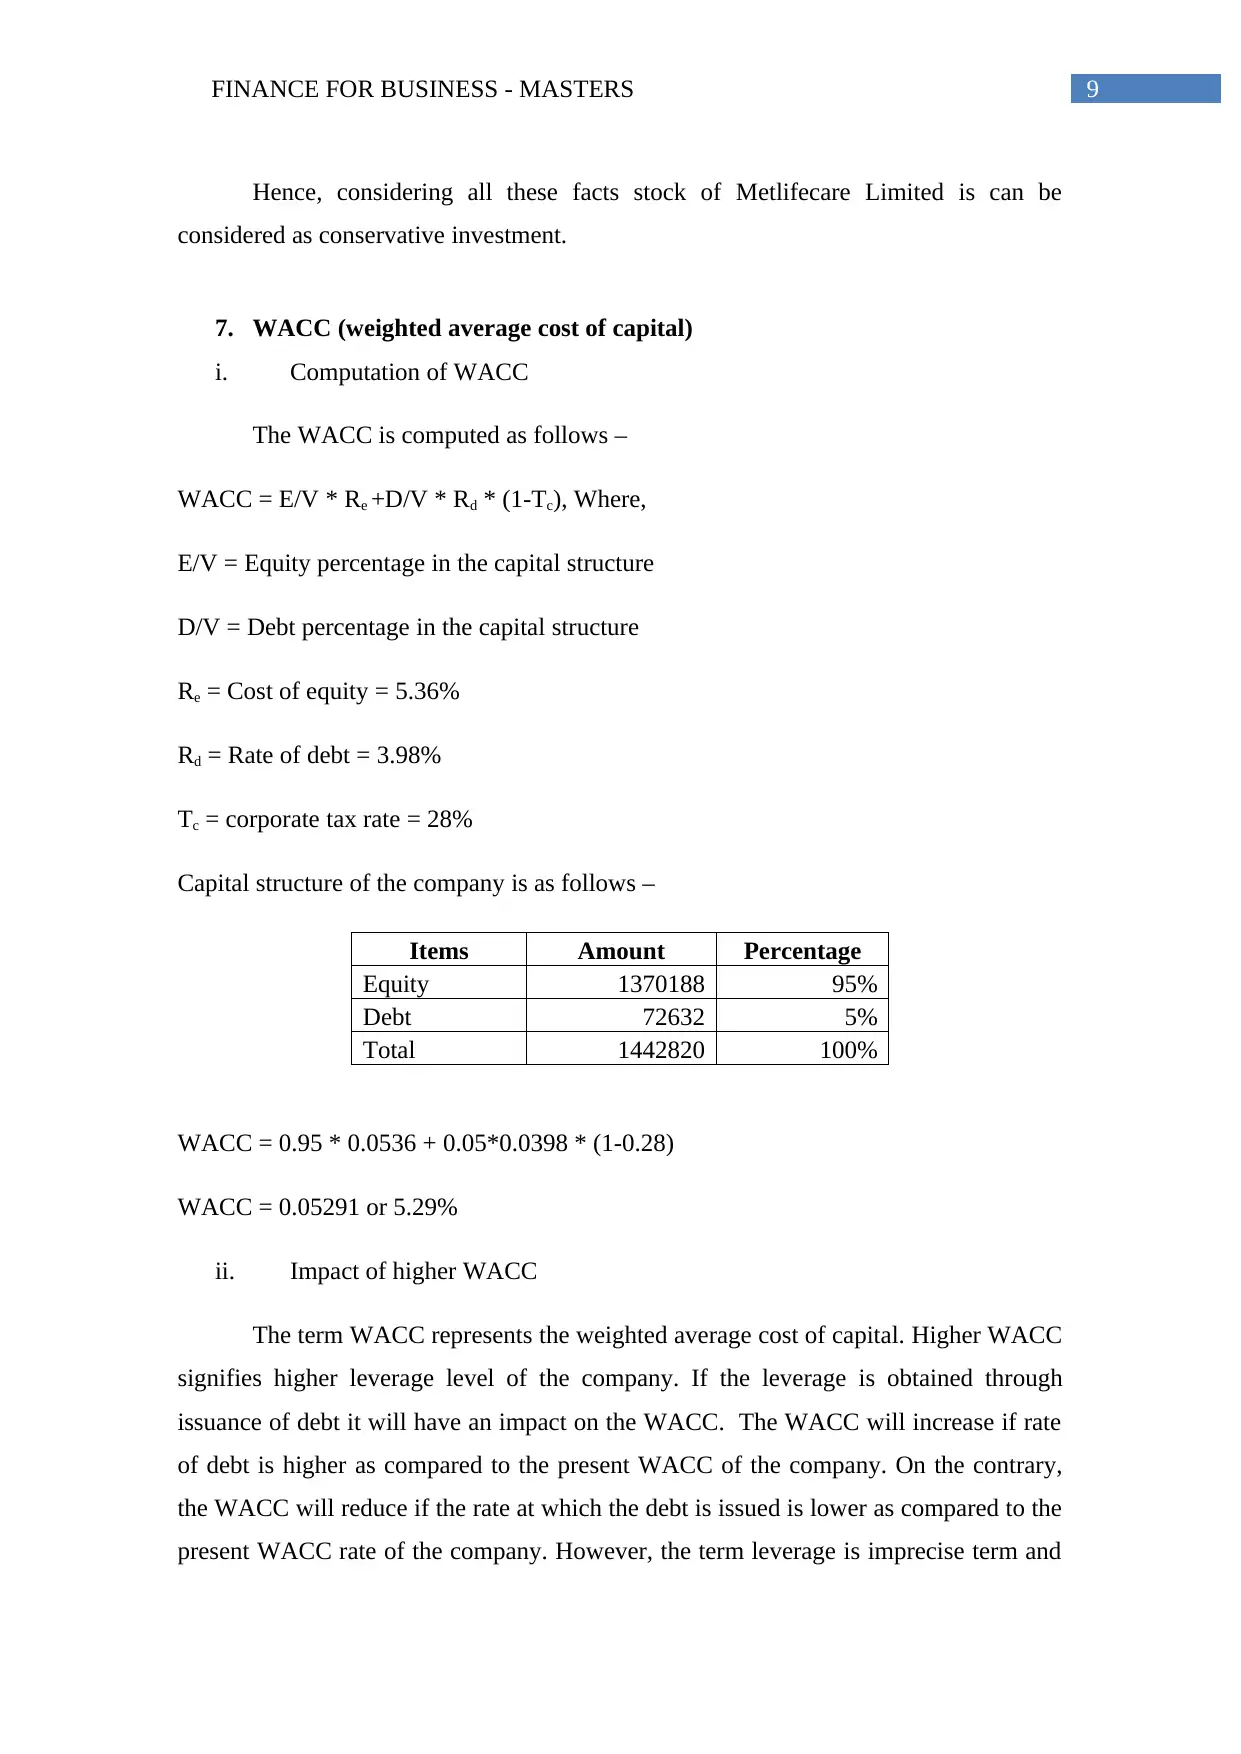
7. WACC (weighted average cost of capital)
i. Computation of WACC
The WACC is computed as follows –
WACC = E/V * Re +D/V * Rd * (1-Tc), Where,
E/V = Equity percentage in the capital structure
D/V = Debt percentage in the capital structure
Re = Cost of equity = 5.36%
Rd = Rate of debt = 3.98%
Tc = corporate tax rate = 28%
Capital structure of the company is as follows –
Items Amount Percentage
Equity 1370188 95%
Debt 72632 5%
Total 1442820 100%
WACC = 0.95 * 0.0536 + 0.05*0.0398 * (1-0.28)
WACC = 0.05291 or 5.29%
ii. Impact of higher WACC
The term WACC represents the weighted average cost of capital. Higher WACC
signifies higher leverage level of the company. If the leverage is obtained through
issuance of debt it will have an impact on the WACC. The WACC will increase if rate
of debt is higher as compared to the present WACC of the company. On the contrary,
the WACC will reduce if the rate at which the debt is issued is lower as compared to the
present WACC rate of the company. However, the term leverage is imprecise term and
Hence, considering all these facts stock of Metlifecare Limited is can be
considered as conservative investment.
7. WACC (weighted average cost of capital)
i. Computation of WACC
The WACC is computed as follows –
WACC = E/V * Re +D/V * Rd * (1-Tc), Where,
E/V = Equity percentage in the capital structure
D/V = Debt percentage in the capital structure
Re = Cost of equity = 5.36%
Rd = Rate of debt = 3.98%
Tc = corporate tax rate = 28%
Capital structure of the company is as follows –
Items Amount Percentage
Equity 1370188 95%
Debt 72632 5%
Total 1442820 100%
WACC = 0.95 * 0.0536 + 0.05*0.0398 * (1-0.28)
WACC = 0.05291 or 5.29%
ii. Impact of higher WACC
The term WACC represents the weighted average cost of capital. Higher WACC
signifies higher leverage level of the company. If the leverage is obtained through
issuance of debt it will have an impact on the WACC. The WACC will increase if rate
of debt is higher as compared to the present WACC of the company. On the contrary,
the WACC will reduce if the rate at which the debt is issued is lower as compared to the
present WACC rate of the company. However, the term leverage is imprecise term and
Paraphrase This Document
Need a fresh take? Get an instant paraphrase of this document with our AI Paraphraser
FINANCE FOR BUSINESS - MASTERS 10
can be analysed from various aspects. WACC is used to estimate the cost of finance
involved in the capital structure. Generally the company raise finance through various
sources like issuing equity, raising debt from bank or financial institution. WACC
balances the associated costs involved with the capital structure. For example, if the
WACC of the company is 10% it signifies that the company return $ 0.10 for raising
every $ 1 fund. Further, the WACC is important for operational assessment and
application of loan. Therefore, if the WACC of the company is high it tries to reduce it
through raising the fund from cheaper source. The company is also concerned regarding
if the WACC of the company is more as compared to its return rate. This signifies that
the company is losing on its debt and can search for the debt that is available at lower
cost. However, raising through debt has one advantage that the debt payment is
deductible under tax while the equity payment or dividend payment is not so.
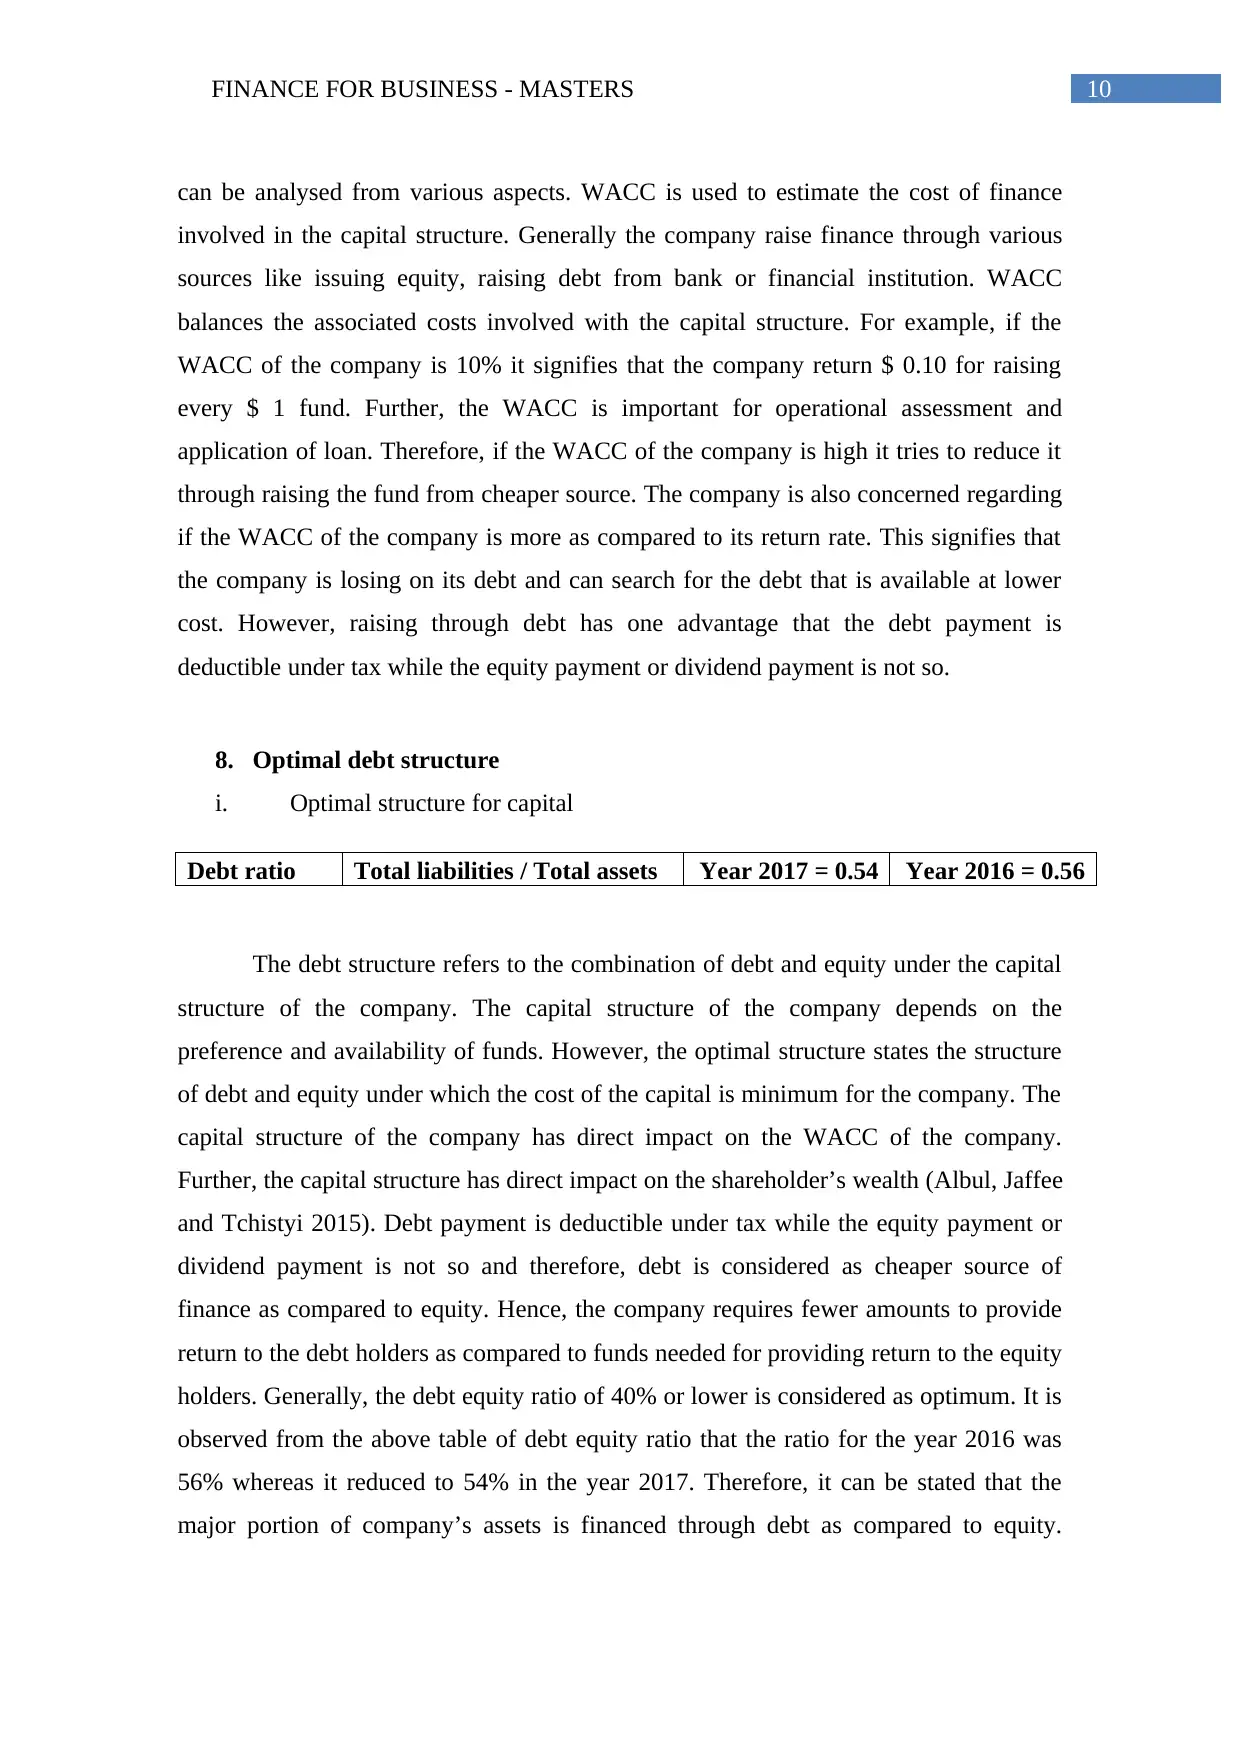
8. Optimal debt structure
i. Optimal structure for capital
Debt ratio Total liabilities / Total assets Year 2017 = 0.54 Year 2016 = 0.56
The debt structure refers to the combination of debt and equity under the capital
structure of the company. The capital structure of the company depends on the
preference and availability of funds. However, the optimal structure states the structure
of debt and equity under which the cost of the capital is minimum for the company. The
capital structure of the company has direct impact on the WACC of the company.
Further, the capital structure has direct impact on the shareholder’s wealth (Albul, Jaffee
and Tchistyi 2015). Debt payment is deductible under tax while the equity payment or
dividend payment is not so and therefore, debt is considered as cheaper source of
finance as compared to equity. Hence, the company requires fewer amounts to provide
return to the debt holders as compared to funds needed for providing return to the equity
holders. Generally, the debt equity ratio of 40% or lower is considered as optimum. It is
observed from the above table of debt equity ratio that the ratio for the year 2016 was
56% whereas it reduced to 54% in the year 2017. Therefore, it can be stated that the
major portion of company’s assets is financed through debt as compared to equity.
can be analysed from various aspects. WACC is used to estimate the cost of finance
involved in the capital structure. Generally the company raise finance through various
sources like issuing equity, raising debt from bank or financial institution. WACC
balances the associated costs involved with the capital structure. For example, if the
WACC of the company is 10% it signifies that the company return $ 0.10 for raising
every $ 1 fund. Further, the WACC is important for operational assessment and
application of loan. Therefore, if the WACC of the company is high it tries to reduce it
through raising the fund from cheaper source. The company is also concerned regarding
if the WACC of the company is more as compared to its return rate. This signifies that
the company is losing on its debt and can search for the debt that is available at lower
cost. However, raising through debt has one advantage that the debt payment is
deductible under tax while the equity payment or dividend payment is not so.
8. Optimal debt structure
i. Optimal structure for capital
Debt ratio Total liabilities / Total assets Year 2017 = 0.54 Year 2016 = 0.56
The debt structure refers to the combination of debt and equity under the capital
structure of the company. The capital structure of the company depends on the
preference and availability of funds. However, the optimal structure states the structure
of debt and equity under which the cost of the capital is minimum for the company. The
capital structure of the company has direct impact on the WACC of the company.
Further, the capital structure has direct impact on the shareholder’s wealth (Albul, Jaffee
and Tchistyi 2015). Debt payment is deductible under tax while the equity payment or
dividend payment is not so and therefore, debt is considered as cheaper source of
finance as compared to equity. Hence, the company requires fewer amounts to provide
return to the debt holders as compared to funds needed for providing return to the equity
holders. Generally, the debt equity ratio of 40% or lower is considered as optimum. It is
observed from the above table of debt equity ratio that the ratio for the year 2016 was
56% whereas it reduced to 54% in the year 2017. Therefore, it can be stated that the
major portion of company’s assets is financed through debt as compared to equity.
FINANCE FOR BUSINESS - MASTERS 11
Therefore, to maintain the optimum capital structure the company shall pay off its
borrowing and for further requirement of fund it shall borrow through equity instead of
equity (Peirson et al. 2014).
ii. Gearing ratio
Gearing ratio is the general segregation that states the financial ratio that
compares the shareholder’s equity of the company as compared to the borrowed funds.
It is the measurement of the financial leverage of the entity and this one of the most well
known method for measuring the financial health of the company. The debt equity ratio
can be used to measure the leverage of the company (Akeem et al. 2014). Thus,
companies that have higher level of gearing ratio are required higher amount for
fulfilling the debt obligation. As it can be seen from the annual report of the company
that the company has 95% of equity and only 5% of debt in the capital structure it is
lower leveraged (McLean and Zhao 2014). However, it is further found that to maintain
the gearing ratio the company paid off the interest bearing liabilities as the amount of
debt for the company has been reduced from $ 80,798,000 to $ 72,632,000 over the year
from 2016 to 2017. However, the company did not issue any new equity shares as the
amount of equity share for the year remained same at $ 306,895,000. Moreover, the
company did not mention anything regarding its capital structure or gearing ratio in its
director’s report (Bendell and Doyle 2017).
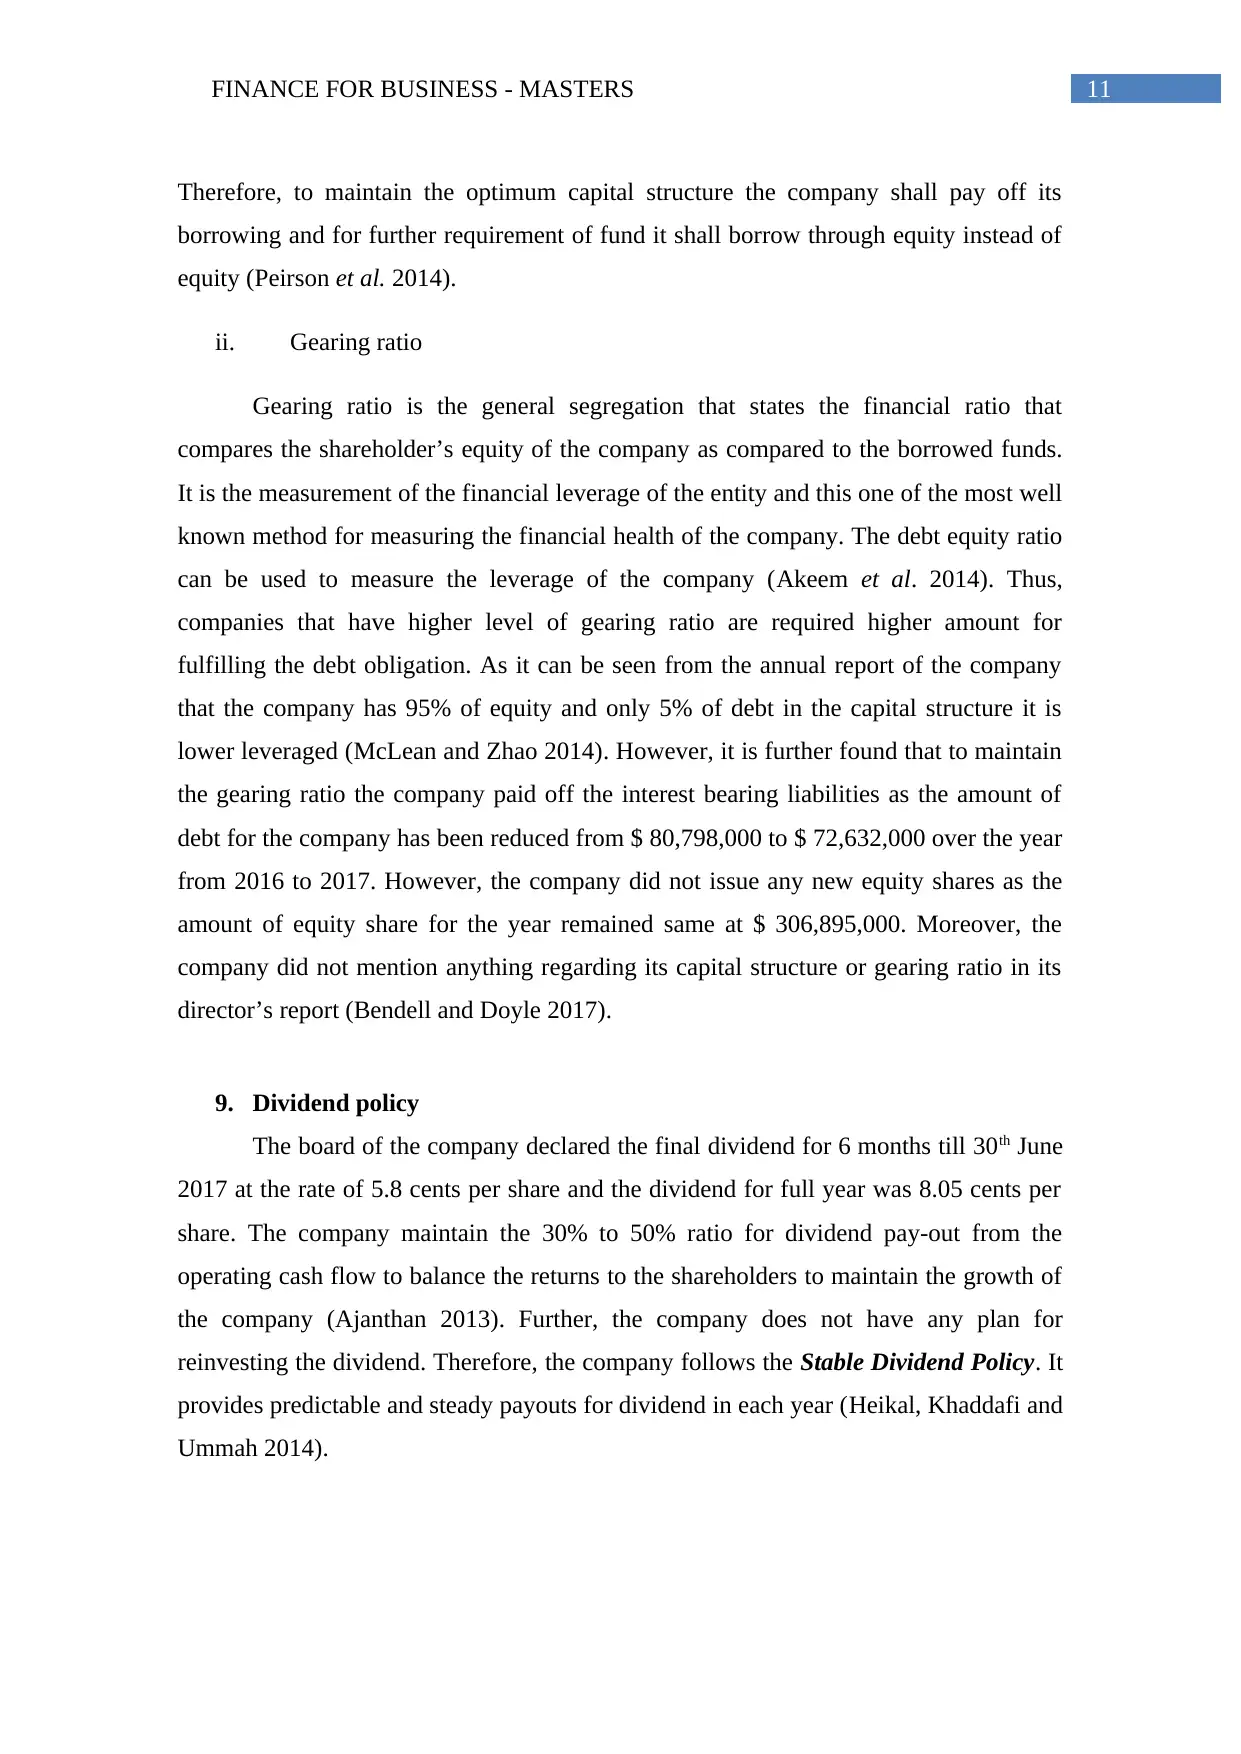
9. Dividend policy
The board of the company declared the final dividend for 6 months till 30th June
2017 at the rate of 5.8 cents per share and the dividend for full year was 8.05 cents per
share. The company maintain the 30% to 50% ratio for dividend pay-out from the
operating cash flow to balance the returns to the shareholders to maintain the growth of
the company (Ajanthan 2013). Further, the company does not have any plan for
reinvesting the dividend. Therefore, the company follows the Stable Dividend Policy. It
provides predictable and steady payouts for dividend in each year (Heikal, Khaddafi and
Ummah 2014).
Therefore, to maintain the optimum capital structure the company shall pay off its
borrowing and for further requirement of fund it shall borrow through equity instead of
equity (Peirson et al. 2014).
ii. Gearing ratio
Gearing ratio is the general segregation that states the financial ratio that
compares the shareholder’s equity of the company as compared to the borrowed funds.
It is the measurement of the financial leverage of the entity and this one of the most well
known method for measuring the financial health of the company. The debt equity ratio
can be used to measure the leverage of the company (Akeem et al. 2014). Thus,
companies that have higher level of gearing ratio are required higher amount for
fulfilling the debt obligation. As it can be seen from the annual report of the company
that the company has 95% of equity and only 5% of debt in the capital structure it is
lower leveraged (McLean and Zhao 2014). However, it is further found that to maintain
the gearing ratio the company paid off the interest bearing liabilities as the amount of
debt for the company has been reduced from $ 80,798,000 to $ 72,632,000 over the year
from 2016 to 2017. However, the company did not issue any new equity shares as the
amount of equity share for the year remained same at $ 306,895,000. Moreover, the
company did not mention anything regarding its capital structure or gearing ratio in its
director’s report (Bendell and Doyle 2017).
9. Dividend policy
The board of the company declared the final dividend for 6 months till 30th June
2017 at the rate of 5.8 cents per share and the dividend for full year was 8.05 cents per
share. The company maintain the 30% to 50% ratio for dividend pay-out from the
operating cash flow to balance the returns to the shareholders to maintain the growth of
the company (Ajanthan 2013). Further, the company does not have any plan for
reinvesting the dividend. Therefore, the company follows the Stable Dividend Policy. It
provides predictable and steady payouts for dividend in each year (Heikal, Khaddafi and
Ummah 2014).
⊘ This is a preview!⊘
Do you want full access?
Subscribe today to unlock all pages.
Trusted by 1+ million students worldwide
1 out of 15
Related Documents


Your All-in-One AI-Powered Toolkit for Academic Success.
+13062052269
info@desklib.com
Available 24*7 on WhatsApp / Email
![[object Object]](/_next/static/media/star-bottom.7253800d.svg)
Unlock your academic potential
Copyright © 2020–2026 A2Z Services. All Rights Reserved. Developed and managed by ZUCOL.