Accounting and Finance Report: Saturn Pet Care and ARB Ltd
VerifiedAdded on 2021/05/30
|14
|2068
|143
Report
AI Summary
This report is divided into two parts. Part A focuses on Saturn Pet Care, evaluating two production site options (Bathurst and Wodonga) for a new dog food product using capital budgeting techniques such as Net Present Value (NPV), Profitability Index, and Payback Period. The analysis concludes that the Wodonga site is the better investment. The report also addresses issues such as product cannibalization, excessive sales estimations, and the proper approach to including initial costs in NPV calculations. Part B shifts to ARB Ltd, analyzing its capital structure, which currently consists solely of equity. It calculates the Weighted Average Cost of Capital (WACC) and Cost of Equity under the Capital Asset Pricing Model (CAPM), and compares ARB Ltd's capital structure to that of Modine Ltd, a competitor. The report uses financial ratios to assess ARB Ltd's performance and suggests recommendations for improving its capital structure and wealth maximization strategies, including incorporating debt capital. The report concludes that ARB Ltd needs to improve its capital structure to mitigate risks and maximize shareholder wealth.
Running head: ACCOUNTING AND FINANCE
Accounting and Finance
Name of the Student:
Name of the University:
Author’s Note:
Accounting and Finance
Name of the Student:
Name of the University:
Author’s Note:
Paraphrase This Document
Need a fresh take? Get an instant paraphrase of this document with our AI Paraphraser
1
ACCOUNTING AND FINANCE
Executive Summary
The assignment has tow parts which are Part A and Part B. Part A of the assignment deals with
Saturn Pet care which is engaged in producing products for pets. In recent business expansion
strategy, the company wants to introduce a new dog food product in the market and for
production site option it has two available options which are Bathurst site and Wodonga site. Part
A will be conducting Capital Budgeting Techniques for Selection of the best site for production.
Part B of the assignment will be analysing the capital structure of ARB ltd and also compare the
capital structure with a similar company from the same industry. The assignment will also
suggest an alternative capital structure for ARB ltd.
2
ACCOUNTING AND FINANCE
Table of Contents
Part A...............................................................................................................................................3
Product Cannibalization...............................................................................................................5
Excessive Sales Recorded............................................................................................................5
Inclusion of Original Cost of Plant in NPV Analysis..................................................................5
Part B...............................................................................................................................................5
Introduction..................................................................................................................................5
Discussions..................................................................................................................................6
Capital Structure and Cost of Capital..........................................................................................6
Weighted Average Cost of Capital..............................................................................................6
Cost of Equity under CAPM........................................................................................................7
Comparison between ARB ltd and Modine ltd............................................................................8
Financial Ratios of ARB Ltd.......................................................................................................9
Change in Capital Structure.......................................................................................................10
Wealth Maximization................................................................................................................11
Recommendations..........................................................................................................................11
Conclusion.....................................................................................................................................12
Reference.......................................................................................................................................13
⊘ This is a preview!⊘
Do you want full access?
Subscribe today to unlock all pages.
Trusted by 1+ million students worldwide
3
ACCOUNTING AND FINANCE
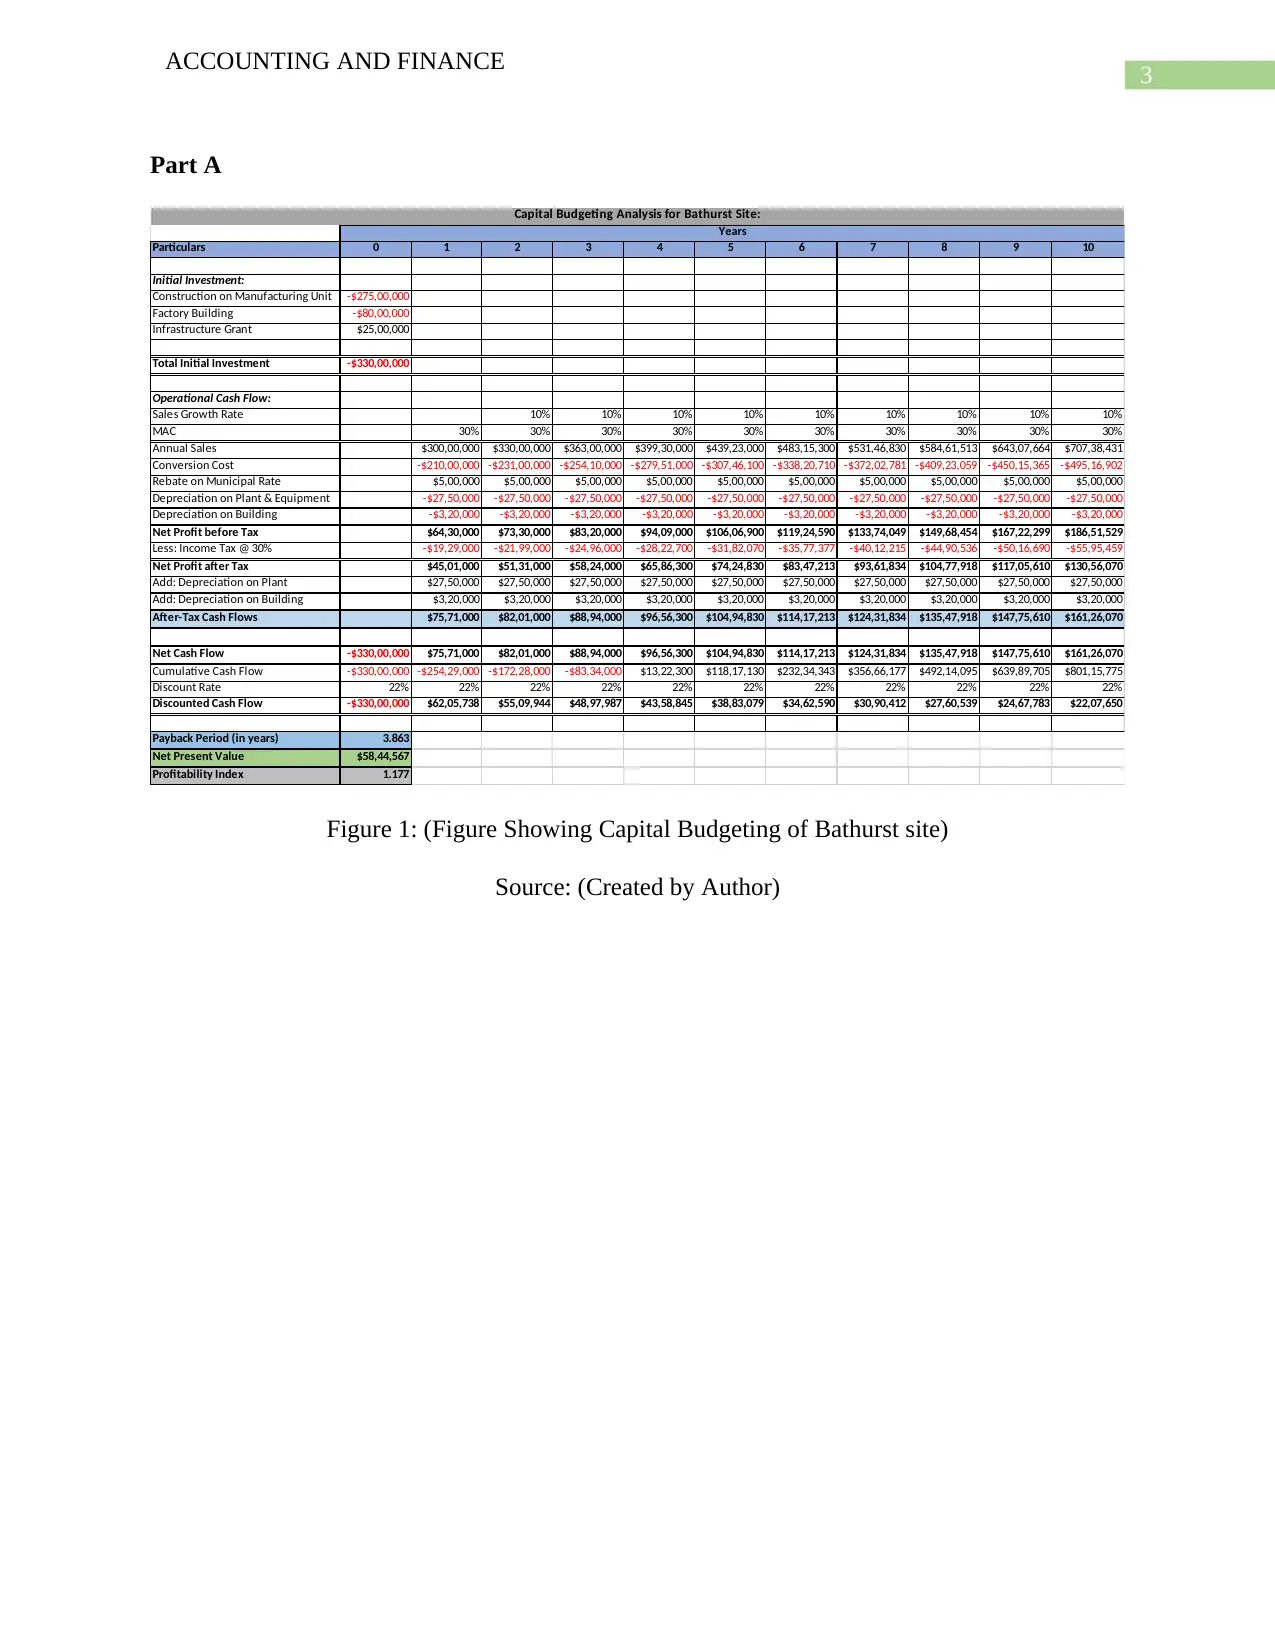
Part A
Particulars 0 1 2 3 4 5 6 7 8 9 10
Initial Investment:
Construction on Manufacturing Unit -$275,00,000
Factory Building -$80,00,000
Infrastructure Grant $25,00,000
Total Initial Investment -$330,00,000
Operational Cash Flow:
Sales Growth Rate 10% 10% 10% 10% 10% 10% 10% 10% 10%
MAC 30% 30% 30% 30% 30% 30% 30% 30% 30% 30%
Annual Sales $300,00,000 $330,00,000 $363,00,000 $399,30,000 $439,23,000 $483,15,300 $531,46,830 $584,61,513 $643,07,664 $707,38,431
Conversion Cost -$210,00,000 -$231,00,000 -$254,10,000 -$279,51,000 -$307,46,100 -$338,20,710 -$372,02,781 -$409,23,059 -$450,15,365 -$495,16,902
Rebate on Municipal Rate $5,00,000 $5,00,000 $5,00,000 $5,00,000 $5,00,000 $5,00,000 $5,00,000 $5,00,000 $5,00,000 $5,00,000
Depreciation on Plant & Equipment -$27,50,000 -$27,50,000 -$27,50,000 -$27,50,000 -$27,50,000 -$27,50,000 -$27,50,000 -$27,50,000 -$27,50,000 -$27,50,000
Depreciation on Building -$3,20,000 -$3,20,000 -$3,20,000 -$3,20,000 -$3,20,000 -$3,20,000 -$3,20,000 -$3,20,000 -$3,20,000 -$3,20,000
Net Profit before Tax $64,30,000 $73,30,000 $83,20,000 $94,09,000 $106,06,900 $119,24,590 $133,74,049 $149,68,454 $167,22,299 $186,51,529
Less: Income Tax @ 30% -$19,29,000 -$21,99,000 -$24,96,000 -$28,22,700 -$31,82,070 -$35,77,377 -$40,12,215 -$44,90,536 -$50,16,690 -$55,95,459
Net Profit after Tax $45,01,000 $51,31,000 $58,24,000 $65,86,300 $74,24,830 $83,47,213 $93,61,834 $104,77,918 $117,05,610 $130,56,070
Add: Depreciation on Plant $27,50,000 $27,50,000 $27,50,000 $27,50,000 $27,50,000 $27,50,000 $27,50,000 $27,50,000 $27,50,000 $27,50,000
Add: Depreciation on Building $3,20,000 $3,20,000 $3,20,000 $3,20,000 $3,20,000 $3,20,000 $3,20,000 $3,20,000 $3,20,000 $3,20,000
After-Tax Cash Flows $75,71,000 $82,01,000 $88,94,000 $96,56,300 $104,94,830 $114,17,213 $124,31,834 $135,47,918 $147,75,610 $161,26,070
Net Cash Flow -$330,00,000 $75,71,000 $82,01,000 $88,94,000 $96,56,300 $104,94,830 $114,17,213 $124,31,834 $135,47,918 $147,75,610 $161,26,070
Cumulative Cash Flow -$330,00,000 -$254,29,000 -$172,28,000 -$83,34,000 $13,22,300 $118,17,130 $232,34,343 $356,66,177 $492,14,095 $639,89,705 $801,15,775
Discount Rate 22% 22% 22% 22% 22% 22% 22% 22% 22% 22% 22%
Discounted Cash Flow -$330,00,000 $62,05,738 $55,09,944 $48,97,987 $43,58,845 $38,83,079 $34,62,590 $30,90,412 $27,60,539 $24,67,783 $22,07,650
Payback Period (in years) 3.863
Net Present Value $58,44,567
Profitability Index 1.177
Years
Capital Budgeting Analysis for Bathurst Site:
Figure 1: (Figure Showing Capital Budgeting of Bathurst site)
Source: (Created by Author)
ACCOUNTING AND FINANCE
Part A
Particulars 0 1 2 3 4 5 6 7 8 9 10
Initial Investment:
Construction on Manufacturing Unit -$275,00,000
Factory Building -$80,00,000
Infrastructure Grant $25,00,000
Total Initial Investment -$330,00,000
Operational Cash Flow:
Sales Growth Rate 10% 10% 10% 10% 10% 10% 10% 10% 10%
MAC 30% 30% 30% 30% 30% 30% 30% 30% 30% 30%
Annual Sales $300,00,000 $330,00,000 $363,00,000 $399,30,000 $439,23,000 $483,15,300 $531,46,830 $584,61,513 $643,07,664 $707,38,431
Conversion Cost -$210,00,000 -$231,00,000 -$254,10,000 -$279,51,000 -$307,46,100 -$338,20,710 -$372,02,781 -$409,23,059 -$450,15,365 -$495,16,902
Rebate on Municipal Rate $5,00,000 $5,00,000 $5,00,000 $5,00,000 $5,00,000 $5,00,000 $5,00,000 $5,00,000 $5,00,000 $5,00,000
Depreciation on Plant & Equipment -$27,50,000 -$27,50,000 -$27,50,000 -$27,50,000 -$27,50,000 -$27,50,000 -$27,50,000 -$27,50,000 -$27,50,000 -$27,50,000
Depreciation on Building -$3,20,000 -$3,20,000 -$3,20,000 -$3,20,000 -$3,20,000 -$3,20,000 -$3,20,000 -$3,20,000 -$3,20,000 -$3,20,000
Net Profit before Tax $64,30,000 $73,30,000 $83,20,000 $94,09,000 $106,06,900 $119,24,590 $133,74,049 $149,68,454 $167,22,299 $186,51,529
Less: Income Tax @ 30% -$19,29,000 -$21,99,000 -$24,96,000 -$28,22,700 -$31,82,070 -$35,77,377 -$40,12,215 -$44,90,536 -$50,16,690 -$55,95,459
Net Profit after Tax $45,01,000 $51,31,000 $58,24,000 $65,86,300 $74,24,830 $83,47,213 $93,61,834 $104,77,918 $117,05,610 $130,56,070
Add: Depreciation on Plant $27,50,000 $27,50,000 $27,50,000 $27,50,000 $27,50,000 $27,50,000 $27,50,000 $27,50,000 $27,50,000 $27,50,000
Add: Depreciation on Building $3,20,000 $3,20,000 $3,20,000 $3,20,000 $3,20,000 $3,20,000 $3,20,000 $3,20,000 $3,20,000 $3,20,000
After-Tax Cash Flows $75,71,000 $82,01,000 $88,94,000 $96,56,300 $104,94,830 $114,17,213 $124,31,834 $135,47,918 $147,75,610 $161,26,070
Net Cash Flow -$330,00,000 $75,71,000 $82,01,000 $88,94,000 $96,56,300 $104,94,830 $114,17,213 $124,31,834 $135,47,918 $147,75,610 $161,26,070
Cumulative Cash Flow -$330,00,000 -$254,29,000 -$172,28,000 -$83,34,000 $13,22,300 $118,17,130 $232,34,343 $356,66,177 $492,14,095 $639,89,705 $801,15,775
Discount Rate 22% 22% 22% 22% 22% 22% 22% 22% 22% 22% 22%
Discounted Cash Flow -$330,00,000 $62,05,738 $55,09,944 $48,97,987 $43,58,845 $38,83,079 $34,62,590 $30,90,412 $27,60,539 $24,67,783 $22,07,650
Payback Period (in years) 3.863
Net Present Value $58,44,567
Profitability Index 1.177
Years
Capital Budgeting Analysis for Bathurst Site:
Figure 1: (Figure Showing Capital Budgeting of Bathurst site)
Source: (Created by Author)
Paraphrase This Document
Need a fresh take? Get an instant paraphrase of this document with our AI Paraphraser
4
ACCOUNTING AND FINANCE
Particulars 0 1 2 3 4 5 6 7 8 9 10
Initial Investment:
Construction on Manufacturing Unit -$275,00,000
Value of Wodonga Site
Total Initial Investment -$275,00,000
Operational Cash Flow:
Sales Growth Rate 10% 10% 10% 10% 10% 10% 10% 10% 10%
MAC 30% 30% 30% 30% 30% 30% 30% 30% 30% 30%
Annual Sales $300,00,000 $330,00,000 $363,00,000 $399,30,000 $439,23,000 $483,15,300 $531,46,830 $584,61,513 $643,07,664 $707,38,431
Conversion Cost -$210,00,000 -$231,00,000 -$254,10,000 -$279,51,000 -$307,46,100 -$338,20,710 -$372,02,781 -$409,23,059 -$450,15,365 -$495,16,902
Depreciation on Plant & Equipment -$27,50,000 -$27,50,000 -$27,50,000 -$27,50,000 -$27,50,000 -$27,50,000 -$27,50,000 -$27,50,000 -$27,50,000 -$27,50,000
Depreciation on Building $0 $0 $0 $0 $0 $0 $0 $0 $0 $0
Net Profit before Tax $62,50,000 $71,50,000 $81,40,000 $92,29,000 $104,26,900 $117,44,590 $131,94,049 $147,88,454 $165,42,299 $184,71,529
Less: Income Tax @ 30% -$18,75,000 -$21,45,000 -$24,42,000 -$27,68,700 -$31,28,070 -$35,23,377 -$39,58,215 -$44,36,536 -$49,62,690 -$55,41,459
Net Profit after Tax $43,75,000 $50,05,000 $56,98,000 $64,60,300 $72,98,830 $82,21,213 $92,35,834 $103,51,918 $115,79,610 $129,30,070
Add: Depreciation on Plant $27,50,000 $27,50,000 $27,50,000 $27,50,000 $27,50,000 $27,50,000 $27,50,000 $27,50,000 $27,50,000 $27,50,000
Add: Depreciation on Building $0 $0 $0 $0 $0 $0 $0 $0 $0 $0
After-Tax Cash Flows $71,25,000 $77,55,000 $84,48,000 $92,10,300 $100,48,830 $109,71,213 $119,85,834 $131,01,918 $143,29,610 $156,80,070
Net Cash Flow -$275,00,000 $71,25,000 $77,55,000 $84,48,000 $92,10,300 $100,48,830 $109,71,213 $119,85,834 $131,01,918 $143,29,610 $156,80,070
Cumulative Cash Flow -$275,00,000 -$203,75,000 -$126,20,000 -$41,72,000 $50,38,300 $150,87,130 $260,58,343 $380,44,177 $511,46,095 $654,75,705 $811,55,775
Discount Rate 22% 22% 22% 22% 22% 22% 22% 22% 22% 22% 22%
Discounted Cash Flow -$275,00,000 $58,40,164 $52,10,293 $46,52,372 $41,57,521 $37,18,060 $33,27,328 $29,79,542 $26,69,662 $23,93,293 $21,46,593
Payback Period (in years) 3.453
Net Present Value $95,94,827
Profitability Index 1.349
Capital Budgeting Analysis for Wodonga Site:
Years
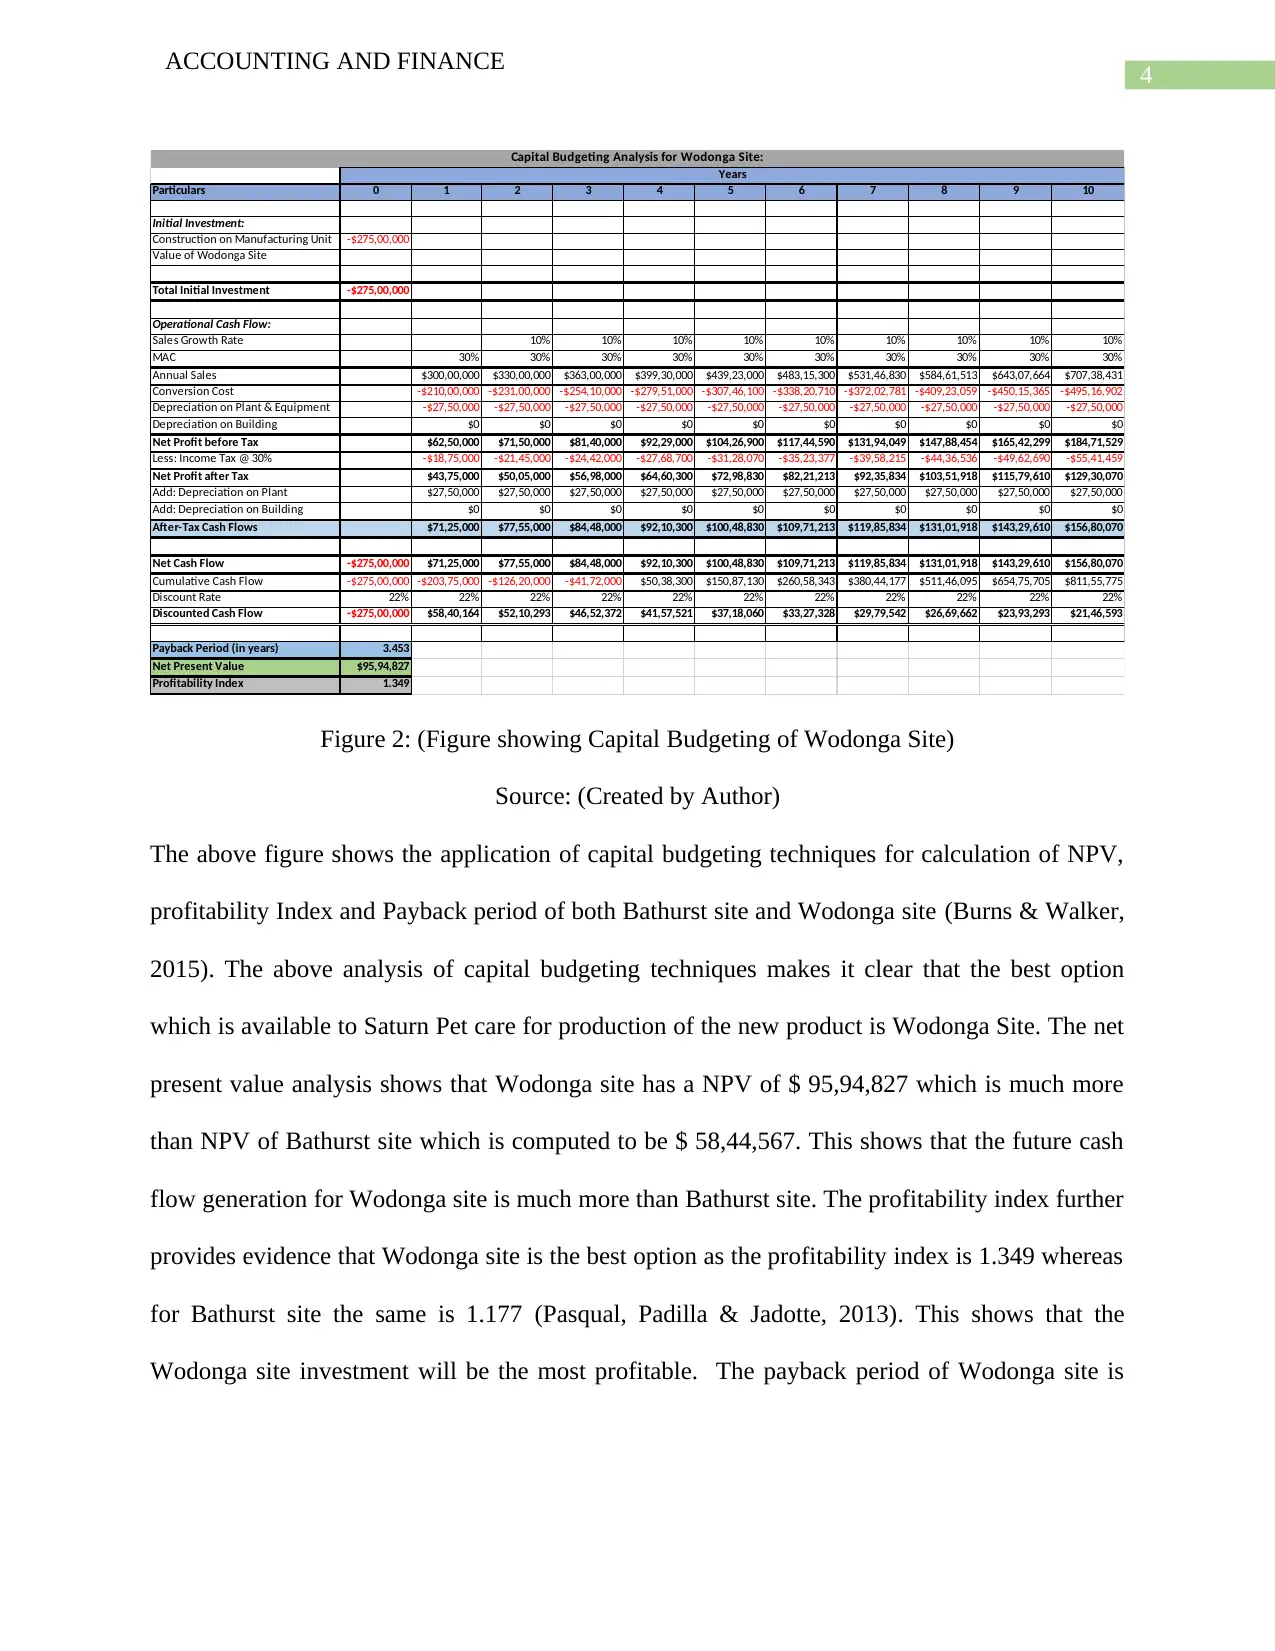
Figure 2: (Figure showing Capital Budgeting of Wodonga Site)
Source: (Created by Author)
The above figure shows the application of capital budgeting techniques for calculation of NPV,
profitability Index and Payback period of both Bathurst site and Wodonga site (Burns & Walker,
2015). The above analysis of capital budgeting techniques makes it clear that the best option
which is available to Saturn Pet care for production of the new product is Wodonga Site. The net
present value analysis shows that Wodonga site has a NPV of $ 95,94,827 which is much more
than NPV of Bathurst site which is computed to be $ 58,44,567. This shows that the future cash
flow generation for Wodonga site is much more than Bathurst site. The profitability index further
provides evidence that Wodonga site is the best option as the profitability index is 1.349 whereas
for Bathurst site the same is 1.177 (Pasqual, Padilla & Jadotte, 2013). This shows that the
Wodonga site investment will be the most profitable. The payback period of Wodonga site is
ACCOUNTING AND FINANCE
Particulars 0 1 2 3 4 5 6 7 8 9 10
Initial Investment:
Construction on Manufacturing Unit -$275,00,000
Value of Wodonga Site
Total Initial Investment -$275,00,000
Operational Cash Flow:
Sales Growth Rate 10% 10% 10% 10% 10% 10% 10% 10% 10%
MAC 30% 30% 30% 30% 30% 30% 30% 30% 30% 30%
Annual Sales $300,00,000 $330,00,000 $363,00,000 $399,30,000 $439,23,000 $483,15,300 $531,46,830 $584,61,513 $643,07,664 $707,38,431
Conversion Cost -$210,00,000 -$231,00,000 -$254,10,000 -$279,51,000 -$307,46,100 -$338,20,710 -$372,02,781 -$409,23,059 -$450,15,365 -$495,16,902
Depreciation on Plant & Equipment -$27,50,000 -$27,50,000 -$27,50,000 -$27,50,000 -$27,50,000 -$27,50,000 -$27,50,000 -$27,50,000 -$27,50,000 -$27,50,000
Depreciation on Building $0 $0 $0 $0 $0 $0 $0 $0 $0 $0
Net Profit before Tax $62,50,000 $71,50,000 $81,40,000 $92,29,000 $104,26,900 $117,44,590 $131,94,049 $147,88,454 $165,42,299 $184,71,529
Less: Income Tax @ 30% -$18,75,000 -$21,45,000 -$24,42,000 -$27,68,700 -$31,28,070 -$35,23,377 -$39,58,215 -$44,36,536 -$49,62,690 -$55,41,459
Net Profit after Tax $43,75,000 $50,05,000 $56,98,000 $64,60,300 $72,98,830 $82,21,213 $92,35,834 $103,51,918 $115,79,610 $129,30,070
Add: Depreciation on Plant $27,50,000 $27,50,000 $27,50,000 $27,50,000 $27,50,000 $27,50,000 $27,50,000 $27,50,000 $27,50,000 $27,50,000
Add: Depreciation on Building $0 $0 $0 $0 $0 $0 $0 $0 $0 $0
After-Tax Cash Flows $71,25,000 $77,55,000 $84,48,000 $92,10,300 $100,48,830 $109,71,213 $119,85,834 $131,01,918 $143,29,610 $156,80,070
Net Cash Flow -$275,00,000 $71,25,000 $77,55,000 $84,48,000 $92,10,300 $100,48,830 $109,71,213 $119,85,834 $131,01,918 $143,29,610 $156,80,070
Cumulative Cash Flow -$275,00,000 -$203,75,000 -$126,20,000 -$41,72,000 $50,38,300 $150,87,130 $260,58,343 $380,44,177 $511,46,095 $654,75,705 $811,55,775
Discount Rate 22% 22% 22% 22% 22% 22% 22% 22% 22% 22% 22%
Discounted Cash Flow -$275,00,000 $58,40,164 $52,10,293 $46,52,372 $41,57,521 $37,18,060 $33,27,328 $29,79,542 $26,69,662 $23,93,293 $21,46,593
Payback Period (in years) 3.453
Net Present Value $95,94,827
Profitability Index 1.349
Capital Budgeting Analysis for Wodonga Site:
Years
Figure 2: (Figure showing Capital Budgeting of Wodonga Site)
Source: (Created by Author)
The above figure shows the application of capital budgeting techniques for calculation of NPV,
profitability Index and Payback period of both Bathurst site and Wodonga site (Burns & Walker,
2015). The above analysis of capital budgeting techniques makes it clear that the best option
which is available to Saturn Pet care for production of the new product is Wodonga Site. The net
present value analysis shows that Wodonga site has a NPV of $ 95,94,827 which is much more
than NPV of Bathurst site which is computed to be $ 58,44,567. This shows that the future cash
flow generation for Wodonga site is much more than Bathurst site. The profitability index further
provides evidence that Wodonga site is the best option as the profitability index is 1.349 whereas
for Bathurst site the same is 1.177 (Pasqual, Padilla & Jadotte, 2013). This shows that the
Wodonga site investment will be the most profitable. The payback period of Wodonga site is
5
ACCOUNTING AND FINANCE
even favorable as it is much lesser than payback period of Bathurst site. Thus from the above
discussion it is clear that the most profitable option is Wodonga site.
Product Cannibalization
Product Cannibalization is a strategy which is used by Business in which a products sales
and sale’s volume are reduced so that a new product can be introduced in the market (Kim,
Chhajed & Liu, 2013). In the case of Saturn pet care, there is a possibility that the business might
have used product cannibalization strategy so as to promote a new product in the market.
Excessive Sales Recorded
One of the Director of the Saturn pet care is Nathan who is of the opinion that the
marketing department has recorded the sales as per year estimate a bit higher than normal. Such
an estimation error can upset the planning process as the target might be unachievable and
unrealistic. The management can follow NPV technique where the cash outflows can be
increased so as to reduce the excessive sales which is estimated.
Inclusion of Original Cost of Plant in NPV Analysis
Nathan who is one of the directors of the company is of the view that for the purpose of
computation NPV analysis the original cost of the factory of Wodonga site should be included in
the initial investment of the company. This is not a correct approach as only any new investment
which the company undertakes for that project will come under NPV analysis (Cucchiella,
D’Adamo & Gastaldi, 2015).
Part B
Introduction
This part of the assignment will be focusing on the analysis of capital structure of ARB
analysis and the effectiveness of the same. ARB ltd is engaged in the manufacture of road motor
⊘ This is a preview!⊘
Do you want full access?
Subscribe today to unlock all pages.
Trusted by 1+ million students worldwide
6
ACCOUNTING AND FINANCE
vehicle accessories. A comparative analysis will also be conducted between ARB ltd and Modine
ltd which is engaged in similar activities same as ARB ltd.
Discussions
Capital Structure and Cost of Capital
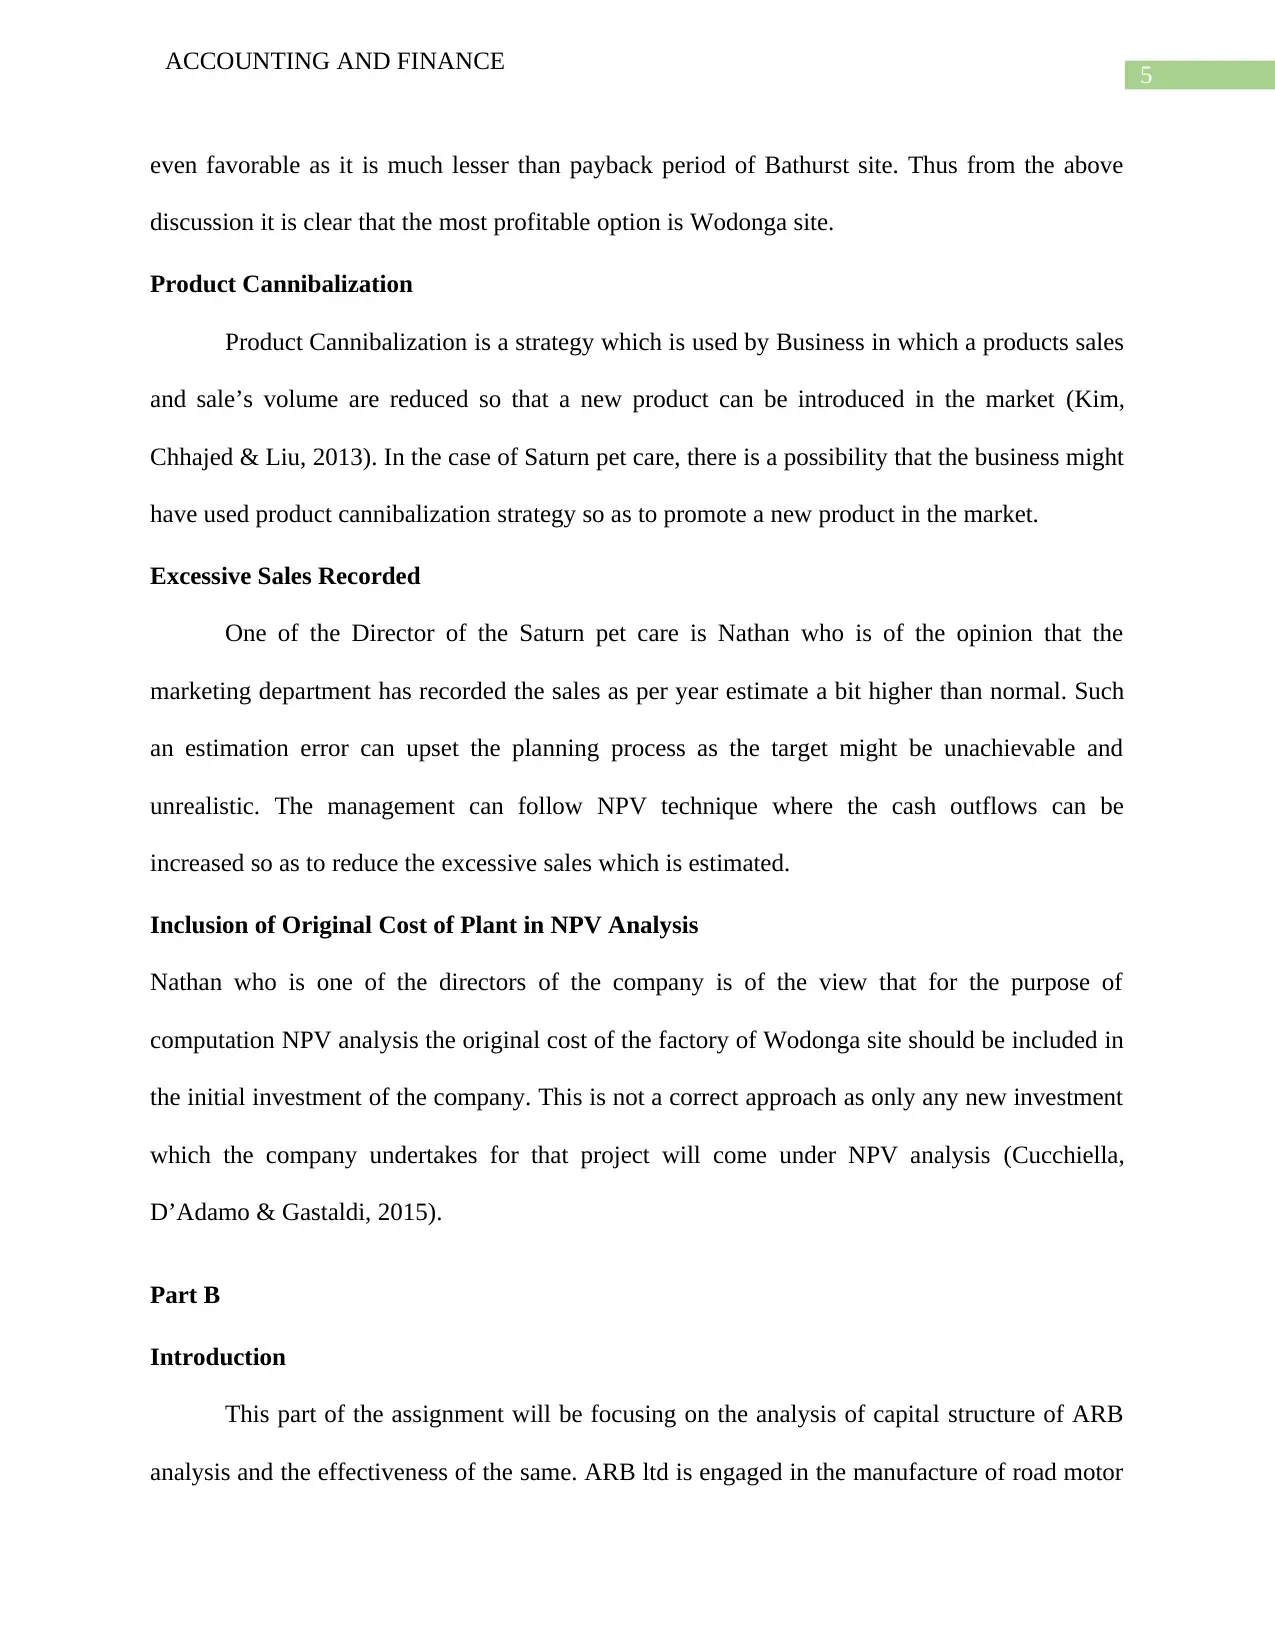
The capital structure of ARB ltd clearly shows that the company follows the policy of
using only equity-based capital in the capital structure of the business. In other the capital
structure of the business is solely made up of equity capital and no debt capital is used in the
structure (Rob & Robinson, 2014). The present capital structure of the company as shown in the
table below comprises of equity capital which is $ 2,72,341.
Particulars Amount Weightage
(in '000s)
Total Equity $2,72,341 100%
Secured Borrowings $0 0%
TOTAL CAPITAL $2,72,341 100%
CURRENT CAPITAL STRUCTURE:
Weighted Average Cost of Capital
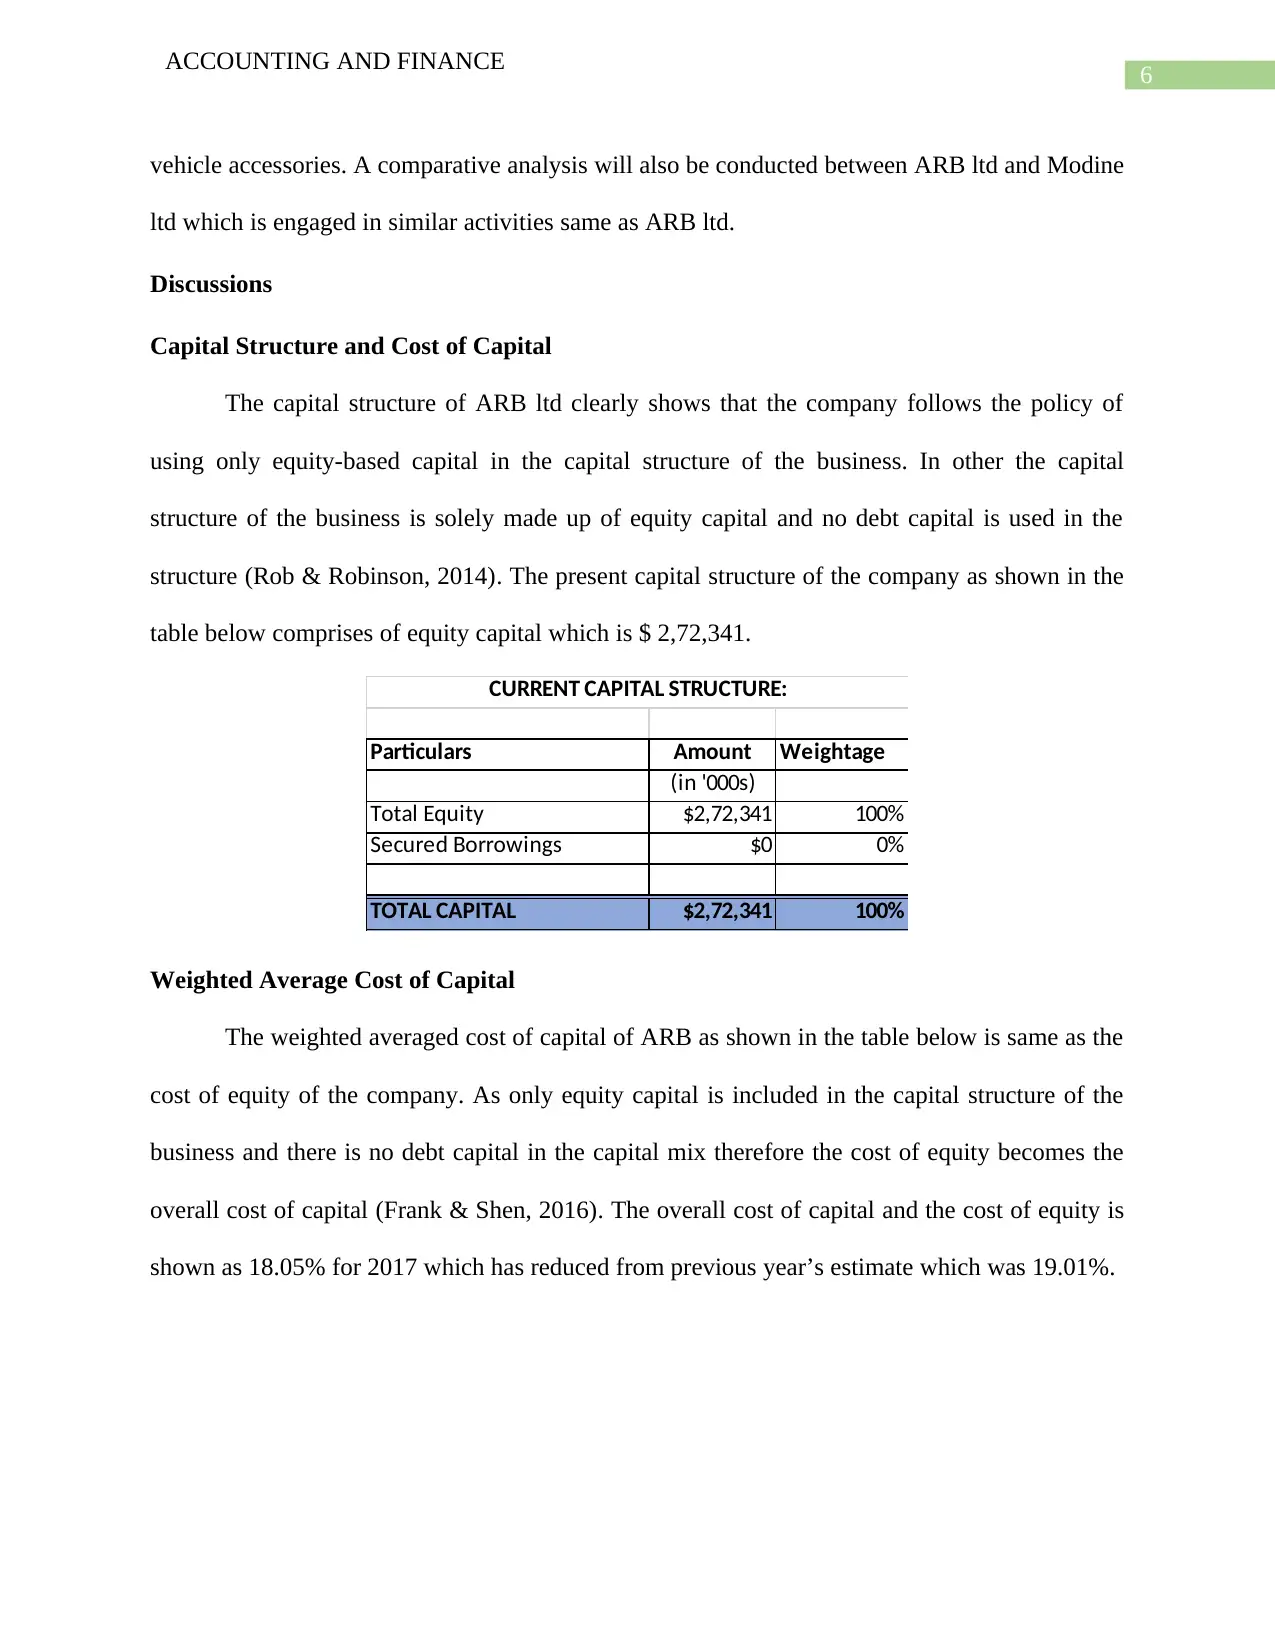
The weighted averaged cost of capital of ARB as shown in the table below is same as the
cost of equity of the company. As only equity capital is included in the capital structure of the
business and there is no debt capital in the capital mix therefore the cost of equity becomes the
overall cost of capital (Frank & Shen, 2016). The overall cost of capital and the cost of equity is
shown as 18.05% for 2017 which has reduced from previous year’s estimate which was 19.01%.
ACCOUNTING AND FINANCE
vehicle accessories. A comparative analysis will also be conducted between ARB ltd and Modine
ltd which is engaged in similar activities same as ARB ltd.
Discussions
Capital Structure and Cost of Capital
The capital structure of ARB ltd clearly shows that the company follows the policy of
using only equity-based capital in the capital structure of the business. In other the capital
structure of the business is solely made up of equity capital and no debt capital is used in the
structure (Rob & Robinson, 2014). The present capital structure of the company as shown in the
table below comprises of equity capital which is $ 2,72,341.
Particulars Amount Weightage
(in '000s)
Total Equity $2,72,341 100%
Secured Borrowings $0 0%
TOTAL CAPITAL $2,72,341 100%
CURRENT CAPITAL STRUCTURE:
Weighted Average Cost of Capital
The weighted averaged cost of capital of ARB as shown in the table below is same as the
cost of equity of the company. As only equity capital is included in the capital structure of the
business and there is no debt capital in the capital mix therefore the cost of equity becomes the
overall cost of capital (Frank & Shen, 2016). The overall cost of capital and the cost of equity is
shown as 18.05% for 2017 which has reduced from previous year’s estimate which was 19.01%.
Paraphrase This Document
Need a fresh take? Get an instant paraphrase of this document with our AI Paraphraser
7
ACCOUNTING AND FINANCE
WACC:
Particulars 2017 2016 2015 2014
(in '000s) (in '000s) (in '000s) (in '000s)
Net profit after Tax $49,152 $47,439 $44,093 $42,570
Total Equity $2,72,341 $2,49,608 $2,26,348 $1,97,814
Cost of Equity 18.05% 19.01% 19.48% 21.52%
Weightage of Equity 100.00% 100.00% 99.12% 100.00%
Interest Expenses for
secured borrowings 0 0 220 0
Secured Borrowings $0 $0 $2,000 $0
Cost of Debt 0% 0% 11.00% 0%
Weightage of Debt 0% 0% 1% 0%
Tax Rate 30% 30% 30% 30%
WACC 18.05% 19.01% 19.39% 21.52%
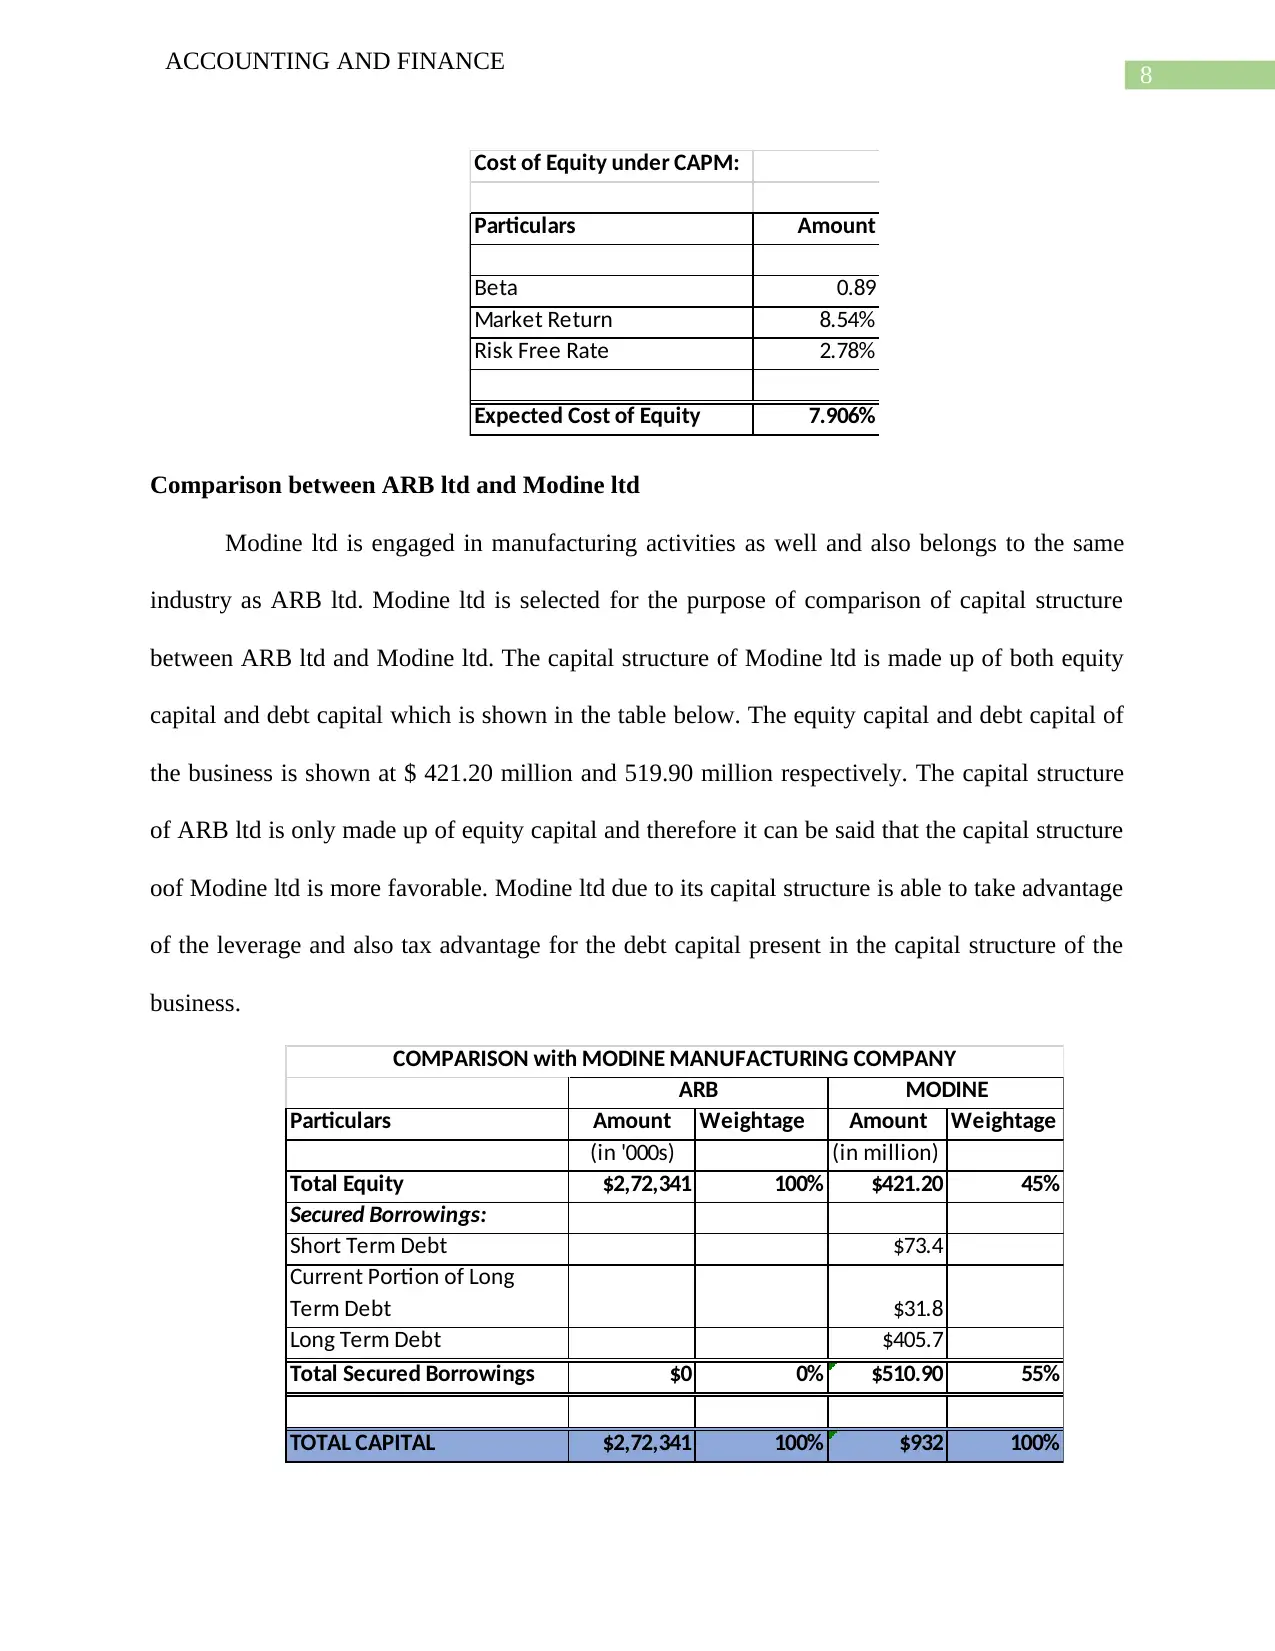
Cost of Equity under CAPM
As per the general method the cost of equity comes to 18.05% for the year 2017, however
if the business follows the Capital Asset Pricing Method (CAPM) then the results are likely to
change (McKay & Haque, 2016). As per CAPM, the market rate of return, risk free rate of return
and Beta which signifies risks are taken into consideration. As per CAPM approach, the cost of
equity as shown in table below comes to 7.906% which signifies that the expectation of
shareholders meets as market return is greater than the cost of capital (Hasan, Hossain & Habib,
2015). This is considered to be one of the better approaches for calculating cost of equity.
ACCOUNTING AND FINANCE
WACC:
Particulars 2017 2016 2015 2014
(in '000s) (in '000s) (in '000s) (in '000s)
Net profit after Tax $49,152 $47,439 $44,093 $42,570
Total Equity $2,72,341 $2,49,608 $2,26,348 $1,97,814
Cost of Equity 18.05% 19.01% 19.48% 21.52%
Weightage of Equity 100.00% 100.00% 99.12% 100.00%
Interest Expenses for
secured borrowings 0 0 220 0
Secured Borrowings $0 $0 $2,000 $0
Cost of Debt 0% 0% 11.00% 0%
Weightage of Debt 0% 0% 1% 0%
Tax Rate 30% 30% 30% 30%
WACC 18.05% 19.01% 19.39% 21.52%
Cost of Equity under CAPM
As per the general method the cost of equity comes to 18.05% for the year 2017, however
if the business follows the Capital Asset Pricing Method (CAPM) then the results are likely to
change (McKay & Haque, 2016). As per CAPM, the market rate of return, risk free rate of return
and Beta which signifies risks are taken into consideration. As per CAPM approach, the cost of
equity as shown in table below comes to 7.906% which signifies that the expectation of
shareholders meets as market return is greater than the cost of capital (Hasan, Hossain & Habib,
2015). This is considered to be one of the better approaches for calculating cost of equity.
8
ACCOUNTING AND FINANCE
Cost of Equity under CAPM:
Particulars Amount
Beta 0.89
Market Return 8.54%
Risk Free Rate 2.78%
Expected Cost of Equity 7.906%
Comparison between ARB ltd and Modine ltd
Modine ltd is engaged in manufacturing activities as well and also belongs to the same
industry as ARB ltd. Modine ltd is selected for the purpose of comparison of capital structure
between ARB ltd and Modine ltd. The capital structure of Modine ltd is made up of both equity
capital and debt capital which is shown in the table below. The equity capital and debt capital of
the business is shown at $ 421.20 million and 519.90 million respectively. The capital structure
of ARB ltd is only made up of equity capital and therefore it can be said that the capital structure
oof Modine ltd is more favorable. Modine ltd due to its capital structure is able to take advantage
of the leverage and also tax advantage for the debt capital present in the capital structure of the
business.
Particulars Amount Weightage Amount Weightage
(in '000s) (in million)
Total Equity $2,72,341 100% $421.20 45%
Secured Borrowings:
Short Term Debt $73.4
Current Portion of Long
Term Debt $31.8
Long Term Debt $405.7
Total Secured Borrowings $0 0% $510.90 55%
TOTAL CAPITAL $2,72,341 100% $932 100%
ARB MODINE
COMPARISON with MODINE MANUFACTURING COMPANY
⊘ This is a preview!⊘
Do you want full access?
Subscribe today to unlock all pages.
Trusted by 1+ million students worldwide
9
ACCOUNTING AND FINANCE
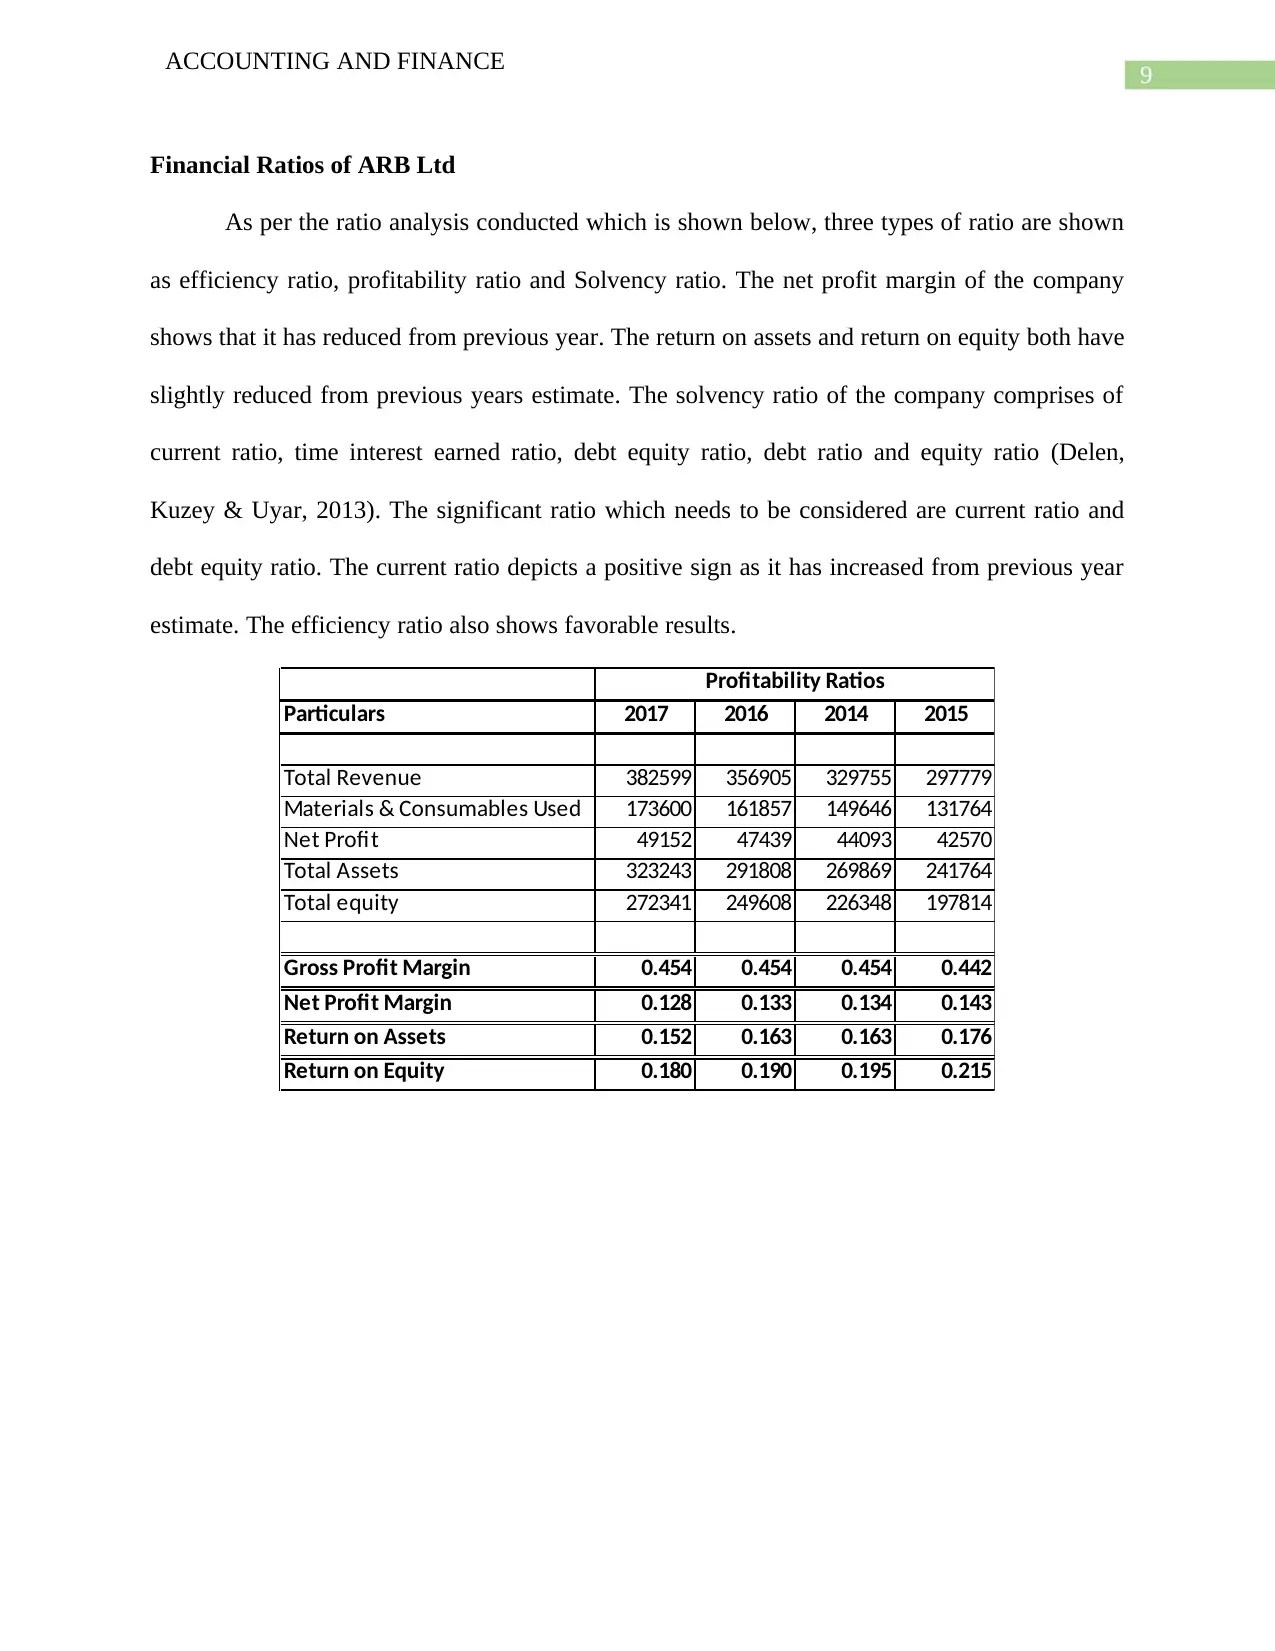
Financial Ratios of ARB Ltd
As per the ratio analysis conducted which is shown below, three types of ratio are shown
as efficiency ratio, profitability ratio and Solvency ratio. The net profit margin of the company
shows that it has reduced from previous year. The return on assets and return on equity both have
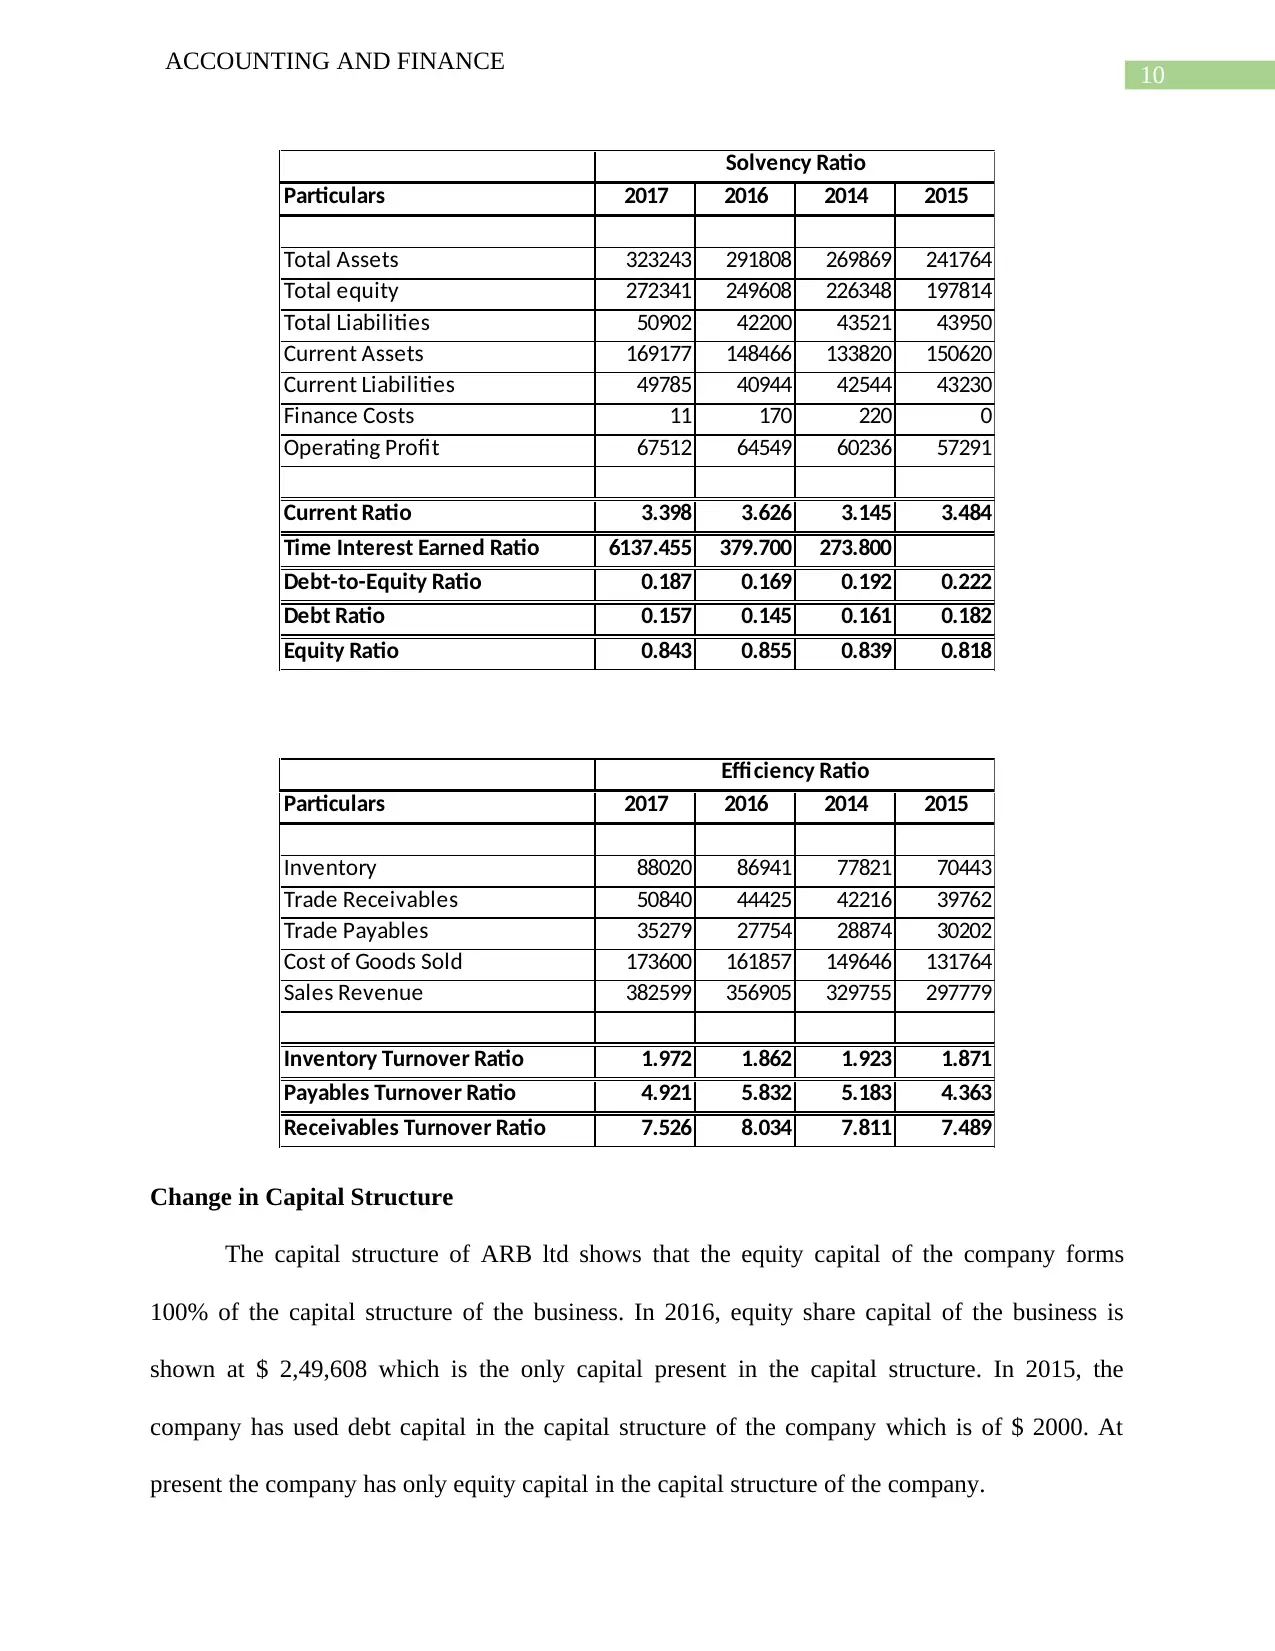
slightly reduced from previous years estimate. The solvency ratio of the company comprises of
current ratio, time interest earned ratio, debt equity ratio, debt ratio and equity ratio (Delen,
Kuzey & Uyar, 2013). The significant ratio which needs to be considered are current ratio and
debt equity ratio. The current ratio depicts a positive sign as it has increased from previous year
estimate. The efficiency ratio also shows favorable results.
Particulars 2017 2016 2014 2015
Total Revenue 382599 356905 329755 297779
Materials & Consumables Used 173600 161857 149646 131764
Net Profit 49152 47439 44093 42570
Total Assets 323243 291808 269869 241764
Total equity 272341 249608 226348 197814
Gross Profit Margin 0.454 0.454 0.454 0.442
Net Profit Margin 0.128 0.133 0.134 0.143
Return on Assets 0.152 0.163 0.163 0.176
Return on Equity 0.180 0.190 0.195 0.215
Profitability Ratios
ACCOUNTING AND FINANCE
Financial Ratios of ARB Ltd
As per the ratio analysis conducted which is shown below, three types of ratio are shown
as efficiency ratio, profitability ratio and Solvency ratio. The net profit margin of the company
shows that it has reduced from previous year. The return on assets and return on equity both have
slightly reduced from previous years estimate. The solvency ratio of the company comprises of
current ratio, time interest earned ratio, debt equity ratio, debt ratio and equity ratio (Delen,
Kuzey & Uyar, 2013). The significant ratio which needs to be considered are current ratio and
debt equity ratio. The current ratio depicts a positive sign as it has increased from previous year
estimate. The efficiency ratio also shows favorable results.
Particulars 2017 2016 2014 2015
Total Revenue 382599 356905 329755 297779
Materials & Consumables Used 173600 161857 149646 131764
Net Profit 49152 47439 44093 42570
Total Assets 323243 291808 269869 241764
Total equity 272341 249608 226348 197814
Gross Profit Margin 0.454 0.454 0.454 0.442
Net Profit Margin 0.128 0.133 0.134 0.143
Return on Assets 0.152 0.163 0.163 0.176
Return on Equity 0.180 0.190 0.195 0.215
Profitability Ratios
Paraphrase This Document
Need a fresh take? Get an instant paraphrase of this document with our AI Paraphraser
10
ACCOUNTING AND FINANCE
Particulars 2017 2016 2014 2015
Total Assets 323243 291808 269869 241764
Total equity 272341 249608 226348 197814
Total Liabilities 50902 42200 43521 43950
Current Assets 169177 148466 133820 150620
Current Liabilities 49785 40944 42544 43230
Finance Costs 11 170 220 0
Operating Profit 67512 64549 60236 57291
Current Ratio 3.398 3.626 3.145 3.484
Time Interest Earned Ratio 6137.455 379.700 273.800
Debt-to-Equity Ratio 0.187 0.169 0.192 0.222
Debt Ratio 0.157 0.145 0.161 0.182
Equity Ratio 0.843 0.855 0.839 0.818
Solvency Ratio
Particulars 2017 2016 2014 2015
Inventory 88020 86941 77821 70443
Trade Receivables 50840 44425 42216 39762
Trade Payables 35279 27754 28874 30202
Cost of Goods Sold 173600 161857 149646 131764
Sales Revenue 382599 356905 329755 297779
Inventory Turnover Ratio 1.972 1.862 1.923 1.871
Payables Turnover Ratio 4.921 5.832 5.183 4.363
Receivables Turnover Ratio 7.526 8.034 7.811 7.489
Efficiency Ratio
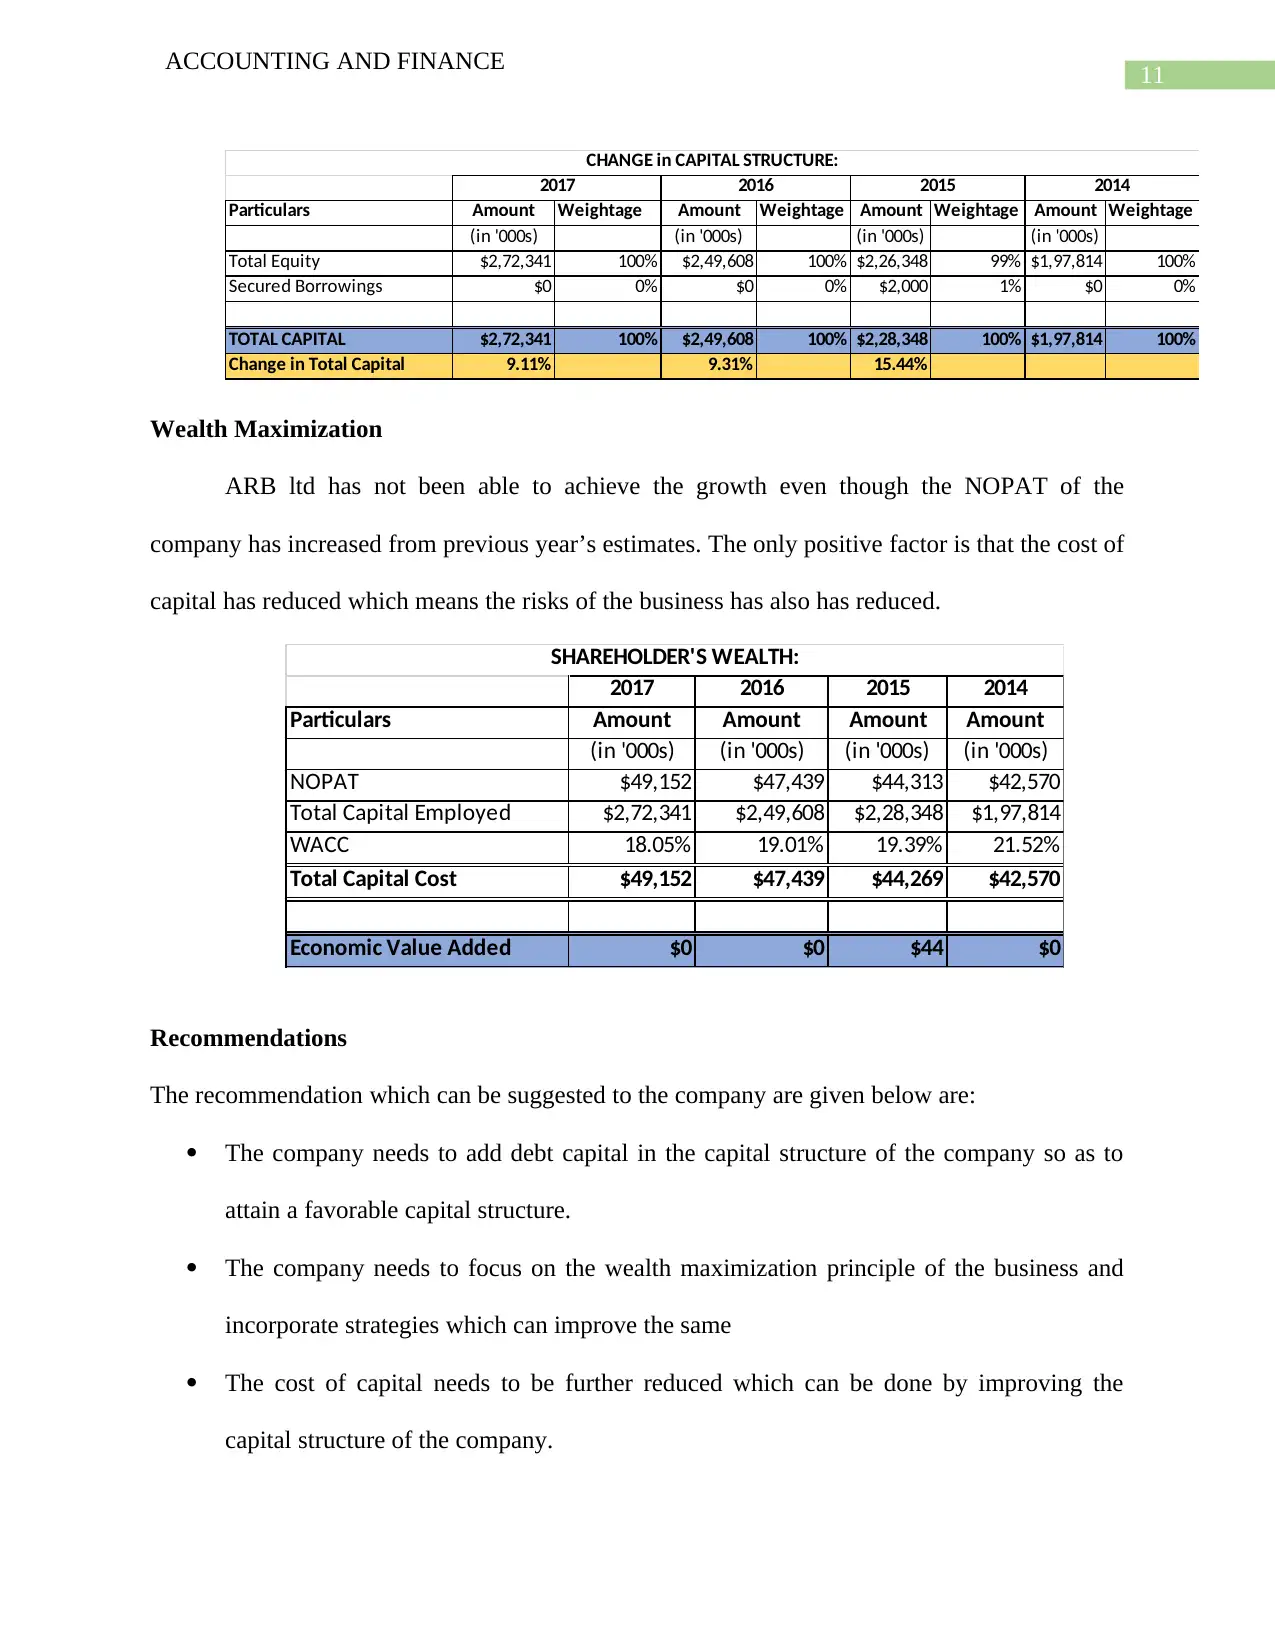
Change in Capital Structure
The capital structure of ARB ltd shows that the equity capital of the company forms
100% of the capital structure of the business. In 2016, equity share capital of the business is
shown at $ 2,49,608 which is the only capital present in the capital structure. In 2015, the
company has used debt capital in the capital structure of the company which is of $ 2000. At
present the company has only equity capital in the capital structure of the company.
ACCOUNTING AND FINANCE
Particulars 2017 2016 2014 2015
Total Assets 323243 291808 269869 241764
Total equity 272341 249608 226348 197814
Total Liabilities 50902 42200 43521 43950
Current Assets 169177 148466 133820 150620
Current Liabilities 49785 40944 42544 43230
Finance Costs 11 170 220 0
Operating Profit 67512 64549 60236 57291
Current Ratio 3.398 3.626 3.145 3.484
Time Interest Earned Ratio 6137.455 379.700 273.800
Debt-to-Equity Ratio 0.187 0.169 0.192 0.222
Debt Ratio 0.157 0.145 0.161 0.182
Equity Ratio 0.843 0.855 0.839 0.818
Solvency Ratio
Particulars 2017 2016 2014 2015
Inventory 88020 86941 77821 70443
Trade Receivables 50840 44425 42216 39762
Trade Payables 35279 27754 28874 30202
Cost of Goods Sold 173600 161857 149646 131764
Sales Revenue 382599 356905 329755 297779
Inventory Turnover Ratio 1.972 1.862 1.923 1.871
Payables Turnover Ratio 4.921 5.832 5.183 4.363
Receivables Turnover Ratio 7.526 8.034 7.811 7.489
Efficiency Ratio
Change in Capital Structure
The capital structure of ARB ltd shows that the equity capital of the company forms
100% of the capital structure of the business. In 2016, equity share capital of the business is
shown at $ 2,49,608 which is the only capital present in the capital structure. In 2015, the
company has used debt capital in the capital structure of the company which is of $ 2000. At
present the company has only equity capital in the capital structure of the company.
11
ACCOUNTING AND FINANCE
Particulars Amount Weightage Amount Weightage Amount Weightage Amount Weightage
(in '000s) (in '000s) (in '000s) (in '000s)
Total Equity $2,72,341 100% $2,49,608 100% $2,26,348 99% $1,97,814 100%
Secured Borrowings $0 0% $0 0% $2,000 1% $0 0%
TOTAL CAPITAL $2,72,341 100% $2,49,608 100% $2,28,348 100% $1,97,814 100%
Change in Total Capital 9.11% 9.31% 15.44%
2015 2014
CHANGE in CAPITAL STRUCTURE:
2017 2016
Wealth Maximization
ARB ltd has not been able to achieve the growth even though the NOPAT of the
company has increased from previous year’s estimates. The only positive factor is that the cost of
capital has reduced which means the risks of the business has also has reduced.
2017 2016 2015 2014
Particulars Amount Amount Amount Amount
(in '000s) (in '000s) (in '000s) (in '000s)
NOPAT $49,152 $47,439 $44,313 $42,570
Total Capital Employed $2,72,341 $2,49,608 $2,28,348 $1,97,814
WACC 18.05% 19.01% 19.39% 21.52%
Total Capital Cost $49,152 $47,439 $44,269 $42,570
Economic Value Added $0 $0 $44 $0
SHAREHOLDER'S WEALTH:
Recommendations
The recommendation which can be suggested to the company are given below are:
The company needs to add debt capital in the capital structure of the company so as to
attain a favorable capital structure.
The company needs to focus on the wealth maximization principle of the business and
incorporate strategies which can improve the same
The cost of capital needs to be further reduced which can be done by improving the
capital structure of the company.
⊘ This is a preview!⊘
Do you want full access?
Subscribe today to unlock all pages.
Trusted by 1+ million students worldwide
1 out of 14
Related Documents


Your All-in-One AI-Powered Toolkit for Academic Success.
+13062052269
info@desklib.com
Available 24*7 on WhatsApp / Email
![[object Object]](/_next/static/media/star-bottom.7253800d.svg)
Unlock your academic potential
Copyright © 2020–2026 A2Z Services. All Rights Reserved. Developed and managed by ZUCOL.