Finance Report: Saturn Pet Care, ARB Ltd Expansion and Structure
VerifiedAdded on 2021/05/31
|16
|2456
|85
Report
AI Summary
This finance report is divided into two parts. Part A focuses on Saturn Pet Care's business expansion, evaluating production site options (Bathurst and Wodonga) using capital budgeting techniques such as NPV, payback period, and profitability index, concluding that the Wodonga site is the most viable choice. Product cannibalization and sales estimations are also discussed. Part B analyzes the capital structure of ARB Ltd., comparing its performance with Modine Ltd., and evaluating financial ratios (profitability, solvency, and efficiency). The report explores ARB Ltd.'s shift in capital structure, from using debt to solely equity, and offers recommendations on capital structure balance and wealth maximization.
Running head: FINANCE
Finance
Name of the Student:
Name of the University:
Author’s Note:
Finance
Name of the Student:
Name of the University:
Author’s Note:
Paraphrase This Document
Need a fresh take? Get an instant paraphrase of this document with our AI Paraphraser
1
FINANCE
Executive Summary
As per the requirement of the assignment, there are two parts which are needed to be
done which are Part A and Part B. Part A of the assessment will be dealing with the business
expansion of Saturn Pet care which is thinking of establishing new production site for dog food
products production. The assessment will be analysing the options which are available with the
management of the company which will be done with the help of capital budgeting techniques.
The selection of the favourable option will be on the basis of results of the capital budgeting
analysis. Part B of the assignment will be analysing the capital structure of ARB ltd and also
compare the performance of ARB ltd with other financial business.
2
FINANCE
Table of Contents
Part A...............................................................................................................................................3
Product Cannibalization...............................................................................................................5
Excessive Sales recorded.............................................................................................................5
Inclusion of Original Cost of Plant in NPV Analysis..................................................................5
Part B...............................................................................................................................................6
Introduction..................................................................................................................................6
Discussions..................................................................................................................................6
Capital Structure and Cost of Capital..........................................................................................6
Comparison between ARB Ltd and Modine ltd..........................................................................8
Financial Ratio of ARB Ltd.........................................................................................................9
Change in Capital Structure.......................................................................................................11
Wealth Maximization Principle.................................................................................................12
Recommendations..........................................................................................................................13
Conclusion.....................................................................................................................................13
Reference.......................................................................................................................................14
⊘ This is a preview!⊘
Do you want full access?
Subscribe today to unlock all pages.
Trusted by 1+ million students worldwide
3
FINANCE
Part A
Particulars 0 1 2 3 4 5 6 7 8 9 10
Initial Investment:
Construction on Manufacturing Unit -$275,00,000
Factory Building -$80,00,000
Infrastructure Grant $25,00,000
Total Initial Investment -$330,00,000
Operational Cash Flow:
Sales Growth Rate 10% 10% 10% 10% 10% 10% 10% 10% 10%
MAC 30% 30% 30% 30% 30% 30% 30% 30% 30% 30%
Annual Sales $300,00,000 $330,00,000 $363,00,000 $399,30,000 $439,23,000 $483,15,300 $531,46,830 $584,61,513 $643,07,664 $707,38,431
Conversion Cost -$210,00,000 -$231,00,000 -$254,10,000 -$279,51,000 -$307,46,100 -$338,20,710 -$372,02,781 -$409,23,059 -$450,15,365 -$495,16,902
Rebate on Municipal Rate $5,00,000 $5,00,000 $5,00,000 $5,00,000 $5,00,000 $5,00,000 $5,00,000 $5,00,000 $5,00,000 $5,00,000
Depreciation on Plant & Equipment -$27,50,000 -$27,50,000 -$27,50,000 -$27,50,000 -$27,50,000 -$27,50,000 -$27,50,000 -$27,50,000 -$27,50,000 -$27,50,000
Depreciation on Building -$3,20,000 -$3,20,000 -$3,20,000 -$3,20,000 -$3,20,000 -$3,20,000 -$3,20,000 -$3,20,000 -$3,20,000 -$3,20,000
Net Profit before Tax $64,30,000 $73,30,000 $83,20,000 $94,09,000 $106,06,900 $119,24,590 $133,74,049 $149,68,454 $167,22,299 $186,51,529
Less: Income Tax @ 30% -$19,29,000 -$21,99,000 -$24,96,000 -$28,22,700 -$31,82,070 -$35,77,377 -$40,12,215 -$44,90,536 -$50,16,690 -$55,95,459
Net Profit after Tax $45,01,000 $51,31,000 $58,24,000 $65,86,300 $74,24,830 $83,47,213 $93,61,834 $104,77,918 $117,05,610 $130,56,070
Add: Depreciation on Plant $27,50,000 $27,50,000 $27,50,000 $27,50,000 $27,50,000 $27,50,000 $27,50,000 $27,50,000 $27,50,000 $27,50,000
Add: Depreciation on Building $3,20,000 $3,20,000 $3,20,000 $3,20,000 $3,20,000 $3,20,000 $3,20,000 $3,20,000 $3,20,000 $3,20,000
After-Tax Cash Flows $75,71,000 $82,01,000 $88,94,000 $96,56,300 $104,94,830 $114,17,213 $124,31,834 $135,47,918 $147,75,610 $161,26,070
Net Cash Flow -$330,00,000 $75,71,000 $82,01,000 $88,94,000 $96,56,300 $104,94,830 $114,17,213 $124,31,834 $135,47,918 $147,75,610 $161,26,070
Cumulative Cash Flow -$330,00,000 -$254,29,000 -$172,28,000 -$83,34,000 $13,22,300 $118,17,130 $232,34,343 $356,66,177 $492,14,095 $639,89,705 $801,15,775
Discount Rate 22% 22% 22% 22% 22% 22% 22% 22% 22% 22% 22%
Discounted Cash Flow -$330,00,000 $62,05,738 $55,09,944 $48,97,987 $43,58,845 $38,83,079 $34,62,590 $30,90,412 $27,60,539 $24,67,783 $22,07,650
Payback Period (in years) 3.863
Net Present Value $58,44,567
Profitability Index 1.177
Years
Capital Budgeting Analysis for Bathurst Site:
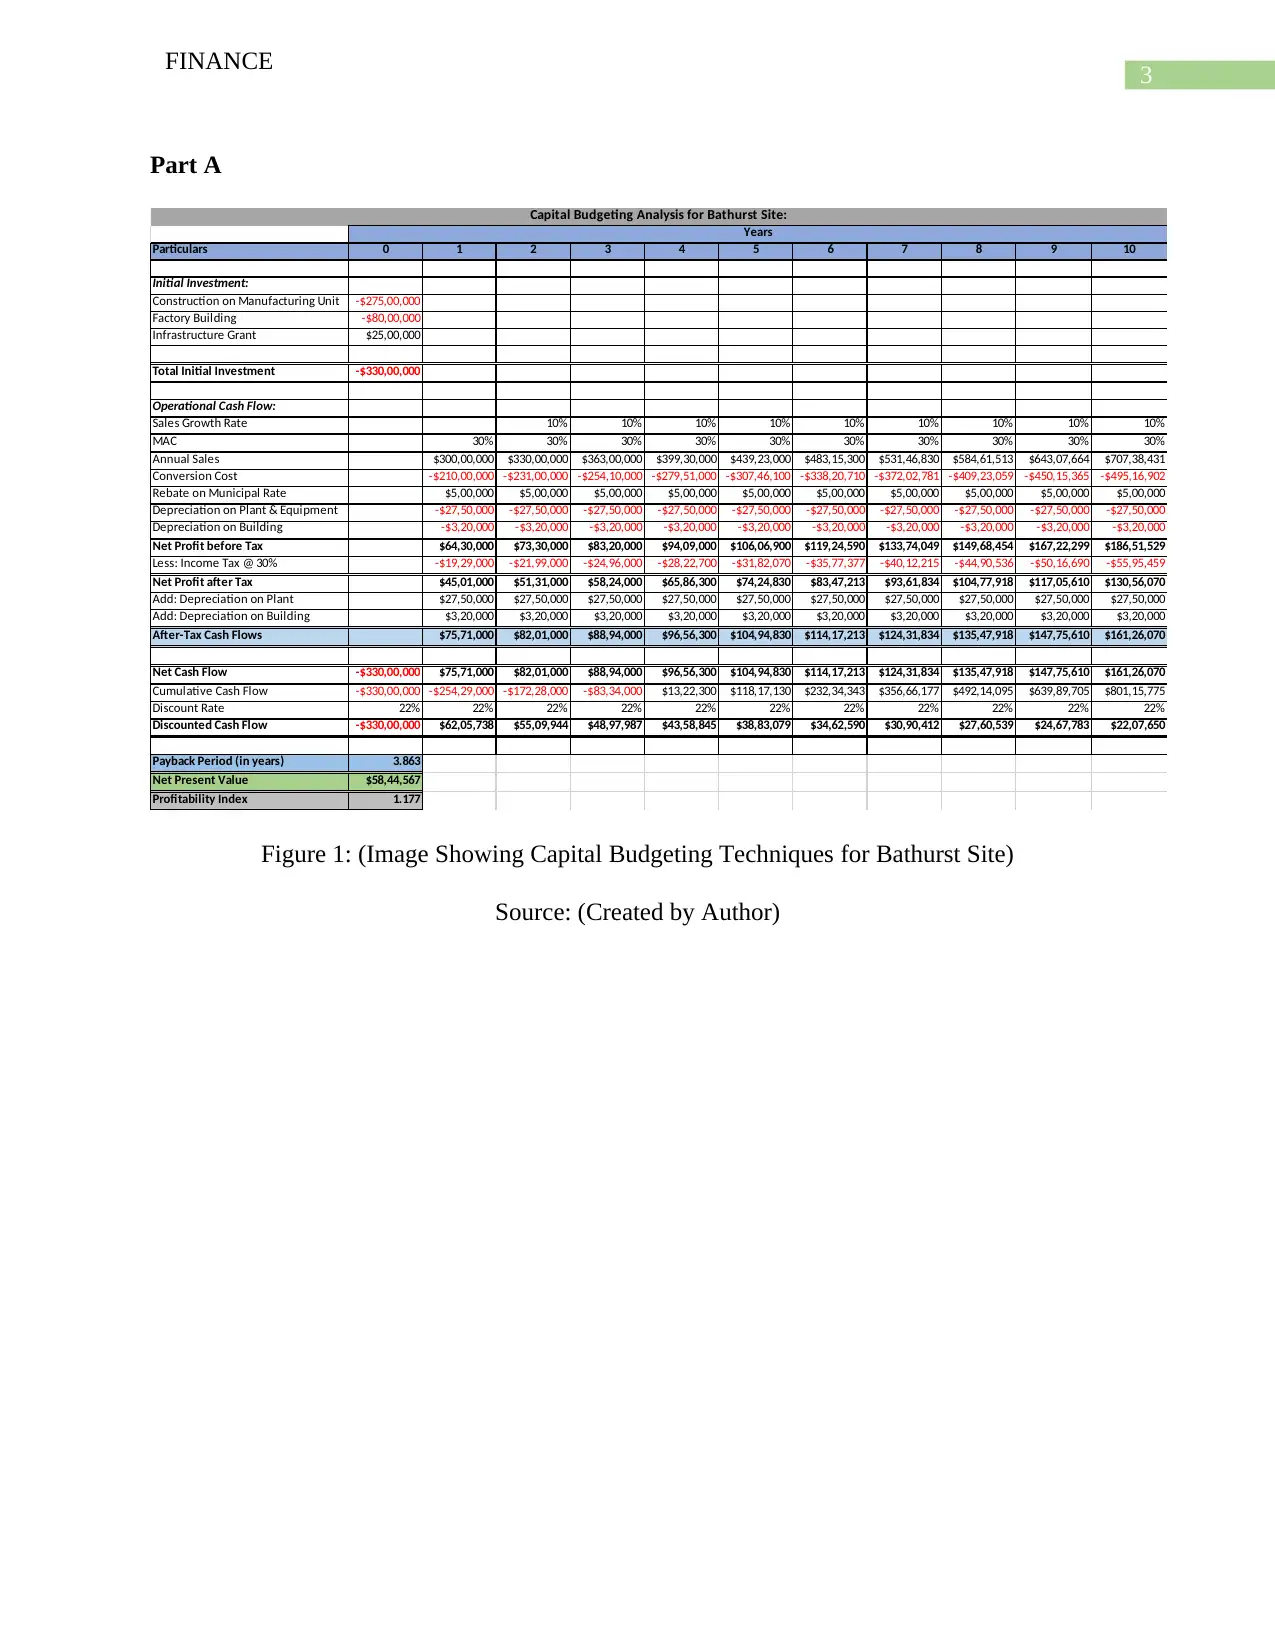
Figure 1: (Image Showing Capital Budgeting Techniques for Bathurst Site)
Source: (Created by Author)
FINANCE
Part A
Particulars 0 1 2 3 4 5 6 7 8 9 10
Initial Investment:
Construction on Manufacturing Unit -$275,00,000
Factory Building -$80,00,000
Infrastructure Grant $25,00,000
Total Initial Investment -$330,00,000
Operational Cash Flow:
Sales Growth Rate 10% 10% 10% 10% 10% 10% 10% 10% 10%
MAC 30% 30% 30% 30% 30% 30% 30% 30% 30% 30%
Annual Sales $300,00,000 $330,00,000 $363,00,000 $399,30,000 $439,23,000 $483,15,300 $531,46,830 $584,61,513 $643,07,664 $707,38,431
Conversion Cost -$210,00,000 -$231,00,000 -$254,10,000 -$279,51,000 -$307,46,100 -$338,20,710 -$372,02,781 -$409,23,059 -$450,15,365 -$495,16,902
Rebate on Municipal Rate $5,00,000 $5,00,000 $5,00,000 $5,00,000 $5,00,000 $5,00,000 $5,00,000 $5,00,000 $5,00,000 $5,00,000
Depreciation on Plant & Equipment -$27,50,000 -$27,50,000 -$27,50,000 -$27,50,000 -$27,50,000 -$27,50,000 -$27,50,000 -$27,50,000 -$27,50,000 -$27,50,000
Depreciation on Building -$3,20,000 -$3,20,000 -$3,20,000 -$3,20,000 -$3,20,000 -$3,20,000 -$3,20,000 -$3,20,000 -$3,20,000 -$3,20,000
Net Profit before Tax $64,30,000 $73,30,000 $83,20,000 $94,09,000 $106,06,900 $119,24,590 $133,74,049 $149,68,454 $167,22,299 $186,51,529
Less: Income Tax @ 30% -$19,29,000 -$21,99,000 -$24,96,000 -$28,22,700 -$31,82,070 -$35,77,377 -$40,12,215 -$44,90,536 -$50,16,690 -$55,95,459
Net Profit after Tax $45,01,000 $51,31,000 $58,24,000 $65,86,300 $74,24,830 $83,47,213 $93,61,834 $104,77,918 $117,05,610 $130,56,070
Add: Depreciation on Plant $27,50,000 $27,50,000 $27,50,000 $27,50,000 $27,50,000 $27,50,000 $27,50,000 $27,50,000 $27,50,000 $27,50,000
Add: Depreciation on Building $3,20,000 $3,20,000 $3,20,000 $3,20,000 $3,20,000 $3,20,000 $3,20,000 $3,20,000 $3,20,000 $3,20,000
After-Tax Cash Flows $75,71,000 $82,01,000 $88,94,000 $96,56,300 $104,94,830 $114,17,213 $124,31,834 $135,47,918 $147,75,610 $161,26,070
Net Cash Flow -$330,00,000 $75,71,000 $82,01,000 $88,94,000 $96,56,300 $104,94,830 $114,17,213 $124,31,834 $135,47,918 $147,75,610 $161,26,070
Cumulative Cash Flow -$330,00,000 -$254,29,000 -$172,28,000 -$83,34,000 $13,22,300 $118,17,130 $232,34,343 $356,66,177 $492,14,095 $639,89,705 $801,15,775
Discount Rate 22% 22% 22% 22% 22% 22% 22% 22% 22% 22% 22%
Discounted Cash Flow -$330,00,000 $62,05,738 $55,09,944 $48,97,987 $43,58,845 $38,83,079 $34,62,590 $30,90,412 $27,60,539 $24,67,783 $22,07,650
Payback Period (in years) 3.863
Net Present Value $58,44,567
Profitability Index 1.177
Years
Capital Budgeting Analysis for Bathurst Site:
Figure 1: (Image Showing Capital Budgeting Techniques for Bathurst Site)
Source: (Created by Author)
Paraphrase This Document
Need a fresh take? Get an instant paraphrase of this document with our AI Paraphraser
4
FINANCE
Particulars 0 1 2 3 4 5 6 7 8 9 10
Initial Investment:
Construction on Manufacturing Unit -$275,00,000
Value of Wodonga Site
Total Initial Investment -$275,00,000
Operational Cash Flow:
Sales Growth Rate 10% 10% 10% 10% 10% 10% 10% 10% 10%
MAC 30% 30% 30% 30% 30% 30% 30% 30% 30% 30%
Annual Sales $300,00,000 $330,00,000 $363,00,000 $399,30,000 $439,23,000 $483,15,300 $531,46,830 $584,61,513 $643,07,664 $707,38,431
Conversion Cost -$210,00,000 -$231,00,000 -$254,10,000 -$279,51,000 -$307,46,100 -$338,20,710 -$372,02,781 -$409,23,059 -$450,15,365 -$495,16,902
Depreciation on Plant & Equipment -$27,50,000 -$27,50,000 -$27,50,000 -$27,50,000 -$27,50,000 -$27,50,000 -$27,50,000 -$27,50,000 -$27,50,000 -$27,50,000
Depreciation on Building $0 $0 $0 $0 $0 $0 $0 $0 $0 $0
Net Profit before Tax $62,50,000 $71,50,000 $81,40,000 $92,29,000 $104,26,900 $117,44,590 $131,94,049 $147,88,454 $165,42,299 $184,71,529
Less: Income Tax @ 30% -$18,75,000 -$21,45,000 -$24,42,000 -$27,68,700 -$31,28,070 -$35,23,377 -$39,58,215 -$44,36,536 -$49,62,690 -$55,41,459
Net Profit after Tax $43,75,000 $50,05,000 $56,98,000 $64,60,300 $72,98,830 $82,21,213 $92,35,834 $103,51,918 $115,79,610 $129,30,070
Add: Depreciation on Plant $27,50,000 $27,50,000 $27,50,000 $27,50,000 $27,50,000 $27,50,000 $27,50,000 $27,50,000 $27,50,000 $27,50,000
Add: Depreciation on Building $0 $0 $0 $0 $0 $0 $0 $0 $0 $0
After-Tax Cash Flows $71,25,000 $77,55,000 $84,48,000 $92,10,300 $100,48,830 $109,71,213 $119,85,834 $131,01,918 $143,29,610 $156,80,070
Net Cash Flow -$275,00,000 $71,25,000 $77,55,000 $84,48,000 $92,10,300 $100,48,830 $109,71,213 $119,85,834 $131,01,918 $143,29,610 $156,80,070
Cumulative Cash Flow -$275,00,000 -$203,75,000 -$126,20,000 -$41,72,000 $50,38,300 $150,87,130 $260,58,343 $380,44,177 $511,46,095 $654,75,705 $811,55,775
Discount Rate 22% 22% 22% 22% 22% 22% 22% 22% 22% 22% 22%
Discounted Cash Flow -$275,00,000 $58,40,164 $52,10,293 $46,52,372 $41,57,521 $37,18,060 $33,27,328 $29,79,542 $26,69,662 $23,93,293 $21,46,593
Payback Period (in years) 3.453
Net Present Value $95,94,827
Profitability Index 1.349
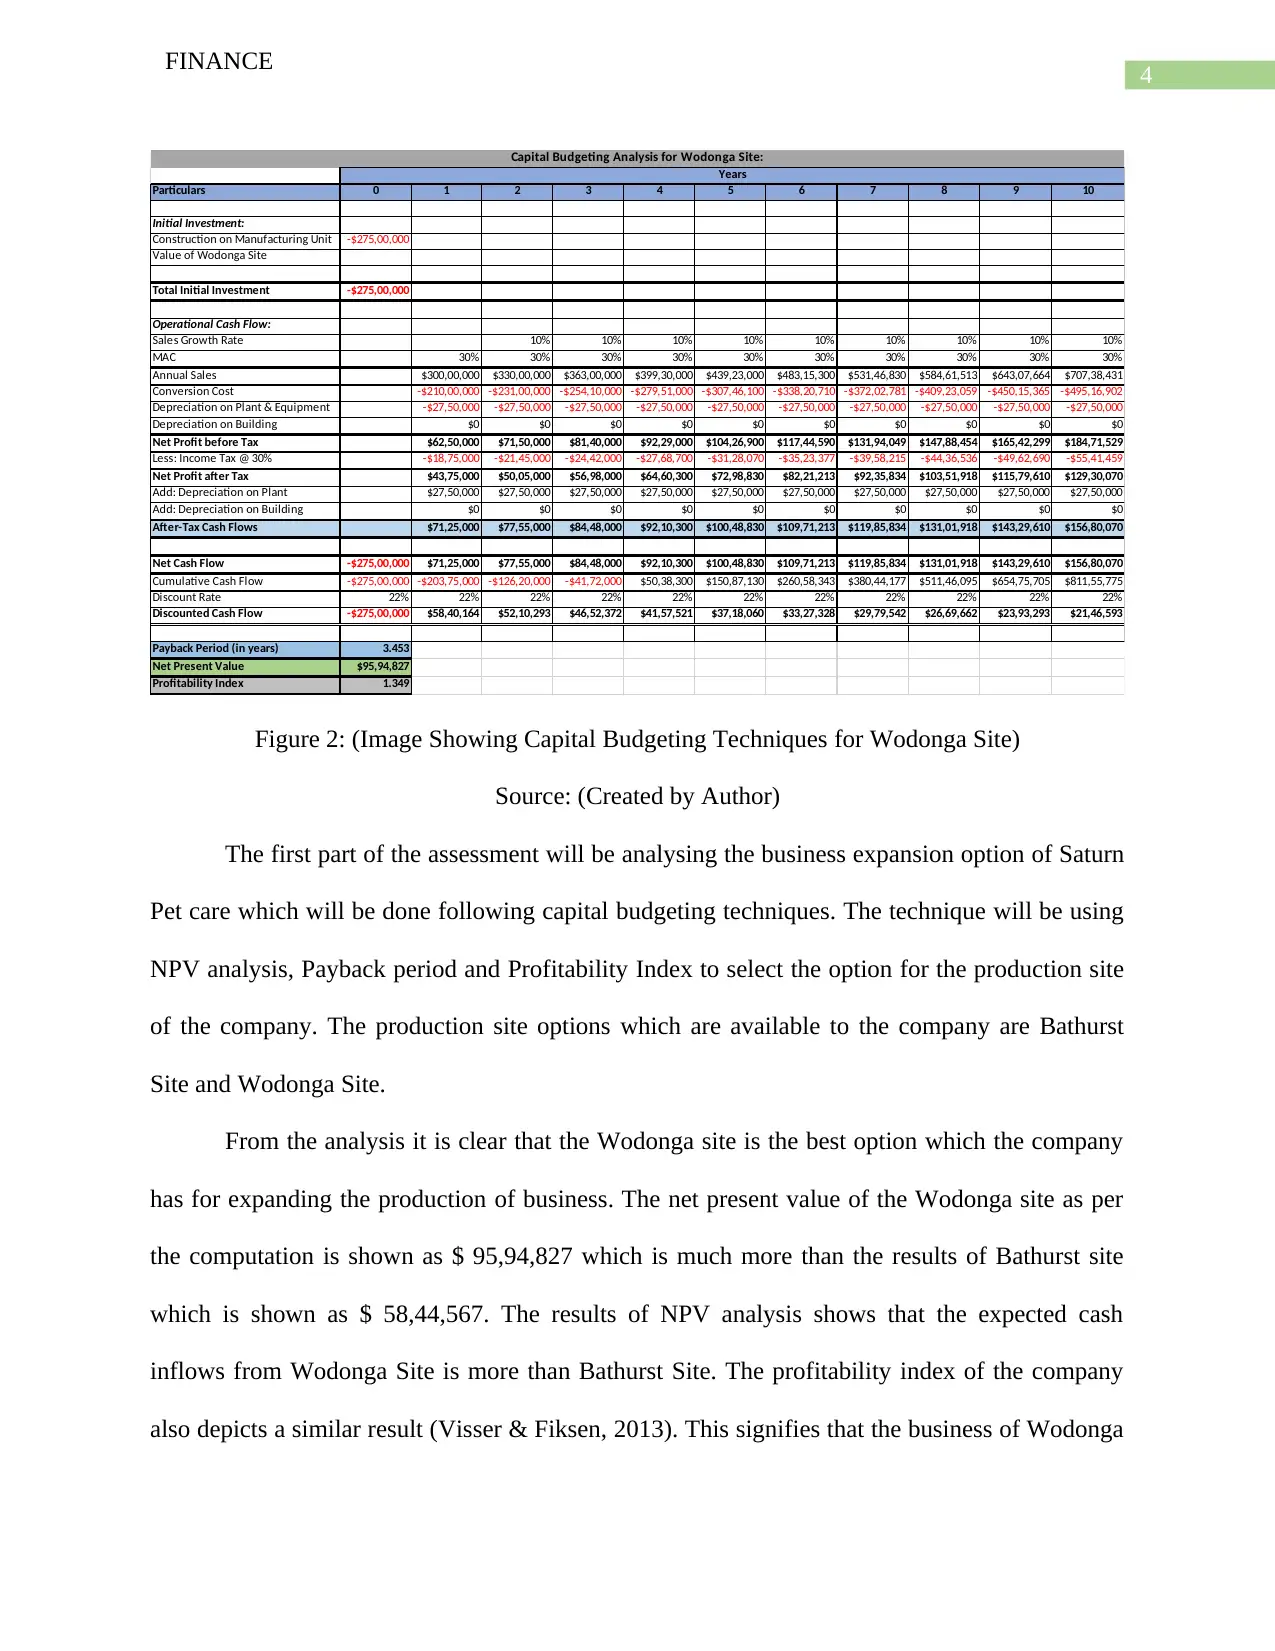
Capital Budgeting Analysis for Wodonga Site:
Years
Figure 2: (Image Showing Capital Budgeting Techniques for Wodonga Site)
Source: (Created by Author)
The first part of the assessment will be analysing the business expansion option of Saturn
Pet care which will be done following capital budgeting techniques. The technique will be using
NPV analysis, Payback period and Profitability Index to select the option for the production site
of the company. The production site options which are available to the company are Bathurst
Site and Wodonga Site.
From the analysis it is clear that the Wodonga site is the best option which the company
has for expanding the production of business. The net present value of the Wodonga site as per
the computation is shown as $ 95,94,827 which is much more than the results of Bathurst site
which is shown as $ 58,44,567. The results of NPV analysis shows that the expected cash
inflows from Wodonga Site is more than Bathurst Site. The profitability index of the company
also depicts a similar result (Visser & Fiksen, 2013). This signifies that the business of Wodonga
FINANCE
Particulars 0 1 2 3 4 5 6 7 8 9 10
Initial Investment:
Construction on Manufacturing Unit -$275,00,000
Value of Wodonga Site
Total Initial Investment -$275,00,000
Operational Cash Flow:
Sales Growth Rate 10% 10% 10% 10% 10% 10% 10% 10% 10%
MAC 30% 30% 30% 30% 30% 30% 30% 30% 30% 30%
Annual Sales $300,00,000 $330,00,000 $363,00,000 $399,30,000 $439,23,000 $483,15,300 $531,46,830 $584,61,513 $643,07,664 $707,38,431
Conversion Cost -$210,00,000 -$231,00,000 -$254,10,000 -$279,51,000 -$307,46,100 -$338,20,710 -$372,02,781 -$409,23,059 -$450,15,365 -$495,16,902
Depreciation on Plant & Equipment -$27,50,000 -$27,50,000 -$27,50,000 -$27,50,000 -$27,50,000 -$27,50,000 -$27,50,000 -$27,50,000 -$27,50,000 -$27,50,000
Depreciation on Building $0 $0 $0 $0 $0 $0 $0 $0 $0 $0
Net Profit before Tax $62,50,000 $71,50,000 $81,40,000 $92,29,000 $104,26,900 $117,44,590 $131,94,049 $147,88,454 $165,42,299 $184,71,529
Less: Income Tax @ 30% -$18,75,000 -$21,45,000 -$24,42,000 -$27,68,700 -$31,28,070 -$35,23,377 -$39,58,215 -$44,36,536 -$49,62,690 -$55,41,459
Net Profit after Tax $43,75,000 $50,05,000 $56,98,000 $64,60,300 $72,98,830 $82,21,213 $92,35,834 $103,51,918 $115,79,610 $129,30,070
Add: Depreciation on Plant $27,50,000 $27,50,000 $27,50,000 $27,50,000 $27,50,000 $27,50,000 $27,50,000 $27,50,000 $27,50,000 $27,50,000
Add: Depreciation on Building $0 $0 $0 $0 $0 $0 $0 $0 $0 $0
After-Tax Cash Flows $71,25,000 $77,55,000 $84,48,000 $92,10,300 $100,48,830 $109,71,213 $119,85,834 $131,01,918 $143,29,610 $156,80,070
Net Cash Flow -$275,00,000 $71,25,000 $77,55,000 $84,48,000 $92,10,300 $100,48,830 $109,71,213 $119,85,834 $131,01,918 $143,29,610 $156,80,070
Cumulative Cash Flow -$275,00,000 -$203,75,000 -$126,20,000 -$41,72,000 $50,38,300 $150,87,130 $260,58,343 $380,44,177 $511,46,095 $654,75,705 $811,55,775
Discount Rate 22% 22% 22% 22% 22% 22% 22% 22% 22% 22% 22%
Discounted Cash Flow -$275,00,000 $58,40,164 $52,10,293 $46,52,372 $41,57,521 $37,18,060 $33,27,328 $29,79,542 $26,69,662 $23,93,293 $21,46,593
Payback Period (in years) 3.453
Net Present Value $95,94,827
Profitability Index 1.349
Capital Budgeting Analysis for Wodonga Site:
Years
Figure 2: (Image Showing Capital Budgeting Techniques for Wodonga Site)
Source: (Created by Author)
The first part of the assessment will be analysing the business expansion option of Saturn
Pet care which will be done following capital budgeting techniques. The technique will be using
NPV analysis, Payback period and Profitability Index to select the option for the production site
of the company. The production site options which are available to the company are Bathurst
Site and Wodonga Site.
From the analysis it is clear that the Wodonga site is the best option which the company
has for expanding the production of business. The net present value of the Wodonga site as per
the computation is shown as $ 95,94,827 which is much more than the results of Bathurst site
which is shown as $ 58,44,567. The results of NPV analysis shows that the expected cash
inflows from Wodonga Site is more than Bathurst Site. The profitability index of the company
also depicts a similar result (Visser & Fiksen, 2013). This signifies that the business of Wodonga
5
FINANCE
Site is much more profitable than Bathurst site. The payback period of the Wodonga Site is much
better than the payback period of Bathurst site. Thus, from the above discussion it is clear that
Saturn Pet care should select Wodonga site for the purpose of establishing a production site.
Product Cannibalization
This refers to a strategy which is adopted by businesses in which the sales revenue and
volume of a product is lowered so that another product can be introduced and promoted in the
market (Hvolby & Steger-Jensen, 2015). In the case study of Saturn pet care, there is a
possibility that the technique might be used in order to promote the new product among the
customers. The purpose of using Product Cannibalization is to establish a product in the market
for the purpose of sales maximization.
Excessive Sales recorded
Nathan who is one of the directors of the company is of the view that the marketing
department of the company has recorded sales a bit than what is accurately correct. The
management needs to rectify such an estimation as this will be hamper the planning process if
proper target is not set and there is also a chance that targets which is set by the company might
be completely unrealistic. The management can follow NPV method in which the cash outflows
can be increased in order to balance the overestimated sales (Bianchini et al., 2016).
Inclusion of Original Cost of Plant in NPV Analysis
The director of the company is also of the opinion that for the purpose of NPV analysis
the original cost of the vacant factory space should be considered. However, this is not correct as
the original cost of the factory shed will not fall under initial investment and any new investment
which is undertaken by the company for the purpose of the production.
⊘ This is a preview!⊘
Do you want full access?
Subscribe today to unlock all pages.
Trusted by 1+ million students worldwide
6
FINANCE
Part B
Introduction
This part of the assignment will be focusing on the analysis of the capital structure and its
effectiveness of ARB ltd. The capital structure of the company will be compared with another
company’s structure so as to establish which business has an effective capital structure. ARB ltd
is engaged in the manufacture of road motor vehicle accessories.
Discussions
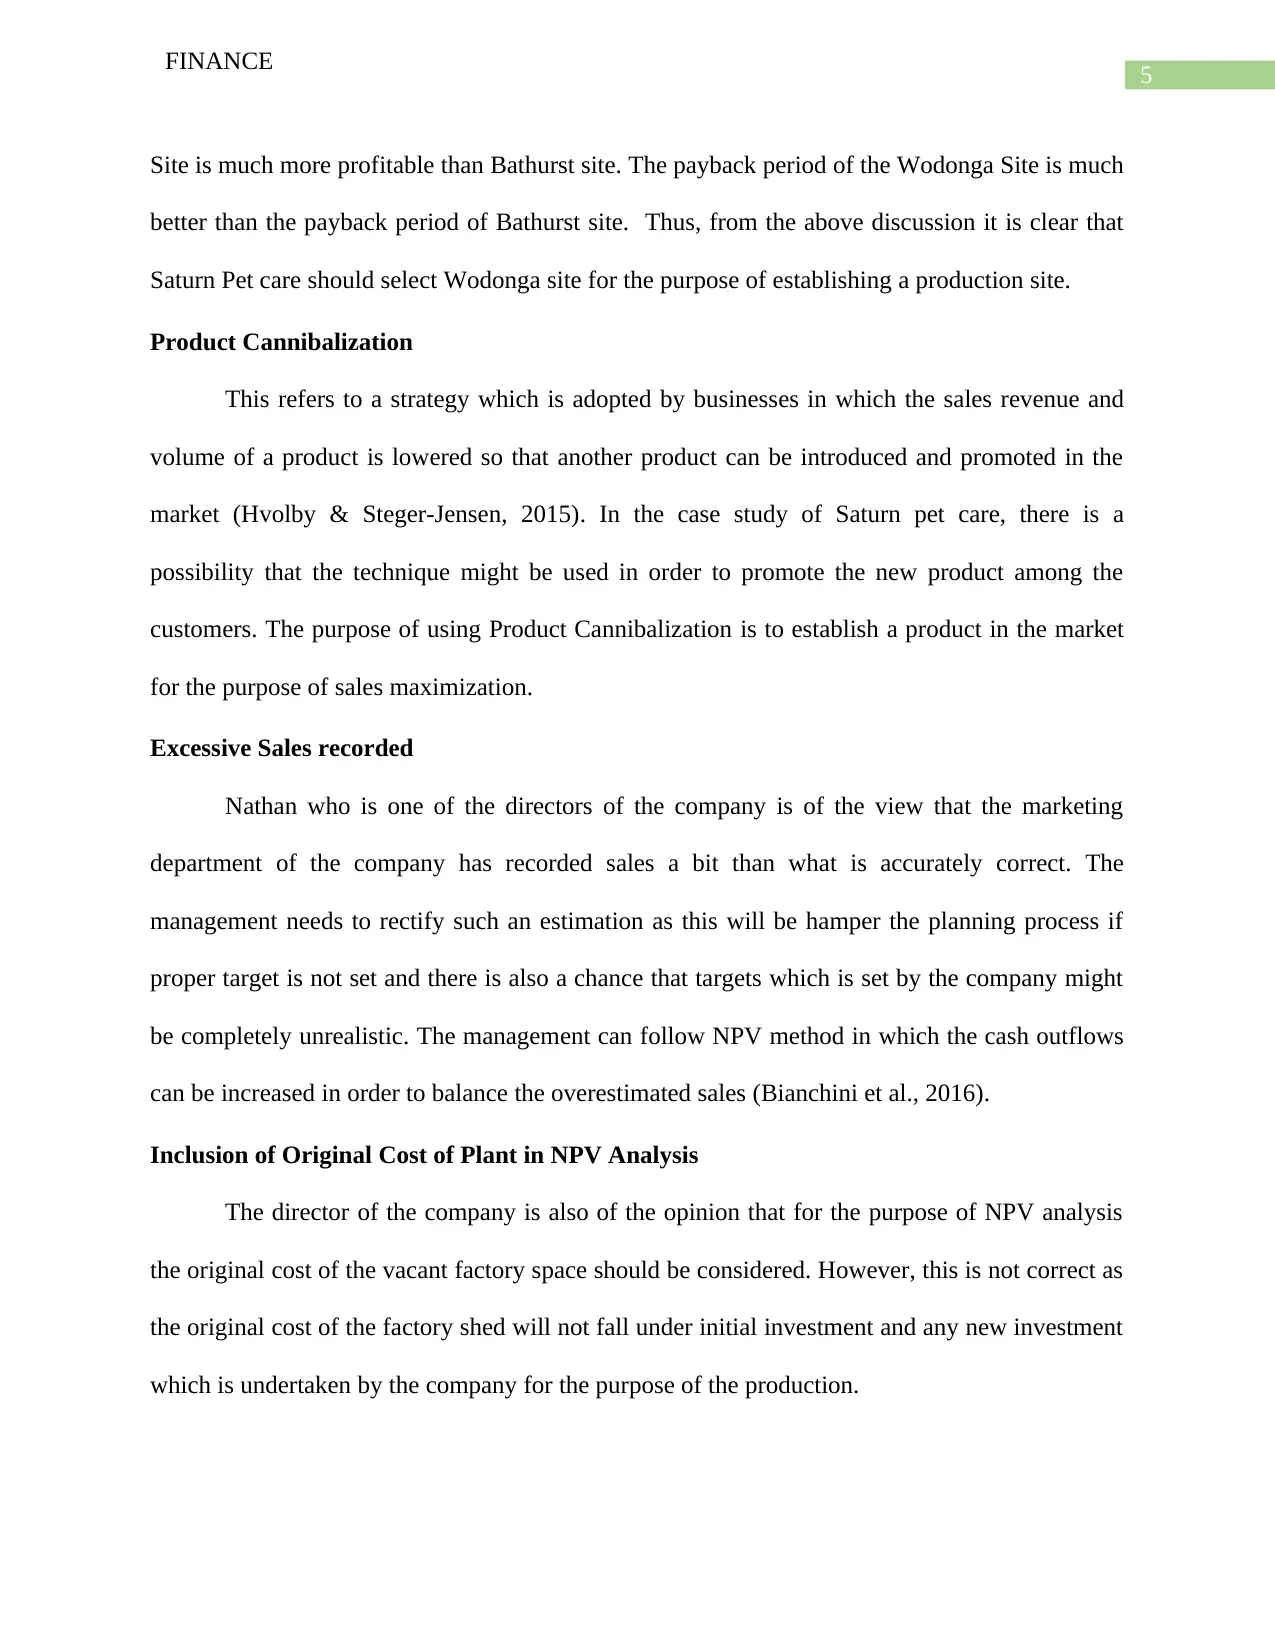
Capital Structure and Cost of Capital
Particulars Amount Weightage
(in '000s)
Total Equity $2,72,341 100%
Secured Borrowings $0 0%
TOTAL CAPITAL $2,72,341 100%
CURRENT CAPITAL STRUCTURE:
Figure 3: (Table Showing capital structure of ARB Ltd)
Source: (Created by Author)
The capital structure of ARB ltd clearly shows that the business only uses equity-based
capital for financing different activities of the business (Bartoloni, 2013). In other words, the
capital structure of the company is made up of only equity capital and there is no presence of
debt capital in the capital mix of the business (Ghosh, 2017). The equity capital which is used by
ARB ltd is of $ 2,72.341 which is shown in the financial statement of the company.
The beta of the company is shown at 0.89 and the market return of the company is shown
at 8.54% which are used for the purpose of computation of Cost of capital under Capital Asset
Pricing Model (CAPM). The cost of equity which is calculated as per the general method is
FINANCE
Part B
Introduction
This part of the assignment will be focusing on the analysis of the capital structure and its
effectiveness of ARB ltd. The capital structure of the company will be compared with another
company’s structure so as to establish which business has an effective capital structure. ARB ltd
is engaged in the manufacture of road motor vehicle accessories.
Discussions
Capital Structure and Cost of Capital
Particulars Amount Weightage
(in '000s)
Total Equity $2,72,341 100%
Secured Borrowings $0 0%
TOTAL CAPITAL $2,72,341 100%
CURRENT CAPITAL STRUCTURE:
Figure 3: (Table Showing capital structure of ARB Ltd)
Source: (Created by Author)
The capital structure of ARB ltd clearly shows that the business only uses equity-based
capital for financing different activities of the business (Bartoloni, 2013). In other words, the
capital structure of the company is made up of only equity capital and there is no presence of
debt capital in the capital mix of the business (Ghosh, 2017). The equity capital which is used by
ARB ltd is of $ 2,72.341 which is shown in the financial statement of the company.
The beta of the company is shown at 0.89 and the market return of the company is shown
at 8.54% which are used for the purpose of computation of Cost of capital under Capital Asset
Pricing Model (CAPM). The cost of equity which is calculated as per the general method is
Paraphrase This Document
Need a fresh take? Get an instant paraphrase of this document with our AI Paraphraser
7
FINANCE
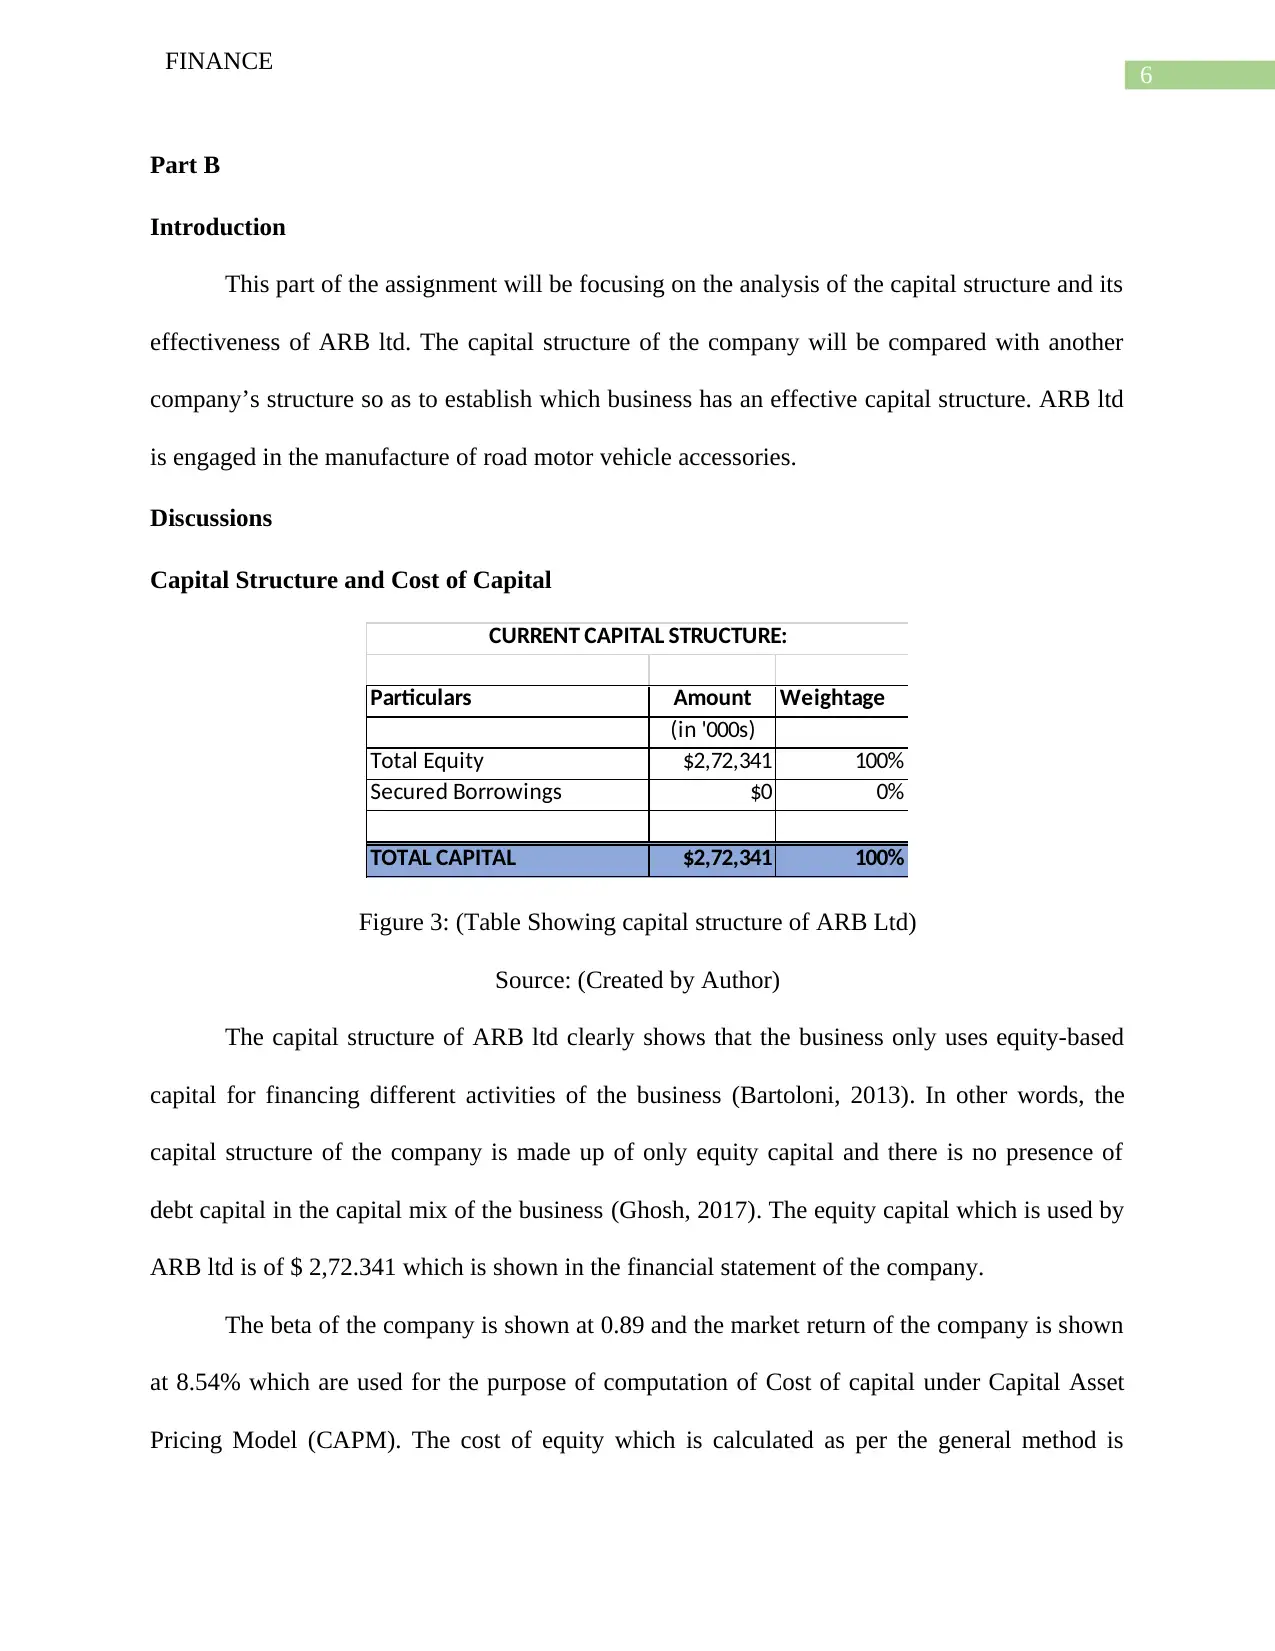
computed at 18.05% for the year 2017 which has reduced from the previous year’s estimates
which was 19.01%. As the company does not uses any debts the business therefore will be
having no cost of debt and also the cost of equity of the business will be regarded as the overall
cost of capital of the business.
WACC:
Particulars 2017 2016 2015 2014
(in '000s) (in '000s) (in '000s) (in '000s)
Net profit after Tax $49,152 $47,439 $44,093 $42,570
Total Equity $2,72,341 $2,49,608 $2,26,348 $1,97,814
Cost of Equity 18.05% 19.01% 19.48% 21.52%
Weightage of Equity 100.00% 100.00% 99.12% 100.00%
Interest Expenses for
secured borrowings 0 0 220 0
Secured Borrowings $0 $0 $2,000 $0
Cost of Debt 0% 0% 11.00% 0%
Weightage of Debt 0% 0% 1% 0%
Tax Rate 30% 30% 30% 30%
WACC 18.05% 19.01% 19.39% 21.52%
Figure 4: (Table Showing cost of capital of ARB Ltd)
Source: (Created by Author)
The cost of equity which is calculated following CAPM method requires risk free rate of
return, beta and market rate of return (Lasfer, 2015). The cost of capital which is calculated
following CAPM model comes to 7.906%. This shows that the company is meeting the needs of
the shareholders expectation as the market return is more than the expected cost of capital as per
CAPM method (Evstigneev, Hens & Schenk-Hoppé, 2015).
FINANCE
computed at 18.05% for the year 2017 which has reduced from the previous year’s estimates
which was 19.01%. As the company does not uses any debts the business therefore will be
having no cost of debt and also the cost of equity of the business will be regarded as the overall
cost of capital of the business.
WACC:
Particulars 2017 2016 2015 2014
(in '000s) (in '000s) (in '000s) (in '000s)
Net profit after Tax $49,152 $47,439 $44,093 $42,570
Total Equity $2,72,341 $2,49,608 $2,26,348 $1,97,814
Cost of Equity 18.05% 19.01% 19.48% 21.52%
Weightage of Equity 100.00% 100.00% 99.12% 100.00%
Interest Expenses for
secured borrowings 0 0 220 0
Secured Borrowings $0 $0 $2,000 $0
Cost of Debt 0% 0% 11.00% 0%
Weightage of Debt 0% 0% 1% 0%
Tax Rate 30% 30% 30% 30%
WACC 18.05% 19.01% 19.39% 21.52%
Figure 4: (Table Showing cost of capital of ARB Ltd)
Source: (Created by Author)
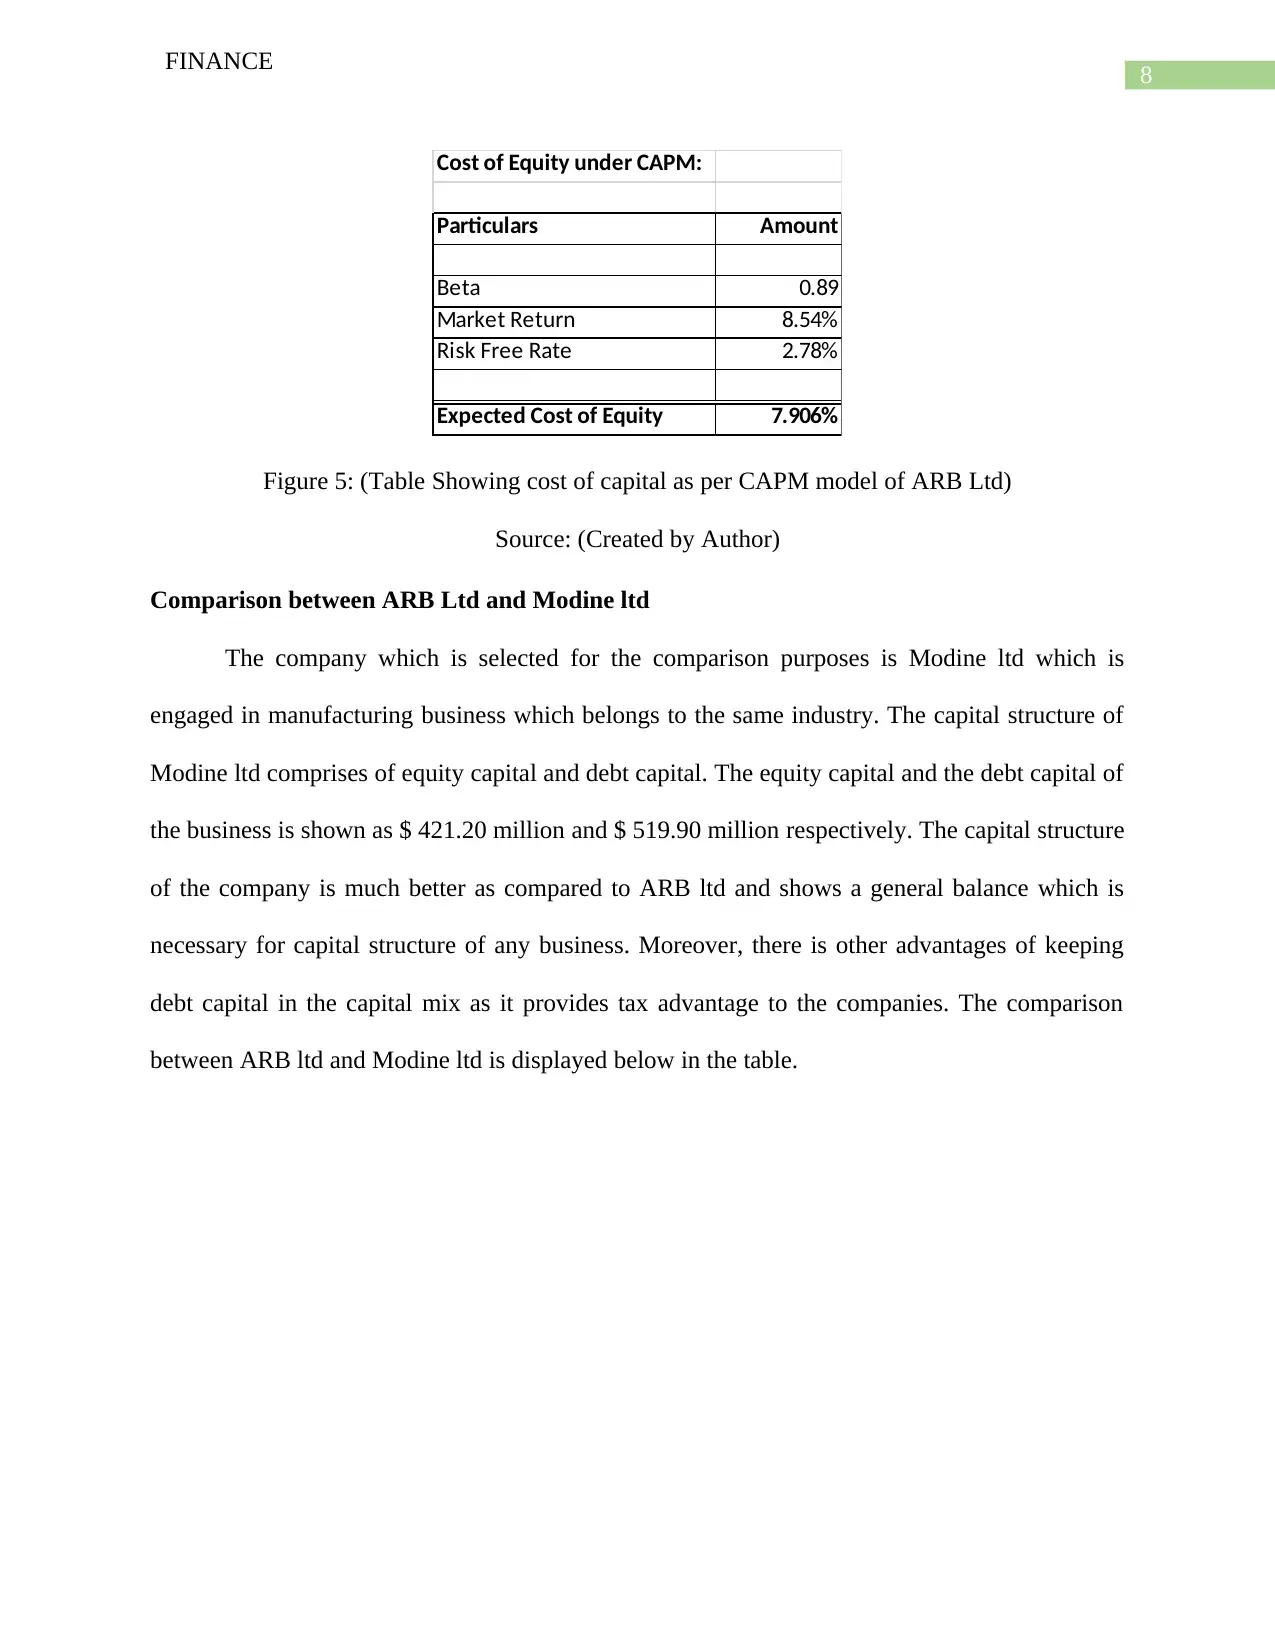
The cost of equity which is calculated following CAPM method requires risk free rate of
return, beta and market rate of return (Lasfer, 2015). The cost of capital which is calculated
following CAPM model comes to 7.906%. This shows that the company is meeting the needs of
the shareholders expectation as the market return is more than the expected cost of capital as per
CAPM method (Evstigneev, Hens & Schenk-Hoppé, 2015).
8
FINANCE
Cost of Equity under CAPM:
Particulars Amount
Beta 0.89
Market Return 8.54%
Risk Free Rate 2.78%
Expected Cost of Equity 7.906%
Figure 5: (Table Showing cost of capital as per CAPM model of ARB Ltd)
Source: (Created by Author)
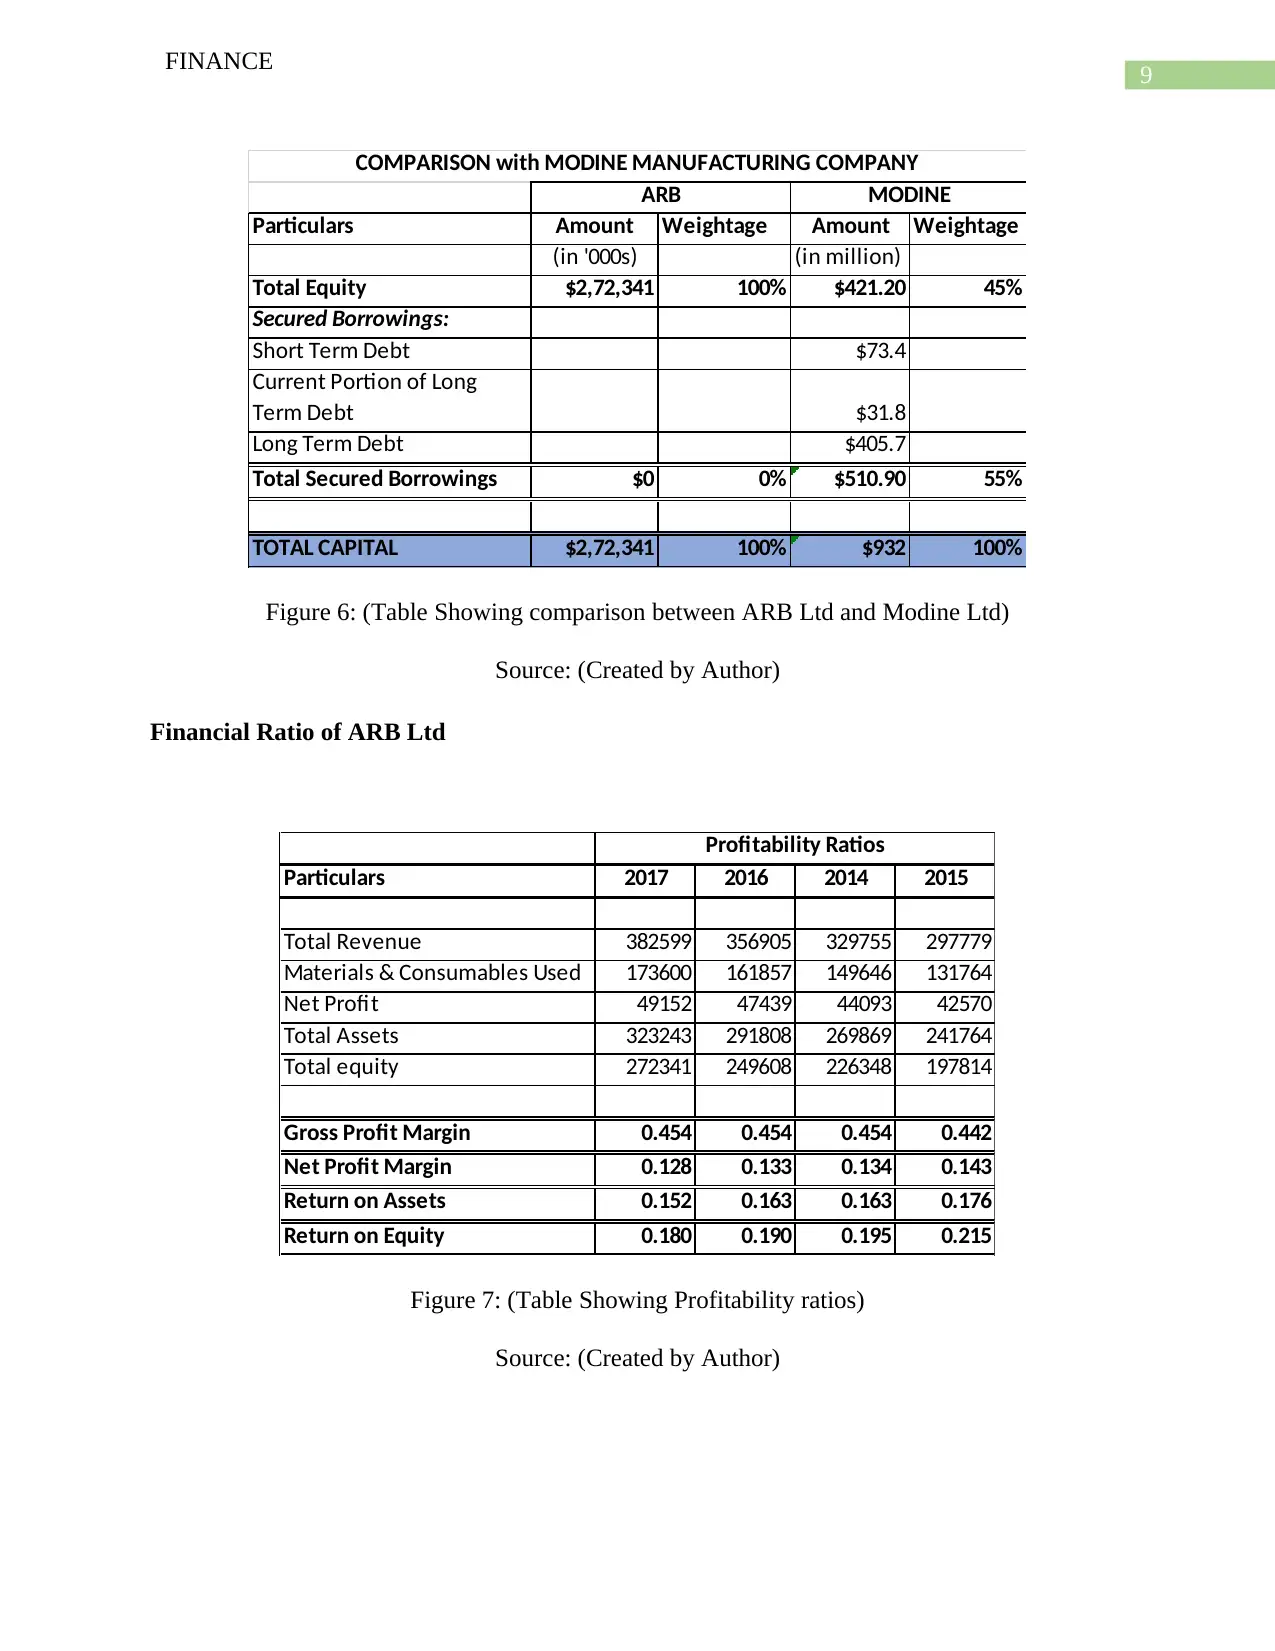
Comparison between ARB Ltd and Modine ltd
The company which is selected for the comparison purposes is Modine ltd which is
engaged in manufacturing business which belongs to the same industry. The capital structure of
Modine ltd comprises of equity capital and debt capital. The equity capital and the debt capital of
the business is shown as $ 421.20 million and $ 519.90 million respectively. The capital structure
of the company is much better as compared to ARB ltd and shows a general balance which is
necessary for capital structure of any business. Moreover, there is other advantages of keeping
debt capital in the capital mix as it provides tax advantage to the companies. The comparison
between ARB ltd and Modine ltd is displayed below in the table.
FINANCE
Cost of Equity under CAPM:
Particulars Amount
Beta 0.89
Market Return 8.54%
Risk Free Rate 2.78%
Expected Cost of Equity 7.906%
Figure 5: (Table Showing cost of capital as per CAPM model of ARB Ltd)
Source: (Created by Author)
Comparison between ARB Ltd and Modine ltd
The company which is selected for the comparison purposes is Modine ltd which is
engaged in manufacturing business which belongs to the same industry. The capital structure of
Modine ltd comprises of equity capital and debt capital. The equity capital and the debt capital of
the business is shown as $ 421.20 million and $ 519.90 million respectively. The capital structure
of the company is much better as compared to ARB ltd and shows a general balance which is
necessary for capital structure of any business. Moreover, there is other advantages of keeping
debt capital in the capital mix as it provides tax advantage to the companies. The comparison
between ARB ltd and Modine ltd is displayed below in the table.
⊘ This is a preview!⊘
Do you want full access?
Subscribe today to unlock all pages.
Trusted by 1+ million students worldwide
9
FINANCE
Particulars Amount Weightage Amount Weightage
(in '000s) (in million)
Total Equity $2,72,341 100% $421.20 45%
Secured Borrowings:
Short Term Debt $73.4
Current Portion of Long
Term Debt $31.8
Long Term Debt $405.7
Total Secured Borrowings $0 0% $510.90 55%
TOTAL CAPITAL $2,72,341 100% $932 100%
ARB MODINE
COMPARISON with MODINE MANUFACTURING COMPANY
Figure 6: (Table Showing comparison between ARB Ltd and Modine Ltd)
Source: (Created by Author)
Financial Ratio of ARB Ltd
Particulars 2017 2016 2014 2015
Total Revenue 382599 356905 329755 297779
Materials & Consumables Used 173600 161857 149646 131764
Net Profit 49152 47439 44093 42570
Total Assets 323243 291808 269869 241764
Total equity 272341 249608 226348 197814
Gross Profit Margin 0.454 0.454 0.454 0.442
Net Profit Margin 0.128 0.133 0.134 0.143
Return on Assets 0.152 0.163 0.163 0.176
Return on Equity 0.180 0.190 0.195 0.215
Profitability Ratios
Figure 7: (Table Showing Profitability ratios)
Source: (Created by Author)
Paraphrase This Document
Need a fresh take? Get an instant paraphrase of this document with our AI Paraphraser
10
FINANCE
Particulars 2017 2016 2014 2015
Total Assets 323243 291808 269869 241764
Total equity 272341 249608 226348 197814
Total Liabilities 50902 42200 43521 43950
Current Assets 169177 148466 133820 150620
Current Liabilities 49785 40944 42544 43230
Finance Costs 11 170 220 0
Operating Profit 67512 64549 60236 57291
Current Ratio 3.398 3.626 3.145 3.484
Time Interest Earned Ratio 6137.455 379.700 273.800
Debt-to-Equity Ratio 0.187 0.169 0.192 0.222
Debt Ratio 0.157 0.145 0.161 0.182
Equity Ratio 0.843 0.855 0.839 0.818
Solvency Ratio
Figure 8: (Table Showing Solvency ratios)
Source: (Created by Author)
Particulars 2017 2016 2014 2015
Inventory 88020 86941 77821 70443
Trade Receivables 50840 44425 42216 39762
Trade Payables 35279 27754 28874 30202
Cost of Goods Sold 173600 161857 149646 131764
Sales Revenue 382599 356905 329755 297779
Inventory Turnover Ratio 1.972 1.862 1.923 1.871
Payables Turnover Ratio 4.921 5.832 5.183 4.363
Receivables Turnover Ratio 7.526 8.034 7.811 7.489
Efficiency Ratio
Figure 9: (Table Showing Solvency ratios)
Source: (Created by Author)
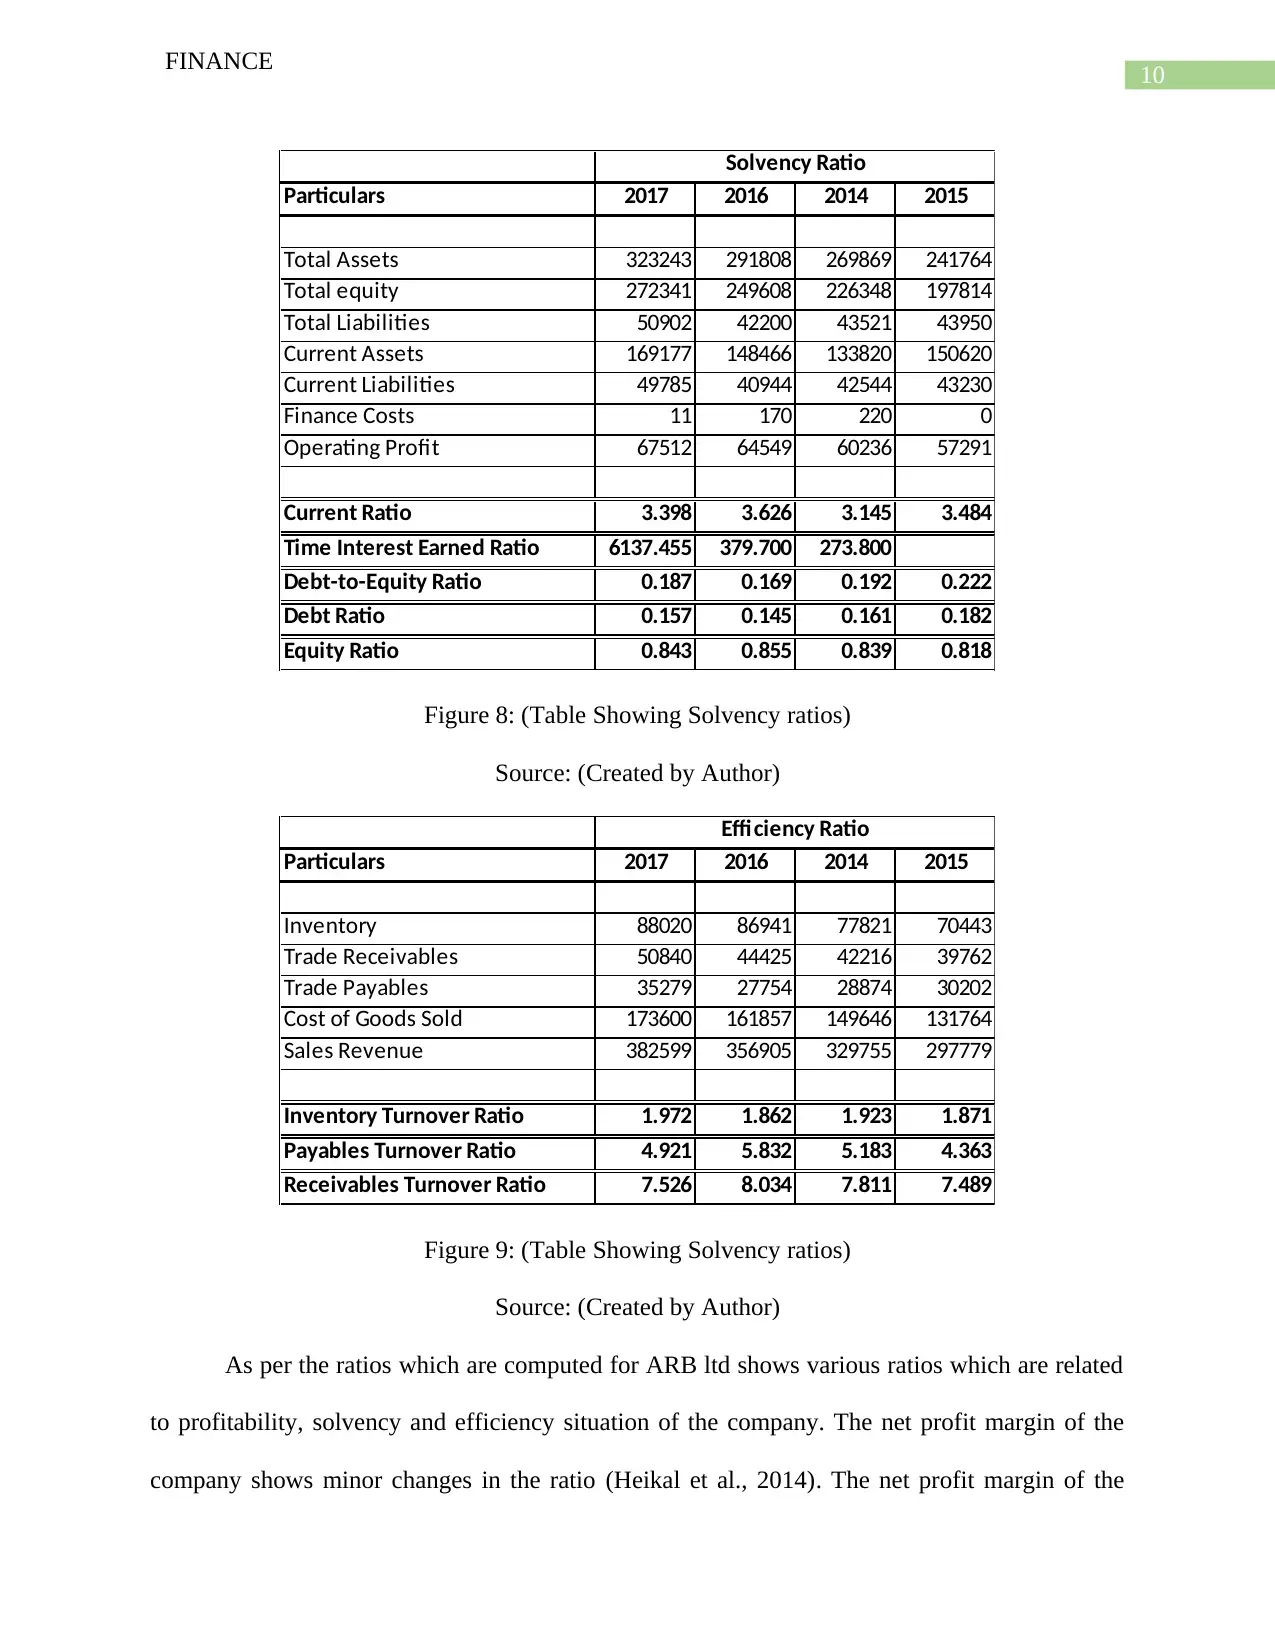
As per the ratios which are computed for ARB ltd shows various ratios which are related
to profitability, solvency and efficiency situation of the company. The net profit margin of the
company shows minor changes in the ratio (Heikal et al., 2014). The net profit margin of the
FINANCE
Particulars 2017 2016 2014 2015
Total Assets 323243 291808 269869 241764
Total equity 272341 249608 226348 197814
Total Liabilities 50902 42200 43521 43950
Current Assets 169177 148466 133820 150620
Current Liabilities 49785 40944 42544 43230
Finance Costs 11 170 220 0
Operating Profit 67512 64549 60236 57291
Current Ratio 3.398 3.626 3.145 3.484
Time Interest Earned Ratio 6137.455 379.700 273.800
Debt-to-Equity Ratio 0.187 0.169 0.192 0.222
Debt Ratio 0.157 0.145 0.161 0.182
Equity Ratio 0.843 0.855 0.839 0.818
Solvency Ratio
Figure 8: (Table Showing Solvency ratios)
Source: (Created by Author)
Particulars 2017 2016 2014 2015
Inventory 88020 86941 77821 70443
Trade Receivables 50840 44425 42216 39762
Trade Payables 35279 27754 28874 30202
Cost of Goods Sold 173600 161857 149646 131764
Sales Revenue 382599 356905 329755 297779
Inventory Turnover Ratio 1.972 1.862 1.923 1.871
Payables Turnover Ratio 4.921 5.832 5.183 4.363
Receivables Turnover Ratio 7.526 8.034 7.811 7.489
Efficiency Ratio
Figure 9: (Table Showing Solvency ratios)
Source: (Created by Author)
As per the ratios which are computed for ARB ltd shows various ratios which are related
to profitability, solvency and efficiency situation of the company. The net profit margin of the
company shows minor changes in the ratio (Heikal et al., 2014). The net profit margin of the
11
FINANCE
company has reduced from the previous year. The return on assets and return on equity has
estimates have reduced from previous year’s estimates which can be due to the slight fall in the
net profit of the company. The solvency ratio shows that the current ratio of the company has
increased from previous year which is a positive sign as it means that the business has a strong
liquidity situation (Pierret, 2015). The debt equity ratio for the year 2017 is 0.157 and the same
was 0.145 in 2016. The debt equity ratio signifies that the debts of the company have increased
and the company is applying more debt capital in the capital mix. The efficiency ratio of the
company shows that the inventory turnover ratio of the business has increased from previous
year’s figure which is a positive sign for the business (Mowris, 2013). The debtor turnover ratio
show that it has decreased from previous year which shows that the debt collection policy of the
company can further improve.
Change in Capital Structure
The capital structure of the company shows that at present the company is only relying on
equity capital which forms 100% of the capital structure of the company. In 2016 as well, the
equity share capital is shown at $ 2,49,608 which is the only capital used in the capital structure
mix by the management of the company. In 2015 however, the company used some portion of
debt capital which is of $ 2000 in the capital mix. Thus from 2015, the company approach
towards capital structure has significantly changed.
⊘ This is a preview!⊘
Do you want full access?
Subscribe today to unlock all pages.
Trusted by 1+ million students worldwide
1 out of 16
Related Documents


Your All-in-One AI-Powered Toolkit for Academic Success.
+13062052269
info@desklib.com
Available 24*7 on WhatsApp / Email
![[object Object]](/_next/static/media/star-bottom.7253800d.svg)
Unlock your academic potential
Copyright © 2020–2026 A2Z Services. All Rights Reserved. Developed and managed by ZUCOL.