Accounting and Finance: Capital Budgeting and Capital Structure Report
VerifiedAdded on 2021/05/31
|14
|1877
|20
Report
AI Summary
This report presents an analysis of two case studies focusing on financial management principles. The first case study, involving Saturn Pet Care, evaluates two production site options (Bathurst and Wodonga) using capital budgeting techniques such as NPV, profitability index, and payback period to determine the most viable site for a new product launch. The analysis reveals that the Wodonga site is the superior choice. The second case study examines ARB Ltd's capital structure, assessing its effectiveness and comparing it to a competitor, Modine Ltd. The report calculates the Weighted Average Cost of Capital (WACC) and the cost of equity under the CAPM approach. It also evaluates financial ratios, identifies changes in capital structure over time, and provides recommendations for improving the company's financial performance, including enhancing wealth maximization and incorporating debt capital to achieve a balanced capital structure. The report highlights the importance of these strategies for mitigating financial risks and improving shareholder value.
Running head: ACCOUNTING AND FINANCE
ACCOUNTING AND FINANCE
Name of the Student:
Name of the University:
Author’s Note:
ACCOUNTING AND FINANCE
Name of the Student:
Name of the University:
Author’s Note:
Paraphrase This Document
Need a fresh take? Get an instant paraphrase of this document with our AI Paraphraser
1
ACCOUNTING AND FINANCE
Executive Summary
The assignment is about two different case studies which deals with two different situations. The
first case study deals with Saturn pet care which is engaged in manufacture of products for pets.
The company is trying to expand its business by introducing a new product in the market for
which the company has option of selection from two different production sites which are
Bathurst site and Wodonga site. The assignment will involve capital budgeting techniques for the
purpose of selecting one of the production sites. The second case study deals with ARB ltd
which is engaged in manufacturing business for road motors accessories. This part will deal with
the analysis of the capital structure of ARB ltd and also comment on the effectiveness of the
same.
2
ACCOUNTING AND FINANCE
Table of Contents
Part A...............................................................................................................................................3
Capital Budgeting of Bathurst Site and Wodonga Site...............................................................3
Product Cannibalization...............................................................................................................5
Rectifying the Excessive Sales Recorded....................................................................................5
Inclusion of Original Cost of Old Factory Shed..........................................................................5
Part B...............................................................................................................................................6
Introduction..................................................................................................................................6
Capital Structure and Cost of Capital..........................................................................................6
Weighted Average Cost of Capital..............................................................................................6
Cost of Capital Under CAPM......................................................................................................7
Comparison between ARB ltd and Modine ltd............................................................................8
Financial Ratios of ARB Ltd.......................................................................................................9
Changes in capital structure.......................................................................................................10
Wealth Maximization................................................................................................................11
Recommendations and Conclusion................................................................................................11
Reference.......................................................................................................................................13
⊘ This is a preview!⊘
Do you want full access?
Subscribe today to unlock all pages.
Trusted by 1+ million students worldwide
3
ACCOUNTING AND FINANCE
Part A
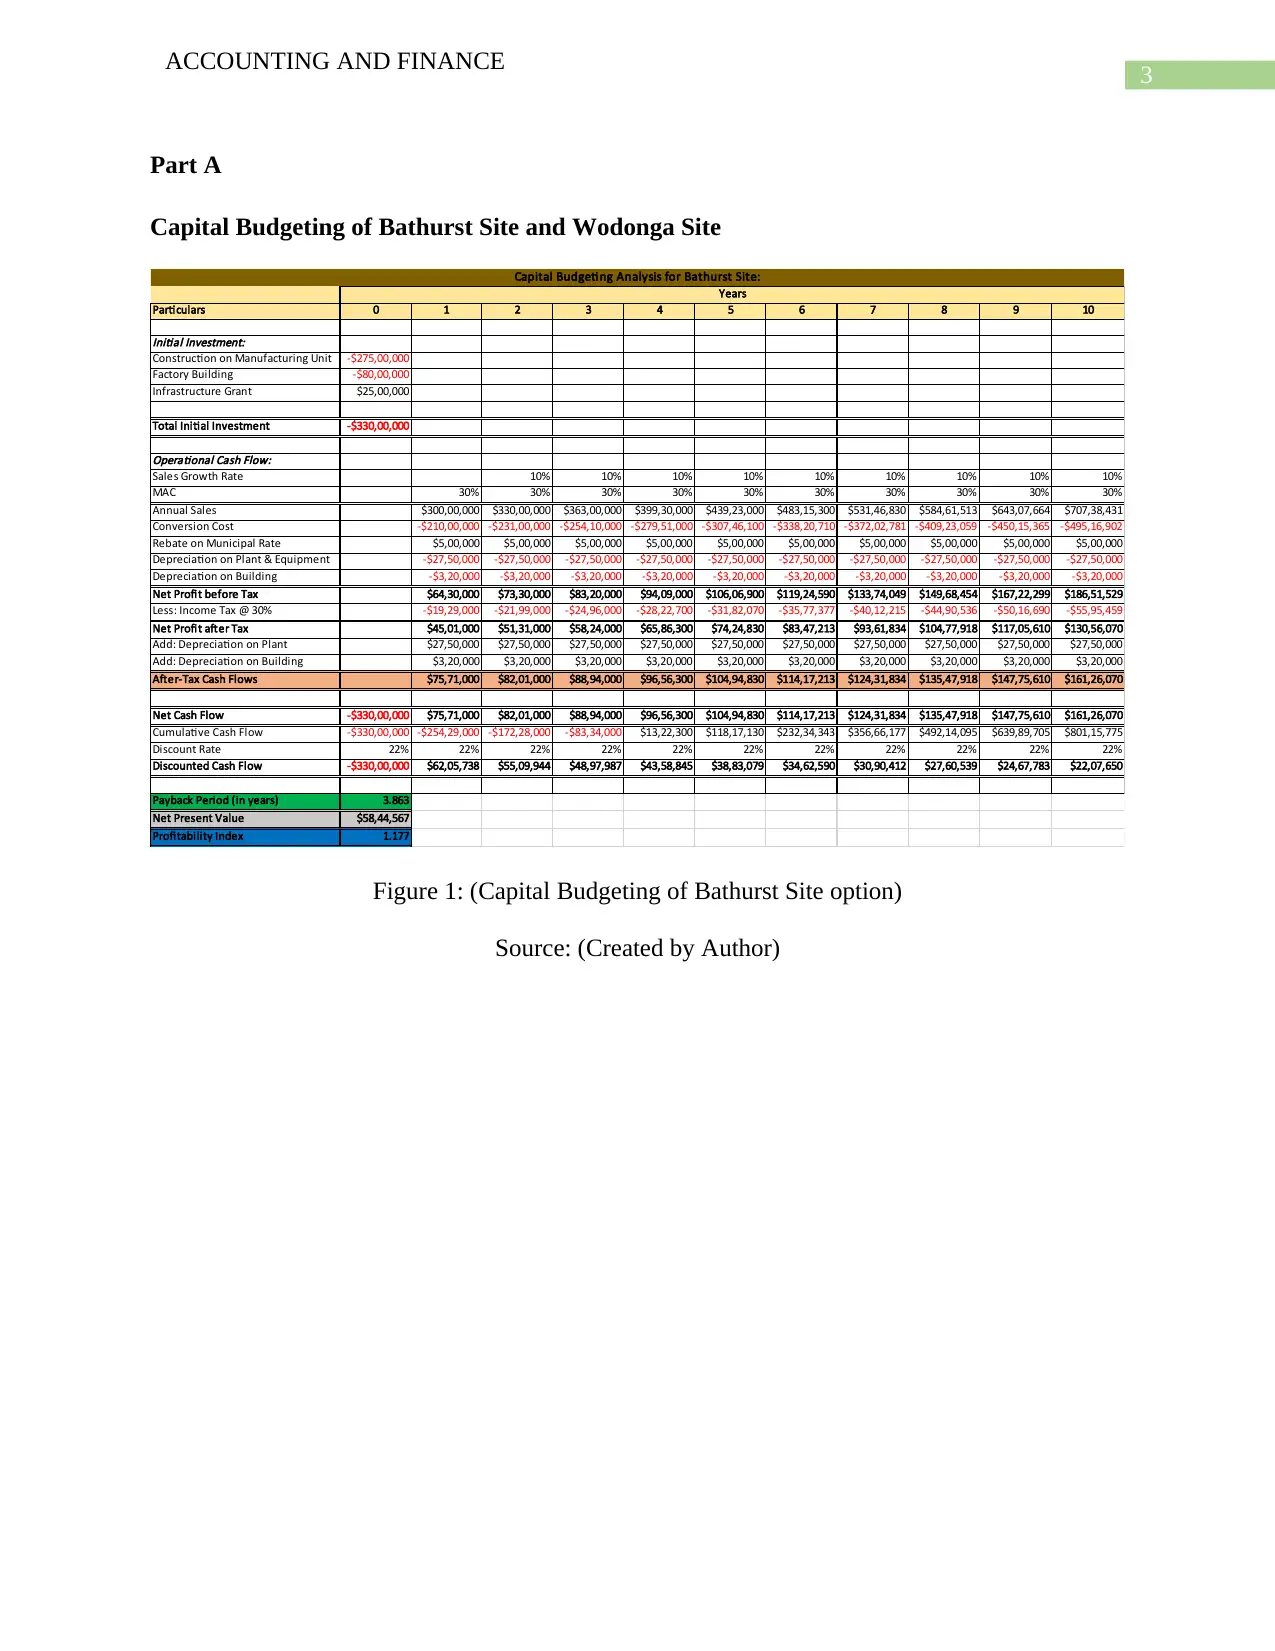
Capital Budgeting of Bathurst Site and Wodonga Site
Particulars 0 1 2 3 4 5 6 7 8 9 10
Initial Investment:
Construction on Manufacturing Unit -$275,00,000
Factory Building -$80,00,000
Infrastructure Grant $25,00,000
Total Initial Investment -$330,00,000
Operational Cash Flow:
Sales Growth Rate 10% 10% 10% 10% 10% 10% 10% 10% 10%
MAC 30% 30% 30% 30% 30% 30% 30% 30% 30% 30%
Annual Sales $300,00,000 $330,00,000 $363,00,000 $399,30,000 $439,23,000 $483,15,300 $531,46,830 $584,61,513 $643,07,664 $707,38,431
Conversion Cost -$210,00,000 -$231,00,000 -$254,10,000 -$279,51,000 -$307,46,100 -$338,20,710 -$372,02,781 -$409,23,059 -$450,15,365 -$495,16,902
Rebate on Municipal Rate $5,00,000 $5,00,000 $5,00,000 $5,00,000 $5,00,000 $5,00,000 $5,00,000 $5,00,000 $5,00,000 $5,00,000
Depreciation on Plant & Equipment -$27,50,000 -$27,50,000 -$27,50,000 -$27,50,000 -$27,50,000 -$27,50,000 -$27,50,000 -$27,50,000 -$27,50,000 -$27,50,000
Depreciation on Building -$3,20,000 -$3,20,000 -$3,20,000 -$3,20,000 -$3,20,000 -$3,20,000 -$3,20,000 -$3,20,000 -$3,20,000 -$3,20,000
Net Profit before Tax $64,30,000 $73,30,000 $83,20,000 $94,09,000 $106,06,900 $119,24,590 $133,74,049 $149,68,454 $167,22,299 $186,51,529
Less: Income Tax @ 30% -$19,29,000 -$21,99,000 -$24,96,000 -$28,22,700 -$31,82,070 -$35,77,377 -$40,12,215 -$44,90,536 -$50,16,690 -$55,95,459
Net Profit after Tax $45,01,000 $51,31,000 $58,24,000 $65,86,300 $74,24,830 $83,47,213 $93,61,834 $104,77,918 $117,05,610 $130,56,070
Add: Depreciation on Plant $27,50,000 $27,50,000 $27,50,000 $27,50,000 $27,50,000 $27,50,000 $27,50,000 $27,50,000 $27,50,000 $27,50,000
Add: Depreciation on Building $3,20,000 $3,20,000 $3,20,000 $3,20,000 $3,20,000 $3,20,000 $3,20,000 $3,20,000 $3,20,000 $3,20,000
After-Tax Cash Flows $75,71,000 $82,01,000 $88,94,000 $96,56,300 $104,94,830 $114,17,213 $124,31,834 $135,47,918 $147,75,610 $161,26,070
Net Cash Flow -$330,00,000 $75,71,000 $82,01,000 $88,94,000 $96,56,300 $104,94,830 $114,17,213 $124,31,834 $135,47,918 $147,75,610 $161,26,070
Cumulative Cash Flow -$330,00,000 -$254,29,000 -$172,28,000 -$83,34,000 $13,22,300 $118,17,130 $232,34,343 $356,66,177 $492,14,095 $639,89,705 $801,15,775
Discount Rate 22% 22% 22% 22% 22% 22% 22% 22% 22% 22% 22%
Discounted Cash Flow -$330,00,000 $62,05,738 $55,09,944 $48,97,987 $43,58,845 $38,83,079 $34,62,590 $30,90,412 $27,60,539 $24,67,783 $22,07,650
Payback Period (in years) 3.863
Net Present Value $58,44,567
Profitability Index 1.177
Years
Capital Budgeting Analysis for Bathurst Site:
Figure 1: (Capital Budgeting of Bathurst Site option)
Source: (Created by Author)
ACCOUNTING AND FINANCE
Part A
Capital Budgeting of Bathurst Site and Wodonga Site
Particulars 0 1 2 3 4 5 6 7 8 9 10
Initial Investment:
Construction on Manufacturing Unit -$275,00,000
Factory Building -$80,00,000
Infrastructure Grant $25,00,000
Total Initial Investment -$330,00,000
Operational Cash Flow:
Sales Growth Rate 10% 10% 10% 10% 10% 10% 10% 10% 10%
MAC 30% 30% 30% 30% 30% 30% 30% 30% 30% 30%
Annual Sales $300,00,000 $330,00,000 $363,00,000 $399,30,000 $439,23,000 $483,15,300 $531,46,830 $584,61,513 $643,07,664 $707,38,431
Conversion Cost -$210,00,000 -$231,00,000 -$254,10,000 -$279,51,000 -$307,46,100 -$338,20,710 -$372,02,781 -$409,23,059 -$450,15,365 -$495,16,902
Rebate on Municipal Rate $5,00,000 $5,00,000 $5,00,000 $5,00,000 $5,00,000 $5,00,000 $5,00,000 $5,00,000 $5,00,000 $5,00,000
Depreciation on Plant & Equipment -$27,50,000 -$27,50,000 -$27,50,000 -$27,50,000 -$27,50,000 -$27,50,000 -$27,50,000 -$27,50,000 -$27,50,000 -$27,50,000
Depreciation on Building -$3,20,000 -$3,20,000 -$3,20,000 -$3,20,000 -$3,20,000 -$3,20,000 -$3,20,000 -$3,20,000 -$3,20,000 -$3,20,000
Net Profit before Tax $64,30,000 $73,30,000 $83,20,000 $94,09,000 $106,06,900 $119,24,590 $133,74,049 $149,68,454 $167,22,299 $186,51,529
Less: Income Tax @ 30% -$19,29,000 -$21,99,000 -$24,96,000 -$28,22,700 -$31,82,070 -$35,77,377 -$40,12,215 -$44,90,536 -$50,16,690 -$55,95,459
Net Profit after Tax $45,01,000 $51,31,000 $58,24,000 $65,86,300 $74,24,830 $83,47,213 $93,61,834 $104,77,918 $117,05,610 $130,56,070
Add: Depreciation on Plant $27,50,000 $27,50,000 $27,50,000 $27,50,000 $27,50,000 $27,50,000 $27,50,000 $27,50,000 $27,50,000 $27,50,000
Add: Depreciation on Building $3,20,000 $3,20,000 $3,20,000 $3,20,000 $3,20,000 $3,20,000 $3,20,000 $3,20,000 $3,20,000 $3,20,000
After-Tax Cash Flows $75,71,000 $82,01,000 $88,94,000 $96,56,300 $104,94,830 $114,17,213 $124,31,834 $135,47,918 $147,75,610 $161,26,070
Net Cash Flow -$330,00,000 $75,71,000 $82,01,000 $88,94,000 $96,56,300 $104,94,830 $114,17,213 $124,31,834 $135,47,918 $147,75,610 $161,26,070
Cumulative Cash Flow -$330,00,000 -$254,29,000 -$172,28,000 -$83,34,000 $13,22,300 $118,17,130 $232,34,343 $356,66,177 $492,14,095 $639,89,705 $801,15,775
Discount Rate 22% 22% 22% 22% 22% 22% 22% 22% 22% 22% 22%
Discounted Cash Flow -$330,00,000 $62,05,738 $55,09,944 $48,97,987 $43,58,845 $38,83,079 $34,62,590 $30,90,412 $27,60,539 $24,67,783 $22,07,650
Payback Period (in years) 3.863
Net Present Value $58,44,567
Profitability Index 1.177
Years
Capital Budgeting Analysis for Bathurst Site:
Figure 1: (Capital Budgeting of Bathurst Site option)
Source: (Created by Author)
Paraphrase This Document
Need a fresh take? Get an instant paraphrase of this document with our AI Paraphraser
4
ACCOUNTING AND FINANCE
Particulars 0 1 2 3 4 5 6 7 8 9 10
Initial Investment:
Construction on Manufacturing Unit -$275,00,000
Value of Wodonga Site
Total Initial Investment -$275,00,000
Operational Cash Flow:
Sales Growth Rate 10% 10% 10% 10% 10% 10% 10% 10% 10%
MAC 30% 30% 30% 30% 30% 30% 30% 30% 30% 30%
Annual Sales $300,00,000 $330,00,000 $363,00,000 $399,30,000 $439,23,000 $483,15,300 $531,46,830 $584,61,513 $643,07,664 $707,38,431
Conversion Cost -$210,00,000 -$231,00,000 -$254,10,000 -$279,51,000 -$307,46,100 -$338,20,710 -$372,02,781 -$409,23,059 -$450,15,365 -$495,16,902
Depreciation on Plant & Equipment -$27,50,000 -$27,50,000 -$27,50,000 -$27,50,000 -$27,50,000 -$27,50,000 -$27,50,000 -$27,50,000 -$27,50,000 -$27,50,000
Depreciation on Building $0 $0 $0 $0 $0 $0 $0 $0 $0 $0
Net Profit before Tax $62,50,000 $71,50,000 $81,40,000 $92,29,000 $104,26,900 $117,44,590 $131,94,049 $147,88,454 $165,42,299 $184,71,529
Less: Income Tax @ 30% -$18,75,000 -$21,45,000 -$24,42,000 -$27,68,700 -$31,28,070 -$35,23,377 -$39,58,215 -$44,36,536 -$49,62,690 -$55,41,459
Net Profit after Tax $43,75,000 $50,05,000 $56,98,000 $64,60,300 $72,98,830 $82,21,213 $92,35,834 $103,51,918 $115,79,610 $129,30,070
Add: Depreciation on Plant $27,50,000 $27,50,000 $27,50,000 $27,50,000 $27,50,000 $27,50,000 $27,50,000 $27,50,000 $27,50,000 $27,50,000
Add: Depreciation on Building $0 $0 $0 $0 $0 $0 $0 $0 $0 $0
After-Tax Cash Flows $71,25,000 $77,55,000 $84,48,000 $92,10,300 $100,48,830 $109,71,213 $119,85,834 $131,01,918 $143,29,610 $156,80,070
Net Cash Flow -$275,00,000 $71,25,000 $77,55,000 $84,48,000 $92,10,300 $100,48,830 $109,71,213 $119,85,834 $131,01,918 $143,29,610 $156,80,070
Cumulative Cash Flow -$275,00,000 -$203,75,000 -$126,20,000 -$41,72,000 $50,38,300 $150,87,130 $260,58,343 $380,44,177 $511,46,095 $654,75,705 $811,55,775
Discount Rate 22% 22% 22% 22% 22% 22% 22% 22% 22% 22% 22%
Discounted Cash Flow -$275,00,000 $58,40,164 $52,10,293 $46,52,372 $41,57,521 $37,18,060 $33,27,328 $29,79,542 $26,69,662 $23,93,293 $21,46,593
Payback Period (in years) 3.453
Net Present Value $95,94,827
Profitability Index 1.349
Capital Budgeting Analysis for Wodonga Site:
Years
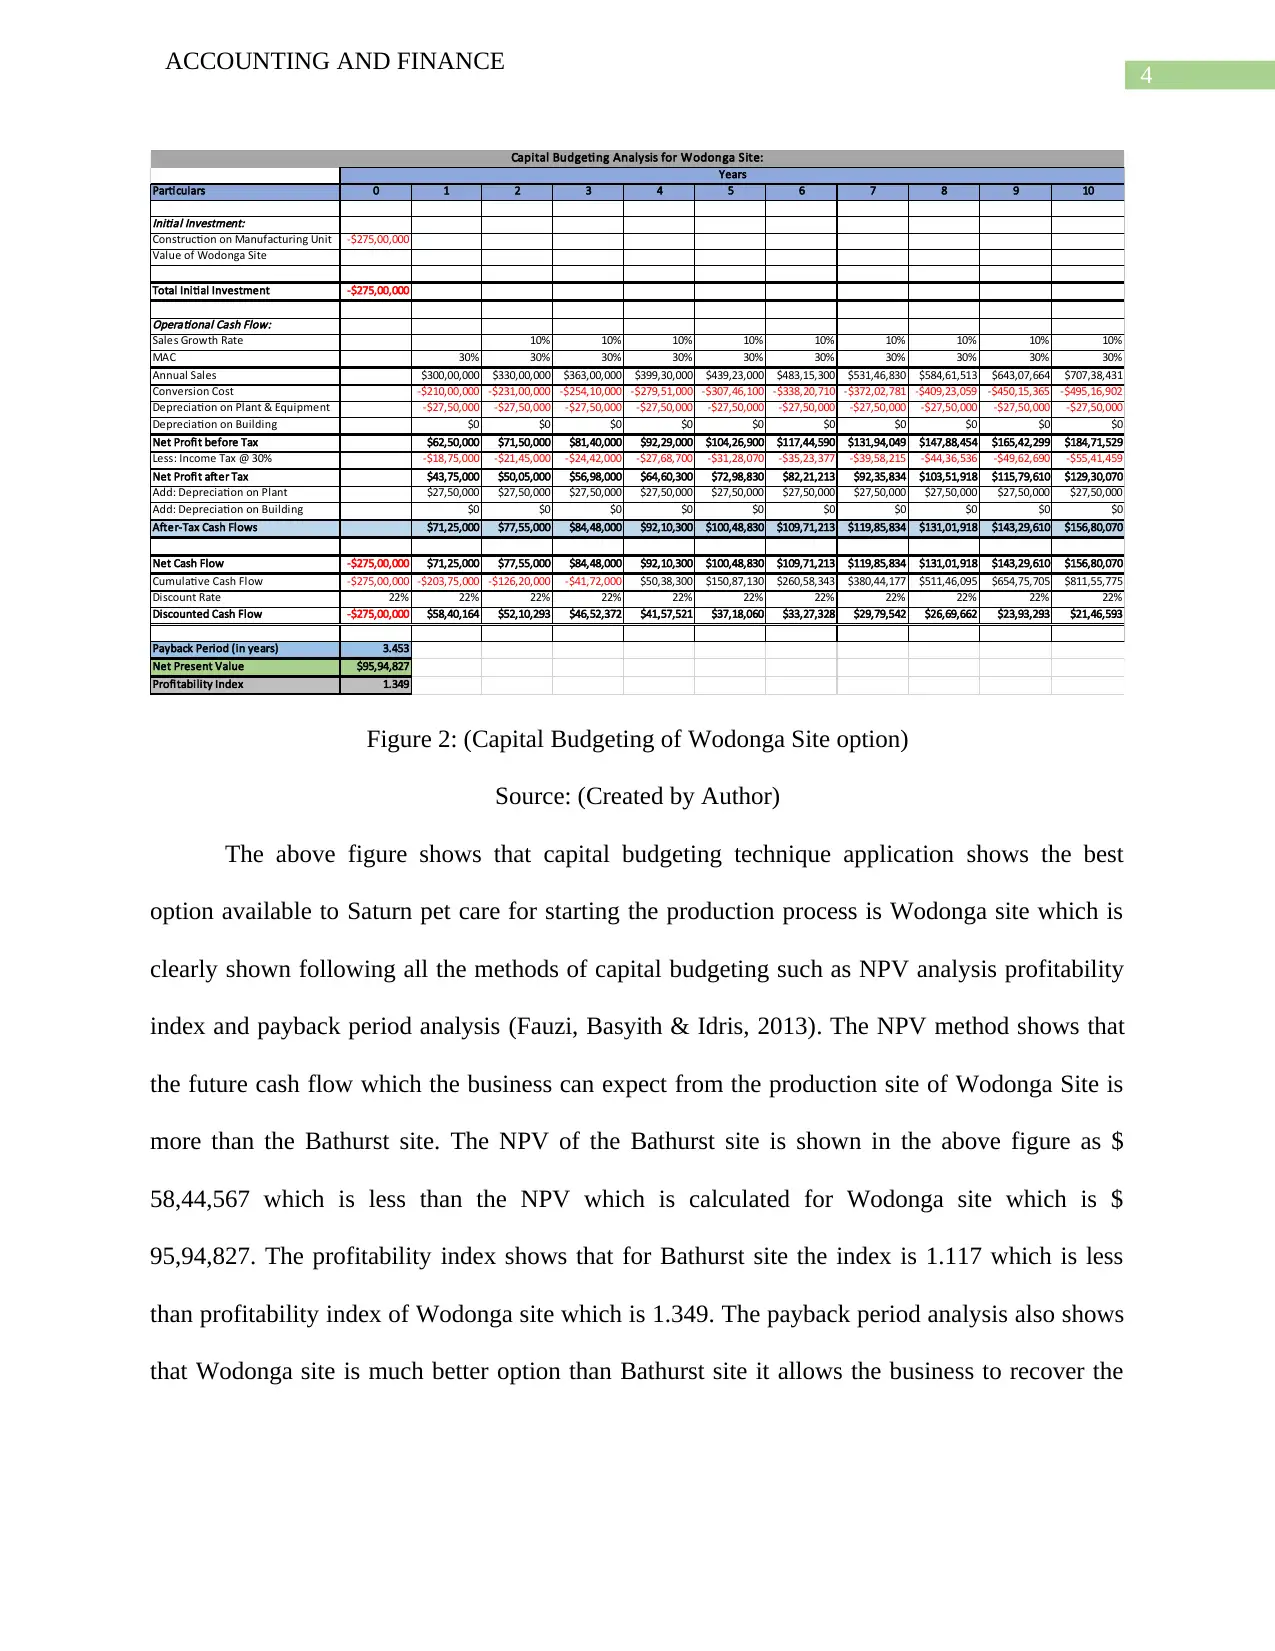
Figure 2: (Capital Budgeting of Wodonga Site option)
Source: (Created by Author)
The above figure shows that capital budgeting technique application shows the best
option available to Saturn pet care for starting the production process is Wodonga site which is
clearly shown following all the methods of capital budgeting such as NPV analysis profitability
index and payback period analysis (Fauzi, Basyith & Idris, 2013). The NPV method shows that
the future cash flow which the business can expect from the production site of Wodonga Site is
more than the Bathurst site. The NPV of the Bathurst site is shown in the above figure as $
58,44,567 which is less than the NPV which is calculated for Wodonga site which is $
95,94,827. The profitability index shows that for Bathurst site the index is 1.117 which is less
than profitability index of Wodonga site which is 1.349. The payback period analysis also shows
that Wodonga site is much better option than Bathurst site it allows the business to recover the
ACCOUNTING AND FINANCE
Particulars 0 1 2 3 4 5 6 7 8 9 10
Initial Investment:
Construction on Manufacturing Unit -$275,00,000
Value of Wodonga Site
Total Initial Investment -$275,00,000
Operational Cash Flow:
Sales Growth Rate 10% 10% 10% 10% 10% 10% 10% 10% 10%
MAC 30% 30% 30% 30% 30% 30% 30% 30% 30% 30%
Annual Sales $300,00,000 $330,00,000 $363,00,000 $399,30,000 $439,23,000 $483,15,300 $531,46,830 $584,61,513 $643,07,664 $707,38,431
Conversion Cost -$210,00,000 -$231,00,000 -$254,10,000 -$279,51,000 -$307,46,100 -$338,20,710 -$372,02,781 -$409,23,059 -$450,15,365 -$495,16,902
Depreciation on Plant & Equipment -$27,50,000 -$27,50,000 -$27,50,000 -$27,50,000 -$27,50,000 -$27,50,000 -$27,50,000 -$27,50,000 -$27,50,000 -$27,50,000
Depreciation on Building $0 $0 $0 $0 $0 $0 $0 $0 $0 $0
Net Profit before Tax $62,50,000 $71,50,000 $81,40,000 $92,29,000 $104,26,900 $117,44,590 $131,94,049 $147,88,454 $165,42,299 $184,71,529
Less: Income Tax @ 30% -$18,75,000 -$21,45,000 -$24,42,000 -$27,68,700 -$31,28,070 -$35,23,377 -$39,58,215 -$44,36,536 -$49,62,690 -$55,41,459
Net Profit after Tax $43,75,000 $50,05,000 $56,98,000 $64,60,300 $72,98,830 $82,21,213 $92,35,834 $103,51,918 $115,79,610 $129,30,070
Add: Depreciation on Plant $27,50,000 $27,50,000 $27,50,000 $27,50,000 $27,50,000 $27,50,000 $27,50,000 $27,50,000 $27,50,000 $27,50,000
Add: Depreciation on Building $0 $0 $0 $0 $0 $0 $0 $0 $0 $0
After-Tax Cash Flows $71,25,000 $77,55,000 $84,48,000 $92,10,300 $100,48,830 $109,71,213 $119,85,834 $131,01,918 $143,29,610 $156,80,070
Net Cash Flow -$275,00,000 $71,25,000 $77,55,000 $84,48,000 $92,10,300 $100,48,830 $109,71,213 $119,85,834 $131,01,918 $143,29,610 $156,80,070
Cumulative Cash Flow -$275,00,000 -$203,75,000 -$126,20,000 -$41,72,000 $50,38,300 $150,87,130 $260,58,343 $380,44,177 $511,46,095 $654,75,705 $811,55,775
Discount Rate 22% 22% 22% 22% 22% 22% 22% 22% 22% 22% 22%
Discounted Cash Flow -$275,00,000 $58,40,164 $52,10,293 $46,52,372 $41,57,521 $37,18,060 $33,27,328 $29,79,542 $26,69,662 $23,93,293 $21,46,593
Payback Period (in years) 3.453
Net Present Value $95,94,827
Profitability Index 1.349
Capital Budgeting Analysis for Wodonga Site:
Years
Figure 2: (Capital Budgeting of Wodonga Site option)
Source: (Created by Author)
The above figure shows that capital budgeting technique application shows the best
option available to Saturn pet care for starting the production process is Wodonga site which is
clearly shown following all the methods of capital budgeting such as NPV analysis profitability
index and payback period analysis (Fauzi, Basyith & Idris, 2013). The NPV method shows that
the future cash flow which the business can expect from the production site of Wodonga Site is
more than the Bathurst site. The NPV of the Bathurst site is shown in the above figure as $
58,44,567 which is less than the NPV which is calculated for Wodonga site which is $
95,94,827. The profitability index shows that for Bathurst site the index is 1.117 which is less
than profitability index of Wodonga site which is 1.349. The payback period analysis also shows
that Wodonga site is much better option than Bathurst site it allows the business to recover the
5
ACCOUNTING AND FINANCE
initial investment amount for the production in less time period. Thus, from above analysis it is
clear that the most profitable site for production is Wodonga site.
Product Cannibalization
The term product cannibalization refers to a strategy which is often followed in business
where in order to introduce and promote a new product in market, the business reduces the sales
of another product (Lin & Kremer, 2014). In the case of Saturn Pet care, it may be very well be
possible that the business is using such a technique in order to promote the new product which
the management plans to introduce.
Rectifying the Excessive Sales Recorded
As per the question, Nathan who is one of the director of the business is of the view that
the marketing department has estimated the sales in excess and therefore the same needs to be
rectified so that it does not impact the panning process of the management. The estimation error
can be rectified by following NPV method in which the cash outflow estimates can be increased
slightly so as to neutralize the estimation error caused previously (Kumar, Sharma & Tewari,
2015).
Inclusion of Original Cost of Old Factory Shed
Nathan also is of the opinion that the original cost of the factory site should be included
in initial investment so as to bring about a correct estimate. The judgement of Nathan is incorrect
as NPV analysis only takes into consideration the newly developed factory site which has been
developed for the production site option.
⊘ This is a preview!⊘
Do you want full access?
Subscribe today to unlock all pages.
Trusted by 1+ million students worldwide
6
ACCOUNTING AND FINANCE
Part B
Introduction
This part will be dealing with the analysis of the capital structure of ARB Ltd which is
engaged in manufacturing business and the effectiveness or weaknesses of the capital structure is
to be identified. In coming paragraphs, detailed analysis of capital structure and it changes over
the years have been conducted.
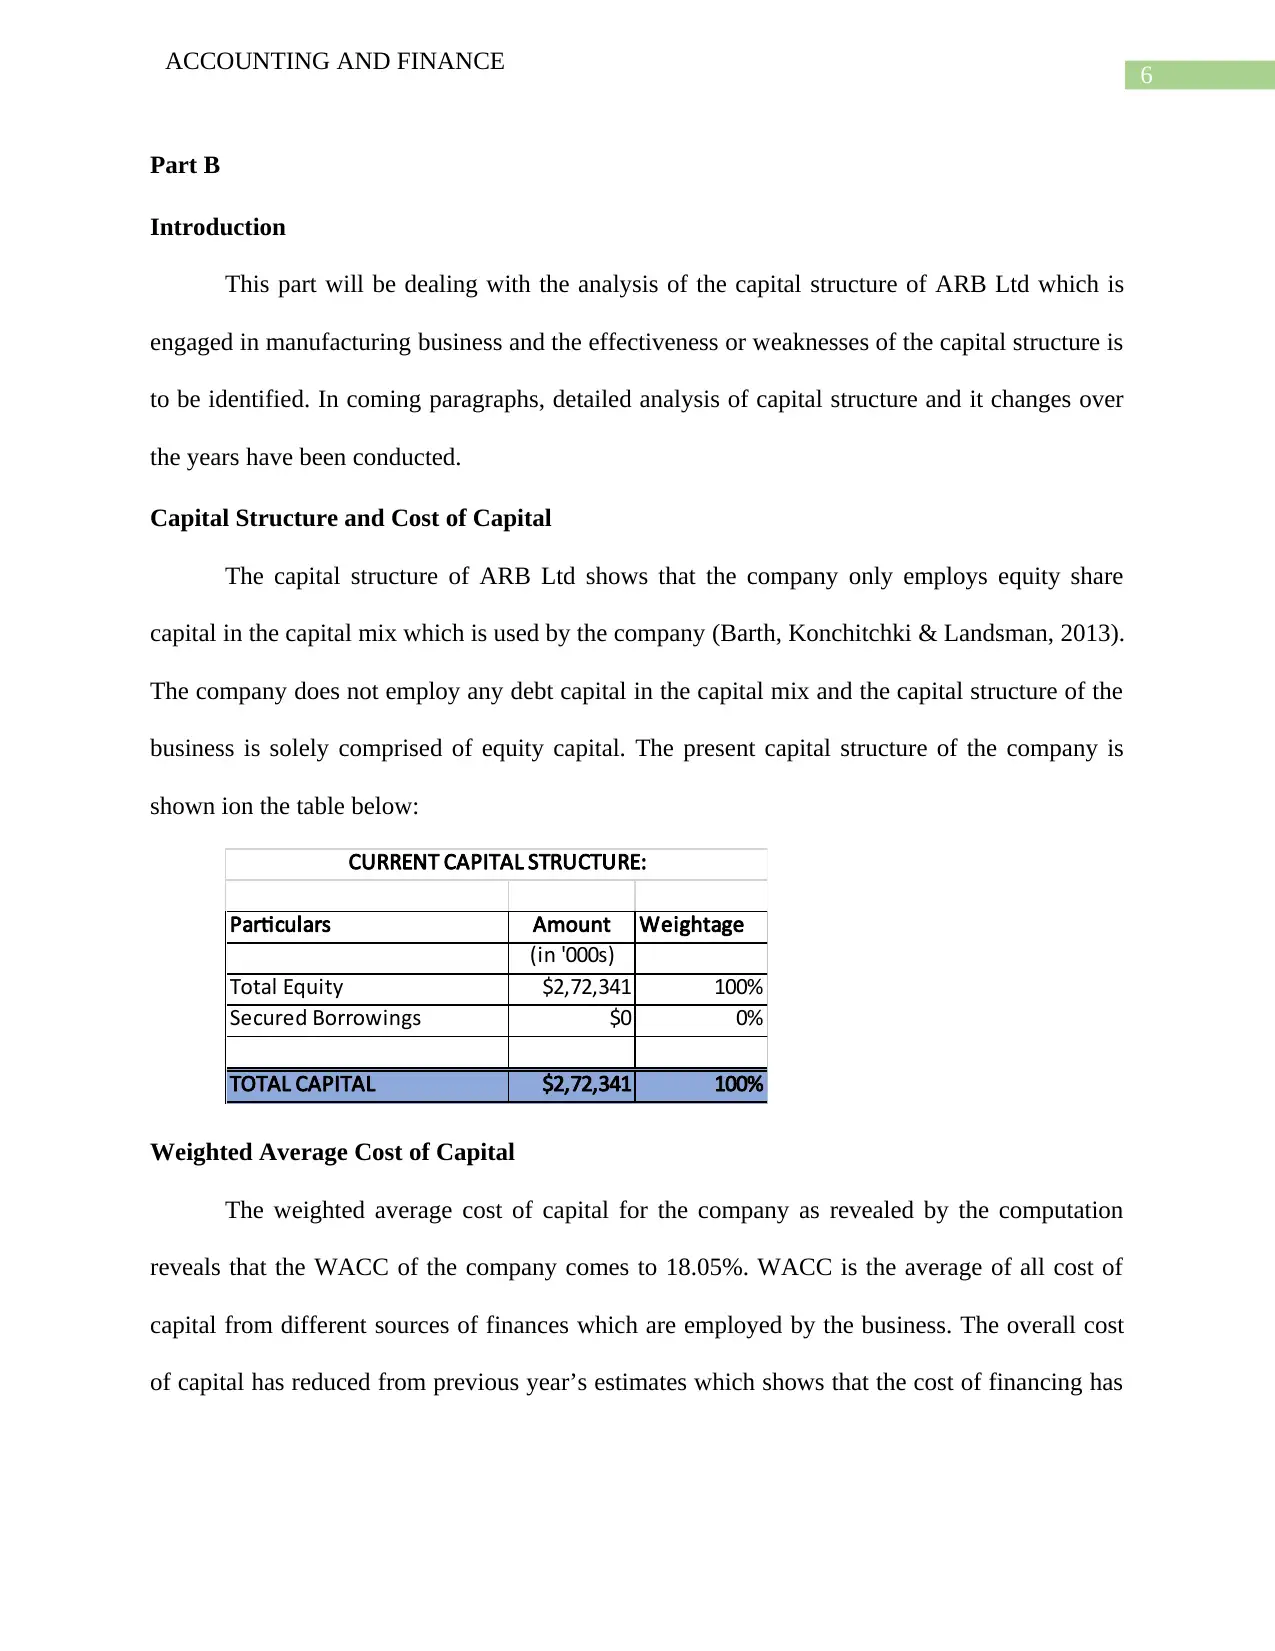
Capital Structure and Cost of Capital
The capital structure of ARB Ltd shows that the company only employs equity share
capital in the capital mix which is used by the company (Barth, Konchitchki & Landsman, 2013).
The company does not employ any debt capital in the capital mix and the capital structure of the
business is solely comprised of equity capital. The present capital structure of the company is
shown ion the table below:
Particulars Amount Weightage
(in '000s)
Total Equity $2,72,341 100%
Secured Borrowings $0 0%
TOTAL CAPITAL $2,72,341 100%
CURRENT CAPITAL STRUCTURE:
Weighted Average Cost of Capital
The weighted average cost of capital for the company as revealed by the computation
reveals that the WACC of the company comes to 18.05%. WACC is the average of all cost of
capital from different sources of finances which are employed by the business. The overall cost
of capital has reduced from previous year’s estimates which shows that the cost of financing has
ACCOUNTING AND FINANCE
Part B
Introduction
This part will be dealing with the analysis of the capital structure of ARB Ltd which is
engaged in manufacturing business and the effectiveness or weaknesses of the capital structure is
to be identified. In coming paragraphs, detailed analysis of capital structure and it changes over
the years have been conducted.
Capital Structure and Cost of Capital
The capital structure of ARB Ltd shows that the company only employs equity share
capital in the capital mix which is used by the company (Barth, Konchitchki & Landsman, 2013).
The company does not employ any debt capital in the capital mix and the capital structure of the
business is solely comprised of equity capital. The present capital structure of the company is
shown ion the table below:
Particulars Amount Weightage
(in '000s)
Total Equity $2,72,341 100%
Secured Borrowings $0 0%
TOTAL CAPITAL $2,72,341 100%
CURRENT CAPITAL STRUCTURE:
Weighted Average Cost of Capital
The weighted average cost of capital for the company as revealed by the computation
reveals that the WACC of the company comes to 18.05%. WACC is the average of all cost of
capital from different sources of finances which are employed by the business. The overall cost
of capital has reduced from previous year’s estimates which shows that the cost of financing has
Paraphrase This Document
Need a fresh take? Get an instant paraphrase of this document with our AI Paraphraser
7
ACCOUNTING AND FINANCE
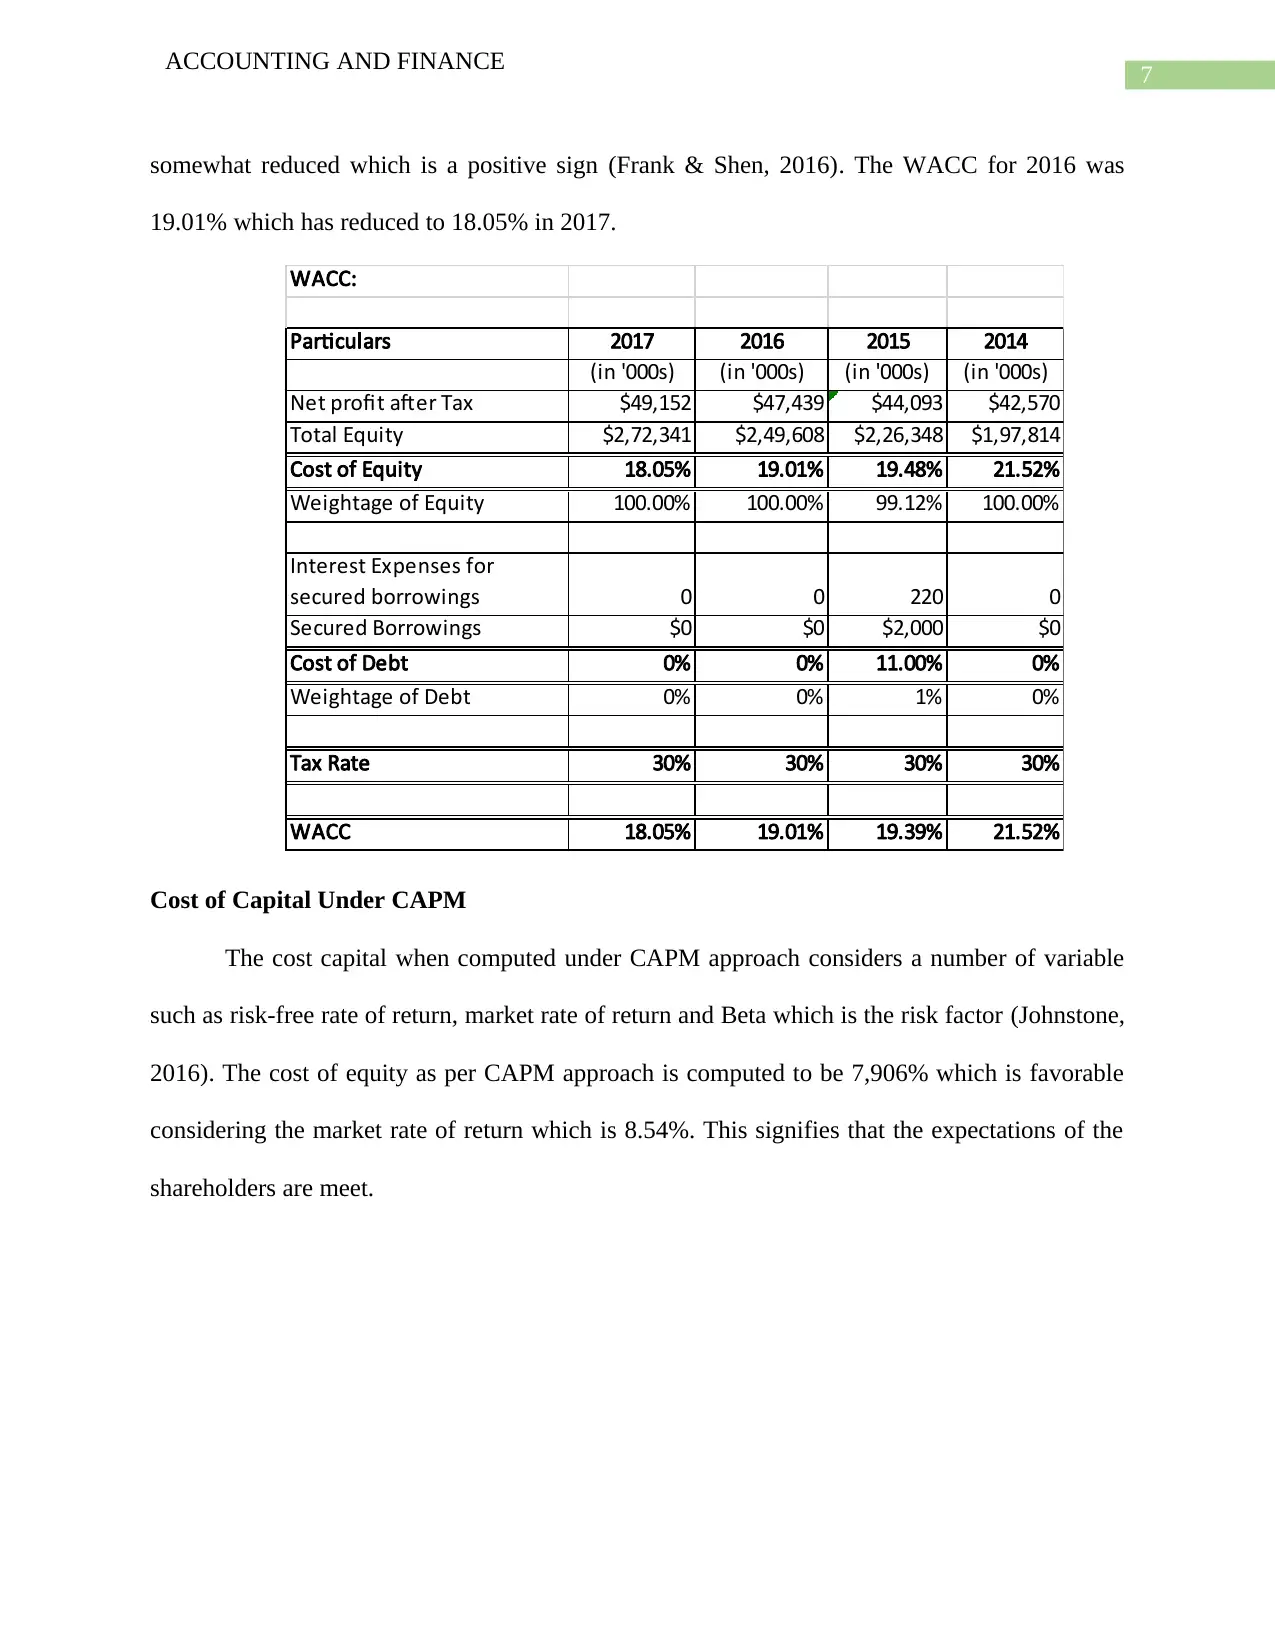
somewhat reduced which is a positive sign (Frank & Shen, 2016). The WACC for 2016 was
19.01% which has reduced to 18.05% in 2017.
WACC:
Particulars 2017 2016 2015 2014
(in '000s) (in '000s) (in '000s) (in '000s)
Net profit after Tax $49,152 $47,439 $44,093 $42,570
Total Equity $2,72,341 $2,49,608 $2,26,348 $1,97,814
Cost of Equity 18.05% 19.01% 19.48% 21.52%
Weightage of Equity 100.00% 100.00% 99.12% 100.00%
Interest Expenses for
secured borrowings 0 0 220 0
Secured Borrowings $0 $0 $2,000 $0
Cost of Debt 0% 0% 11.00% 0%
Weightage of Debt 0% 0% 1% 0%
Tax Rate 30% 30% 30% 30%
WACC 18.05% 19.01% 19.39% 21.52%
Cost of Capital Under CAPM
The cost capital when computed under CAPM approach considers a number of variable
such as risk-free rate of return, market rate of return and Beta which is the risk factor (Johnstone,
2016). The cost of equity as per CAPM approach is computed to be 7,906% which is favorable
considering the market rate of return which is 8.54%. This signifies that the expectations of the
shareholders are meet.
ACCOUNTING AND FINANCE
somewhat reduced which is a positive sign (Frank & Shen, 2016). The WACC for 2016 was
19.01% which has reduced to 18.05% in 2017.
WACC:
Particulars 2017 2016 2015 2014
(in '000s) (in '000s) (in '000s) (in '000s)
Net profit after Tax $49,152 $47,439 $44,093 $42,570
Total Equity $2,72,341 $2,49,608 $2,26,348 $1,97,814
Cost of Equity 18.05% 19.01% 19.48% 21.52%
Weightage of Equity 100.00% 100.00% 99.12% 100.00%
Interest Expenses for
secured borrowings 0 0 220 0
Secured Borrowings $0 $0 $2,000 $0
Cost of Debt 0% 0% 11.00% 0%
Weightage of Debt 0% 0% 1% 0%
Tax Rate 30% 30% 30% 30%
WACC 18.05% 19.01% 19.39% 21.52%
Cost of Capital Under CAPM
The cost capital when computed under CAPM approach considers a number of variable
such as risk-free rate of return, market rate of return and Beta which is the risk factor (Johnstone,
2016). The cost of equity as per CAPM approach is computed to be 7,906% which is favorable
considering the market rate of return which is 8.54%. This signifies that the expectations of the
shareholders are meet.
8
ACCOUNTING AND FINANCE
Cost of Equity under CAPM:
Particulars Amount
Beta 0.89
Market Return 8.54%
Risk Free Rate 2.78%
Expected Cost of Equity 7.906%
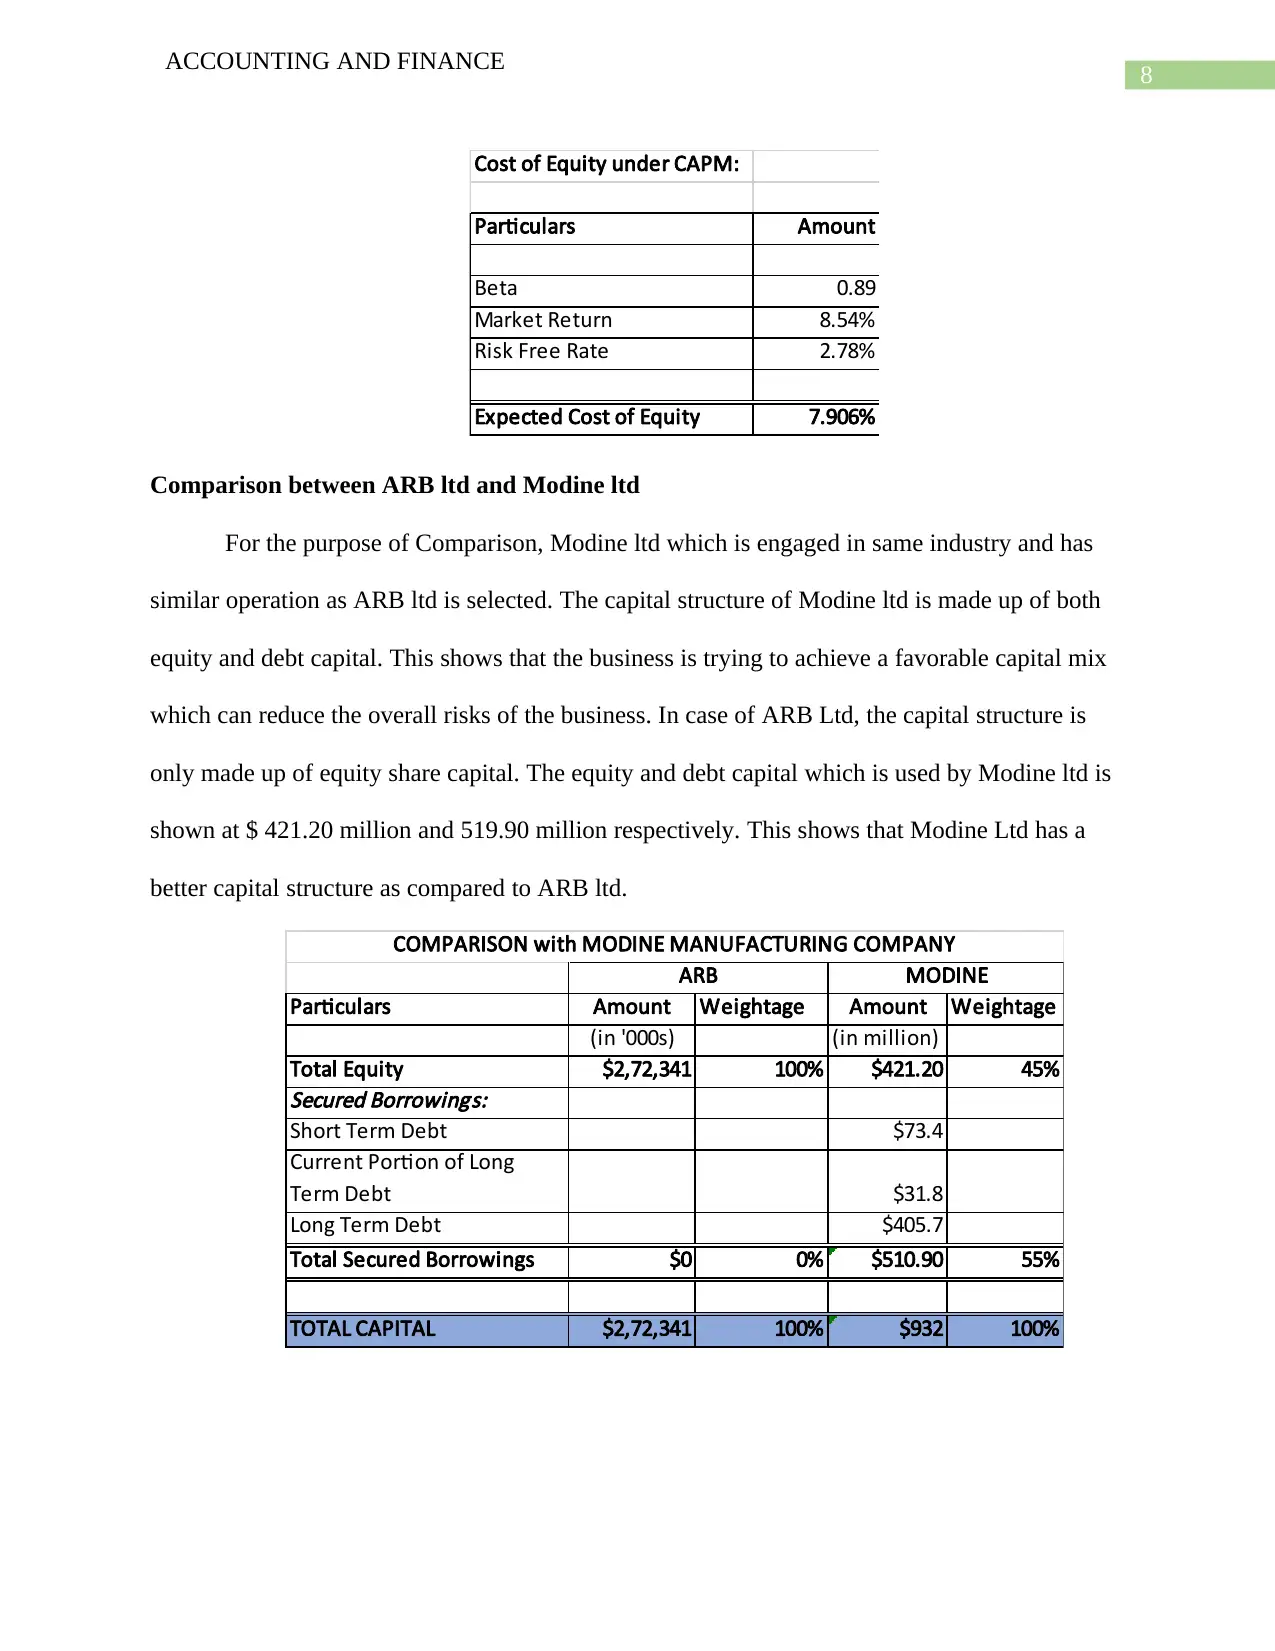
Comparison between ARB ltd and Modine ltd
For the purpose of Comparison, Modine ltd which is engaged in same industry and has
similar operation as ARB ltd is selected. The capital structure of Modine ltd is made up of both
equity and debt capital. This shows that the business is trying to achieve a favorable capital mix
which can reduce the overall risks of the business. In case of ARB Ltd, the capital structure is
only made up of equity share capital. The equity and debt capital which is used by Modine ltd is
shown at $ 421.20 million and 519.90 million respectively. This shows that Modine Ltd has a
better capital structure as compared to ARB ltd.
Particulars Amount Weightage Amount Weightage
(in '000s) (in million)
Total Equity $2,72,341 100% $421.20 45%
Secured Borrowings:
Short Term Debt $73.4
Current Portion of Long
Term Debt $31.8
Long Term Debt $405.7
Total Secured Borrowings $0 0% $510.90 55%
TOTAL CAPITAL $2,72,341 100% $932 100%
ARB MODINE
COMPARISON with MODINE MANUFACTURING COMPANY
ACCOUNTING AND FINANCE
Cost of Equity under CAPM:
Particulars Amount
Beta 0.89
Market Return 8.54%
Risk Free Rate 2.78%
Expected Cost of Equity 7.906%
Comparison between ARB ltd and Modine ltd
For the purpose of Comparison, Modine ltd which is engaged in same industry and has
similar operation as ARB ltd is selected. The capital structure of Modine ltd is made up of both
equity and debt capital. This shows that the business is trying to achieve a favorable capital mix
which can reduce the overall risks of the business. In case of ARB Ltd, the capital structure is
only made up of equity share capital. The equity and debt capital which is used by Modine ltd is
shown at $ 421.20 million and 519.90 million respectively. This shows that Modine Ltd has a
better capital structure as compared to ARB ltd.
Particulars Amount Weightage Amount Weightage
(in '000s) (in million)
Total Equity $2,72,341 100% $421.20 45%
Secured Borrowings:
Short Term Debt $73.4
Current Portion of Long
Term Debt $31.8
Long Term Debt $405.7
Total Secured Borrowings $0 0% $510.90 55%
TOTAL CAPITAL $2,72,341 100% $932 100%
ARB MODINE
COMPARISON with MODINE MANUFACTURING COMPANY
⊘ This is a preview!⊘
Do you want full access?
Subscribe today to unlock all pages.
Trusted by 1+ million students worldwide
9
ACCOUNTING AND FINANCE
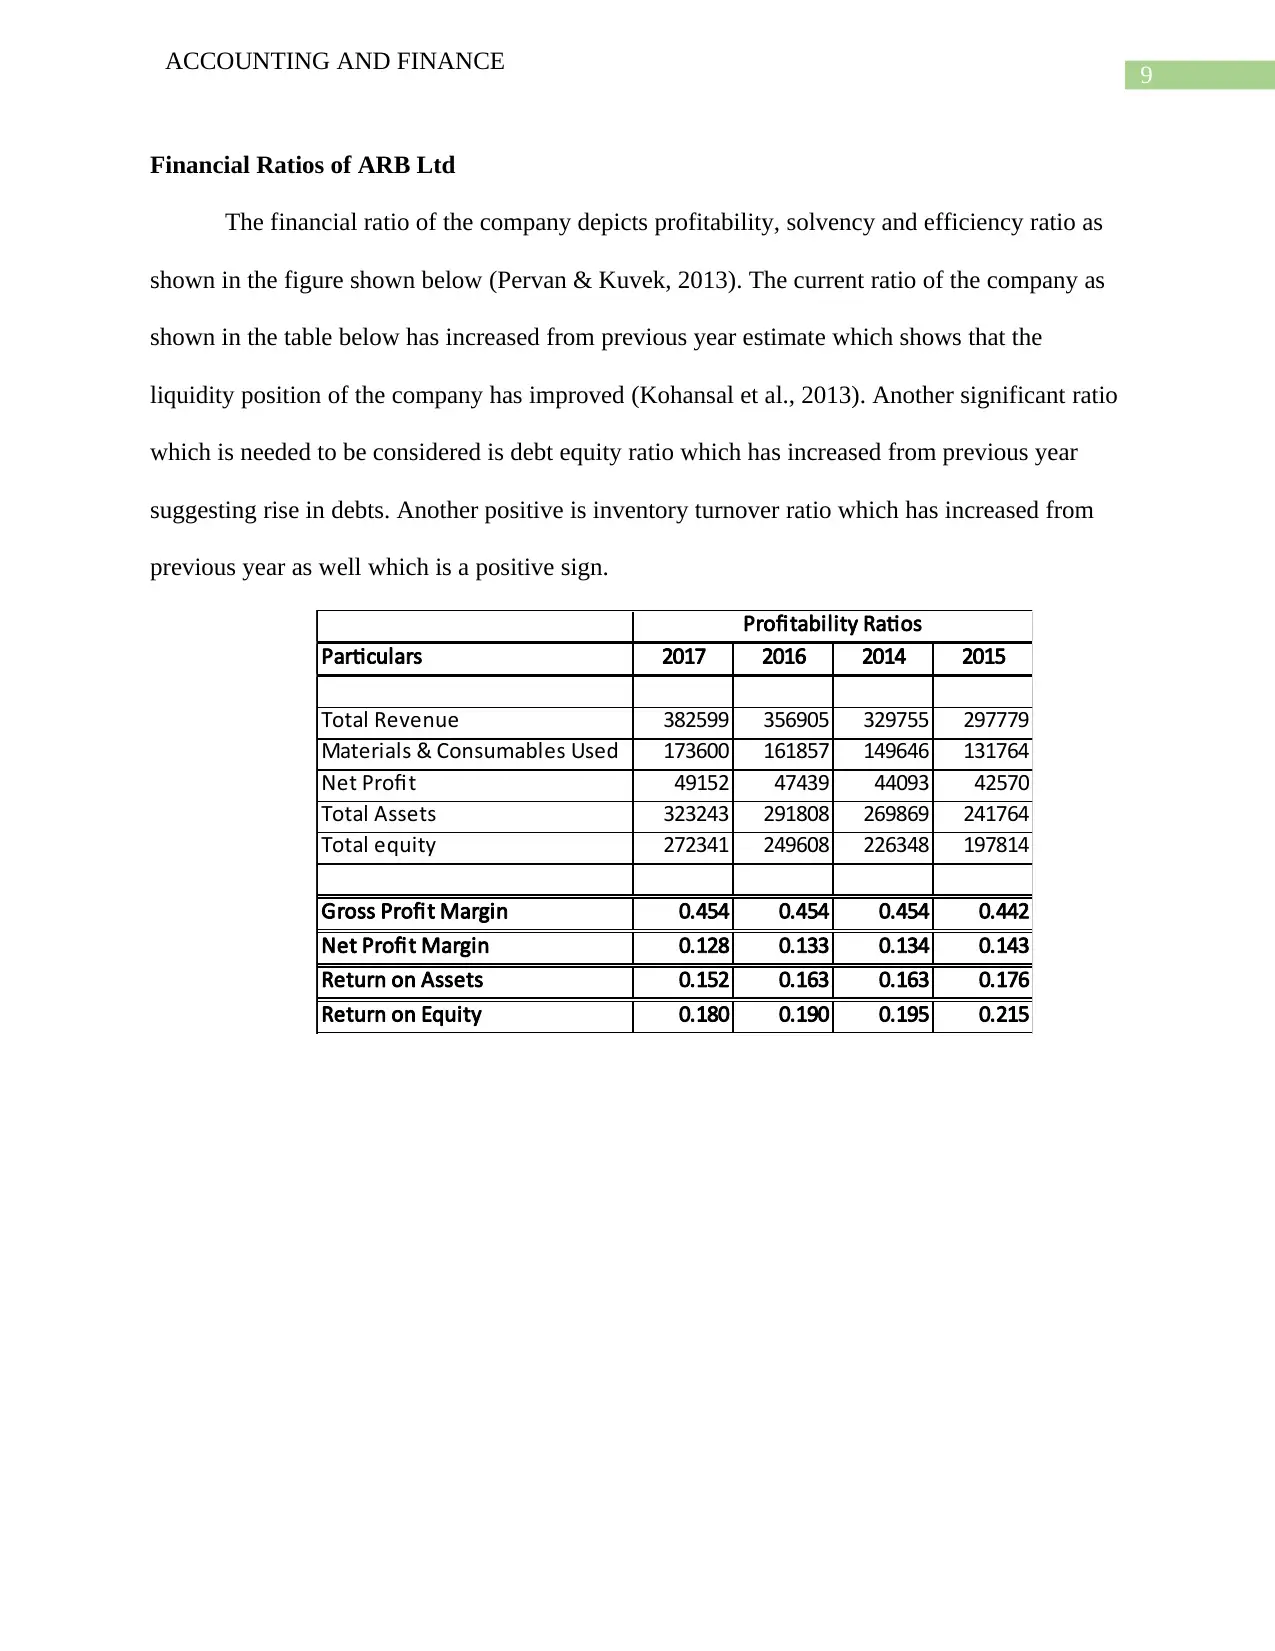
Financial Ratios of ARB Ltd
The financial ratio of the company depicts profitability, solvency and efficiency ratio as
shown in the figure shown below (Pervan & Kuvek, 2013). The current ratio of the company as
shown in the table below has increased from previous year estimate which shows that the
liquidity position of the company has improved (Kohansal et al., 2013). Another significant ratio
which is needed to be considered is debt equity ratio which has increased from previous year
suggesting rise in debts. Another positive is inventory turnover ratio which has increased from
previous year as well which is a positive sign.
Particulars 2017 2016 2014 2015
Total Revenue 382599 356905 329755 297779
Materials & Consumables Used 173600 161857 149646 131764
Net Profit 49152 47439 44093 42570
Total Assets 323243 291808 269869 241764
Total equity 272341 249608 226348 197814
Gross Profit Margin 0.454 0.454 0.454 0.442
Net Profit Margin 0.128 0.133 0.134 0.143
Return on Assets 0.152 0.163 0.163 0.176
Return on Equity 0.180 0.190 0.195 0.215
Profitability Ratios
ACCOUNTING AND FINANCE
Financial Ratios of ARB Ltd
The financial ratio of the company depicts profitability, solvency and efficiency ratio as
shown in the figure shown below (Pervan & Kuvek, 2013). The current ratio of the company as
shown in the table below has increased from previous year estimate which shows that the
liquidity position of the company has improved (Kohansal et al., 2013). Another significant ratio
which is needed to be considered is debt equity ratio which has increased from previous year
suggesting rise in debts. Another positive is inventory turnover ratio which has increased from
previous year as well which is a positive sign.
Particulars 2017 2016 2014 2015
Total Revenue 382599 356905 329755 297779
Materials & Consumables Used 173600 161857 149646 131764
Net Profit 49152 47439 44093 42570
Total Assets 323243 291808 269869 241764
Total equity 272341 249608 226348 197814
Gross Profit Margin 0.454 0.454 0.454 0.442
Net Profit Margin 0.128 0.133 0.134 0.143
Return on Assets 0.152 0.163 0.163 0.176
Return on Equity 0.180 0.190 0.195 0.215
Profitability Ratios
Paraphrase This Document
Need a fresh take? Get an instant paraphrase of this document with our AI Paraphraser
10
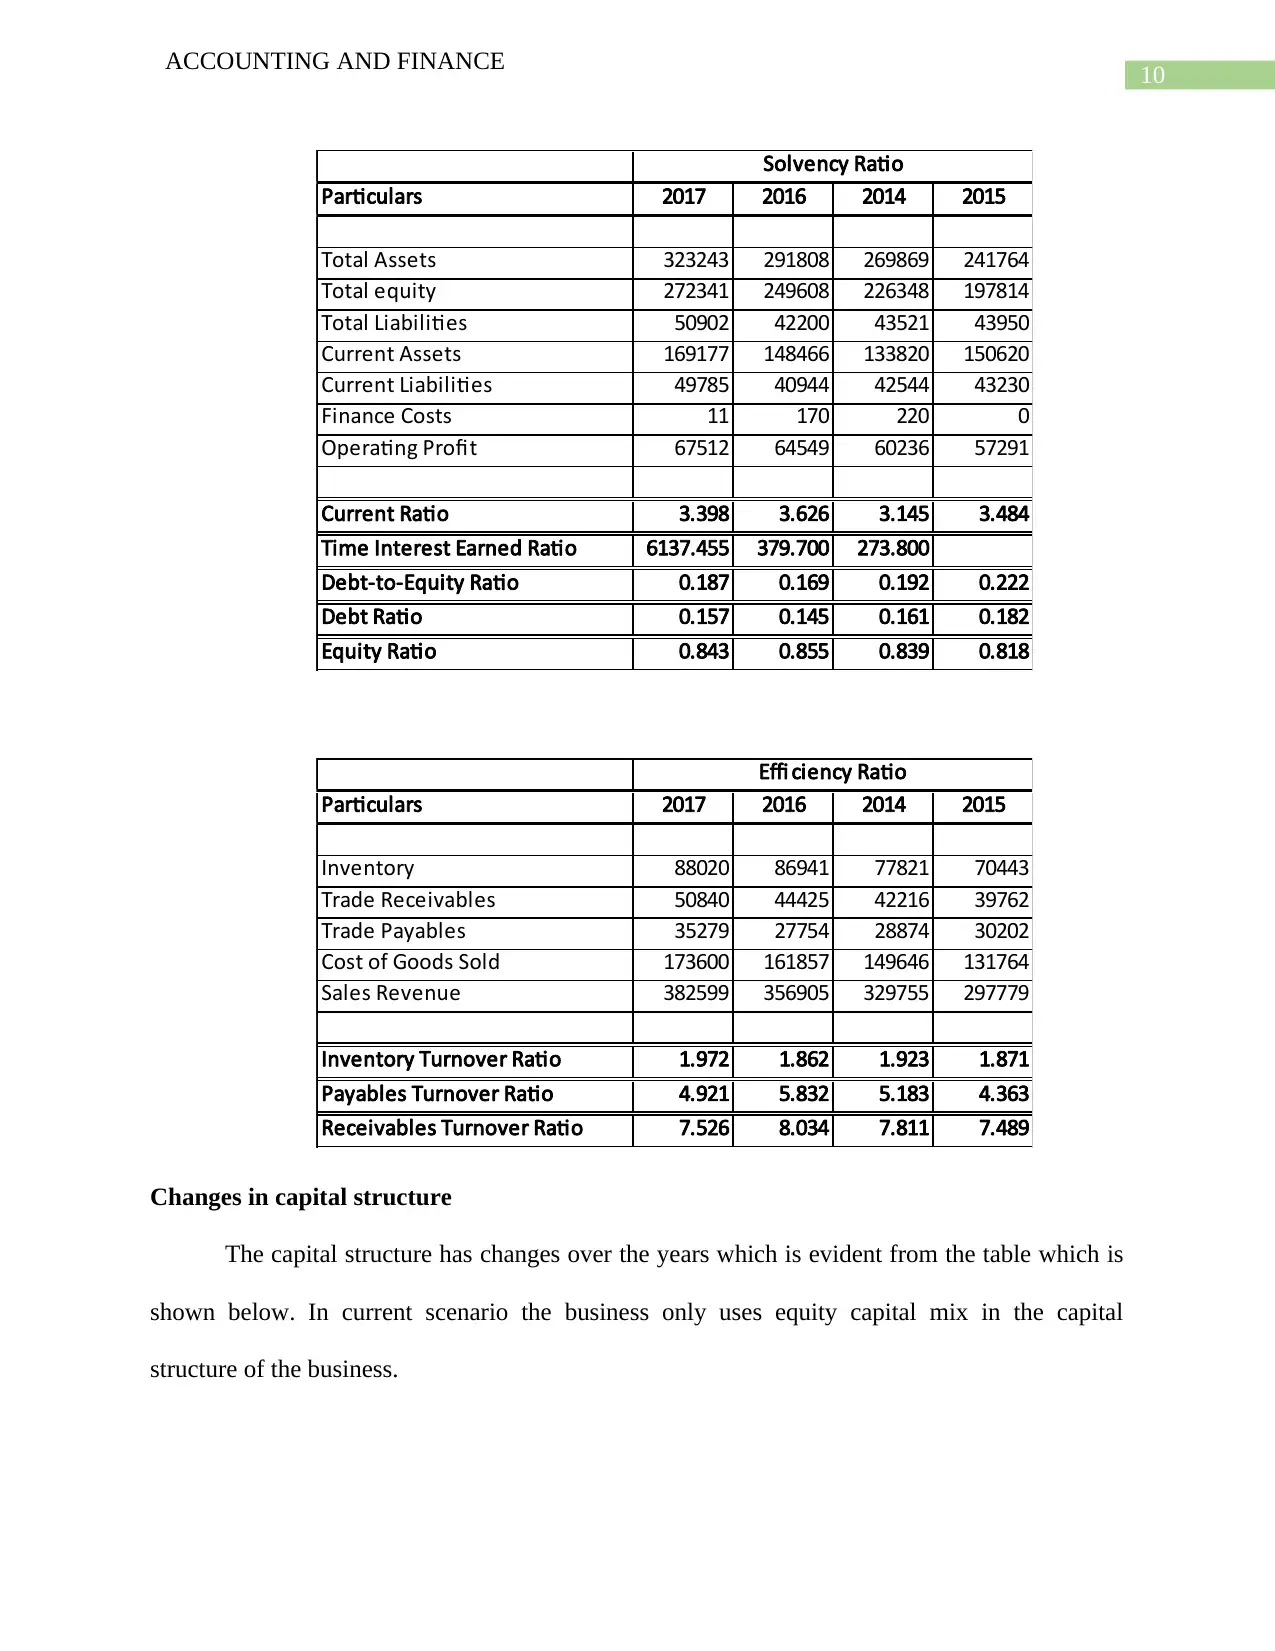
ACCOUNTING AND FINANCE
Particulars 2017 2016 2014 2015
Total Assets 323243 291808 269869 241764
Total equity 272341 249608 226348 197814
Total Liabilities 50902 42200 43521 43950
Current Assets 169177 148466 133820 150620
Current Liabilities 49785 40944 42544 43230
Finance Costs 11 170 220 0
Operating Profit 67512 64549 60236 57291
Current Ratio 3.398 3.626 3.145 3.484
Time Interest Earned Ratio 6137.455 379.700 273.800
Debt-to-Equity Ratio 0.187 0.169 0.192 0.222
Debt Ratio 0.157 0.145 0.161 0.182
Equity Ratio 0.843 0.855 0.839 0.818
Solvency Ratio
Particulars 2017 2016 2014 2015
Inventory 88020 86941 77821 70443
Trade Receivables 50840 44425 42216 39762
Trade Payables 35279 27754 28874 30202
Cost of Goods Sold 173600 161857 149646 131764
Sales Revenue 382599 356905 329755 297779
Inventory Turnover Ratio 1.972 1.862 1.923 1.871
Payables Turnover Ratio 4.921 5.832 5.183 4.363
Receivables Turnover Ratio 7.526 8.034 7.811 7.489
Effi ciency Ratio
Changes in capital structure
The capital structure has changes over the years which is evident from the table which is
shown below. In current scenario the business only uses equity capital mix in the capital
structure of the business.
11
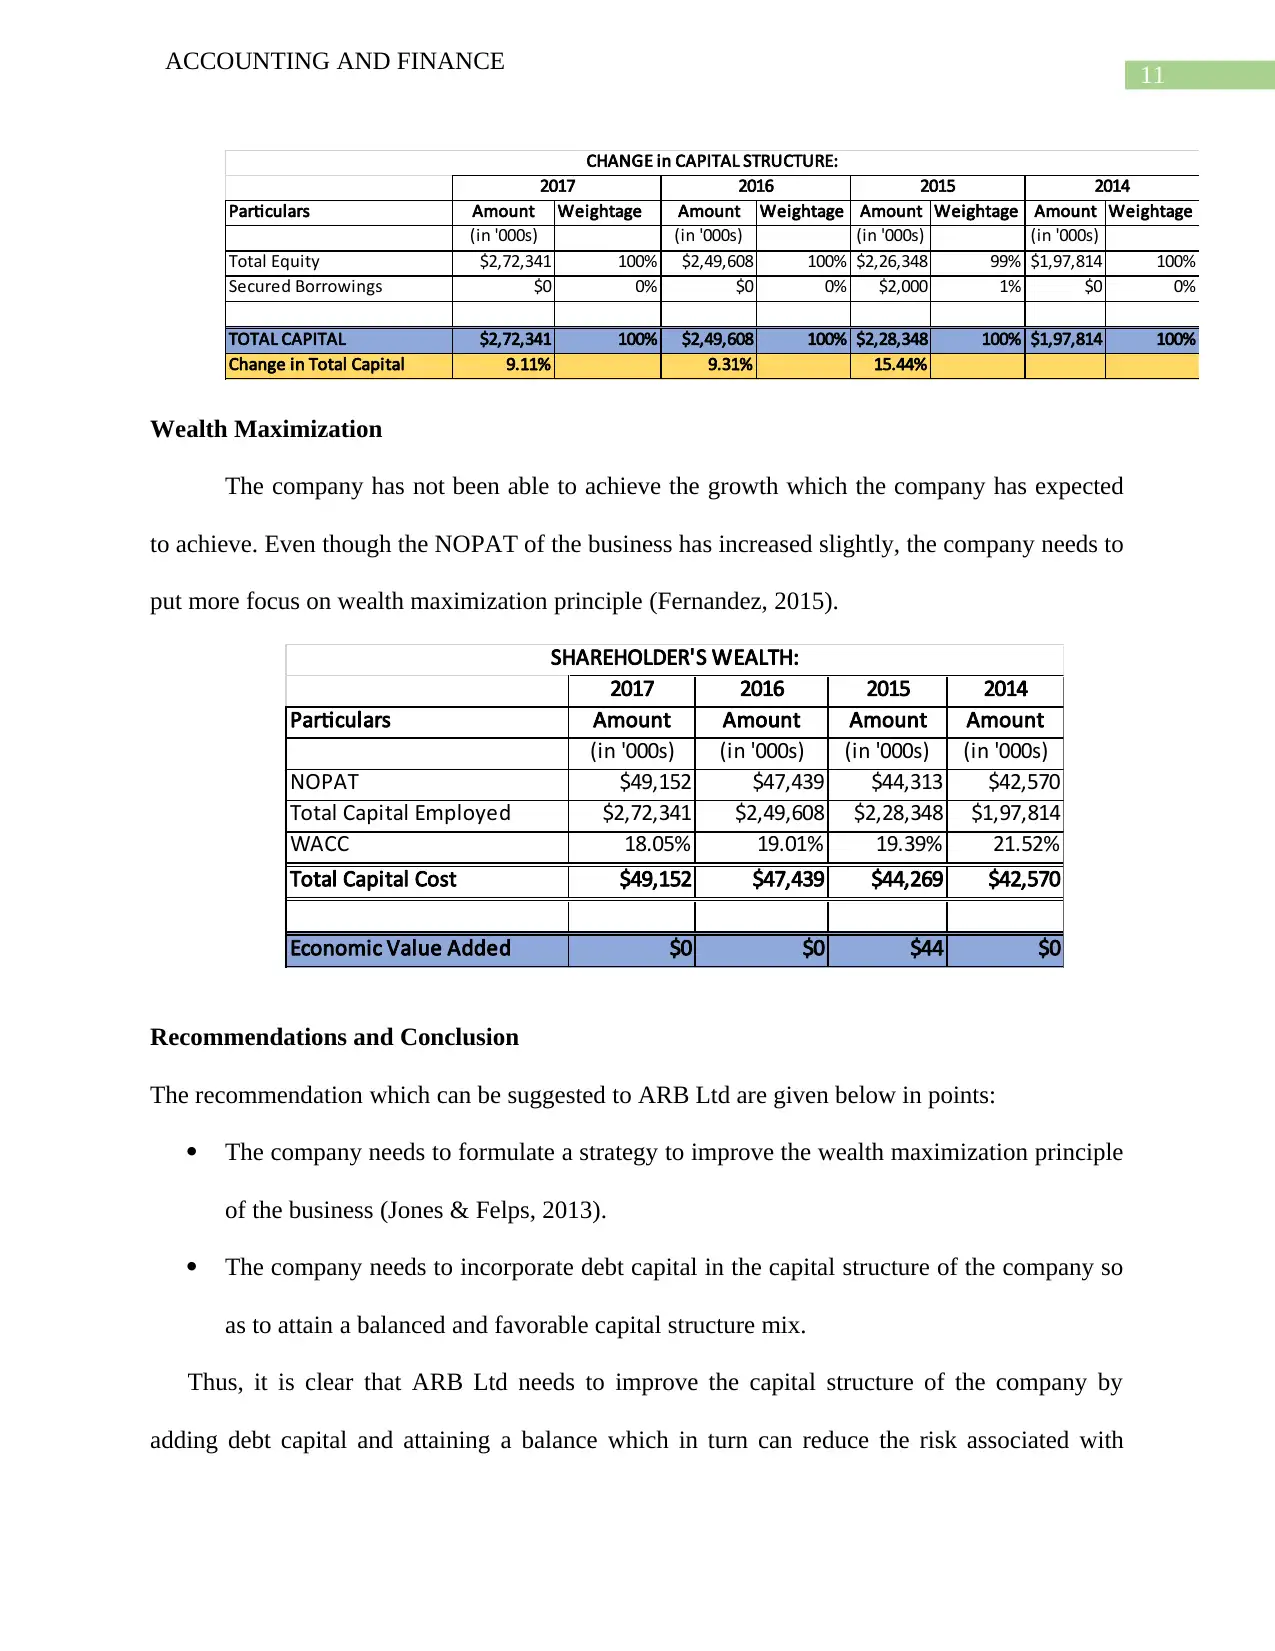
ACCOUNTING AND FINANCE
Particulars Amount Weightage Amount Weightage Amount Weightage Amount Weightage
(in '000s) (in '000s) (in '000s) (in '000s)
Total Equity $2,72,341 100% $2,49,608 100% $2,26,348 99% $1,97,814 100%
Secured Borrowings $0 0% $0 0% $2,000 1% $0 0%
TOTAL CAPITAL $2,72,341 100% $2,49,608 100% $2,28,348 100% $1,97,814 100%
Change in Total Capital 9.11% 9.31% 15.44%
2015 2014
CHANGE in CAPITAL STRUCTURE:
2017 2016
Wealth Maximization
The company has not been able to achieve the growth which the company has expected
to achieve. Even though the NOPAT of the business has increased slightly, the company needs to
put more focus on wealth maximization principle (Fernandez, 2015).
2017 2016 2015 2014
Particulars Amount Amount Amount Amount
(in '000s) (in '000s) (in '000s) (in '000s)
NOPAT $49,152 $47,439 $44,313 $42,570
Total Capital Employed $2,72,341 $2,49,608 $2,28,348 $1,97,814
WACC 18.05% 19.01% 19.39% 21.52%
Total Capital Cost $49,152 $47,439 $44,269 $42,570
Economic Value Added $0 $0 $44 $0
SHAREHOLDER'S WEALTH:
Recommendations and Conclusion
The recommendation which can be suggested to ARB Ltd are given below in points:
The company needs to formulate a strategy to improve the wealth maximization principle
of the business (Jones & Felps, 2013).
The company needs to incorporate debt capital in the capital structure of the company so
as to attain a balanced and favorable capital structure mix.
Thus, it is clear that ARB Ltd needs to improve the capital structure of the company by
adding debt capital and attaining a balance which in turn can reduce the risk associated with
⊘ This is a preview!⊘
Do you want full access?
Subscribe today to unlock all pages.
Trusted by 1+ million students worldwide
1 out of 14
Related Documents


Your All-in-One AI-Powered Toolkit for Academic Success.
+13062052269
info@desklib.com
Available 24*7 on WhatsApp / Email
![[object Object]](/_next/static/media/star-bottom.7253800d.svg)
Unlock your academic potential
Copyright © 2020–2026 A2Z Services. All Rights Reserved. Developed and managed by ZUCOL.