Finance Assignment: Case Study Analysis and Solutions

Verified

Added on  2021/04/17

|8
|906
|56
Homework Assignment
AI Summary
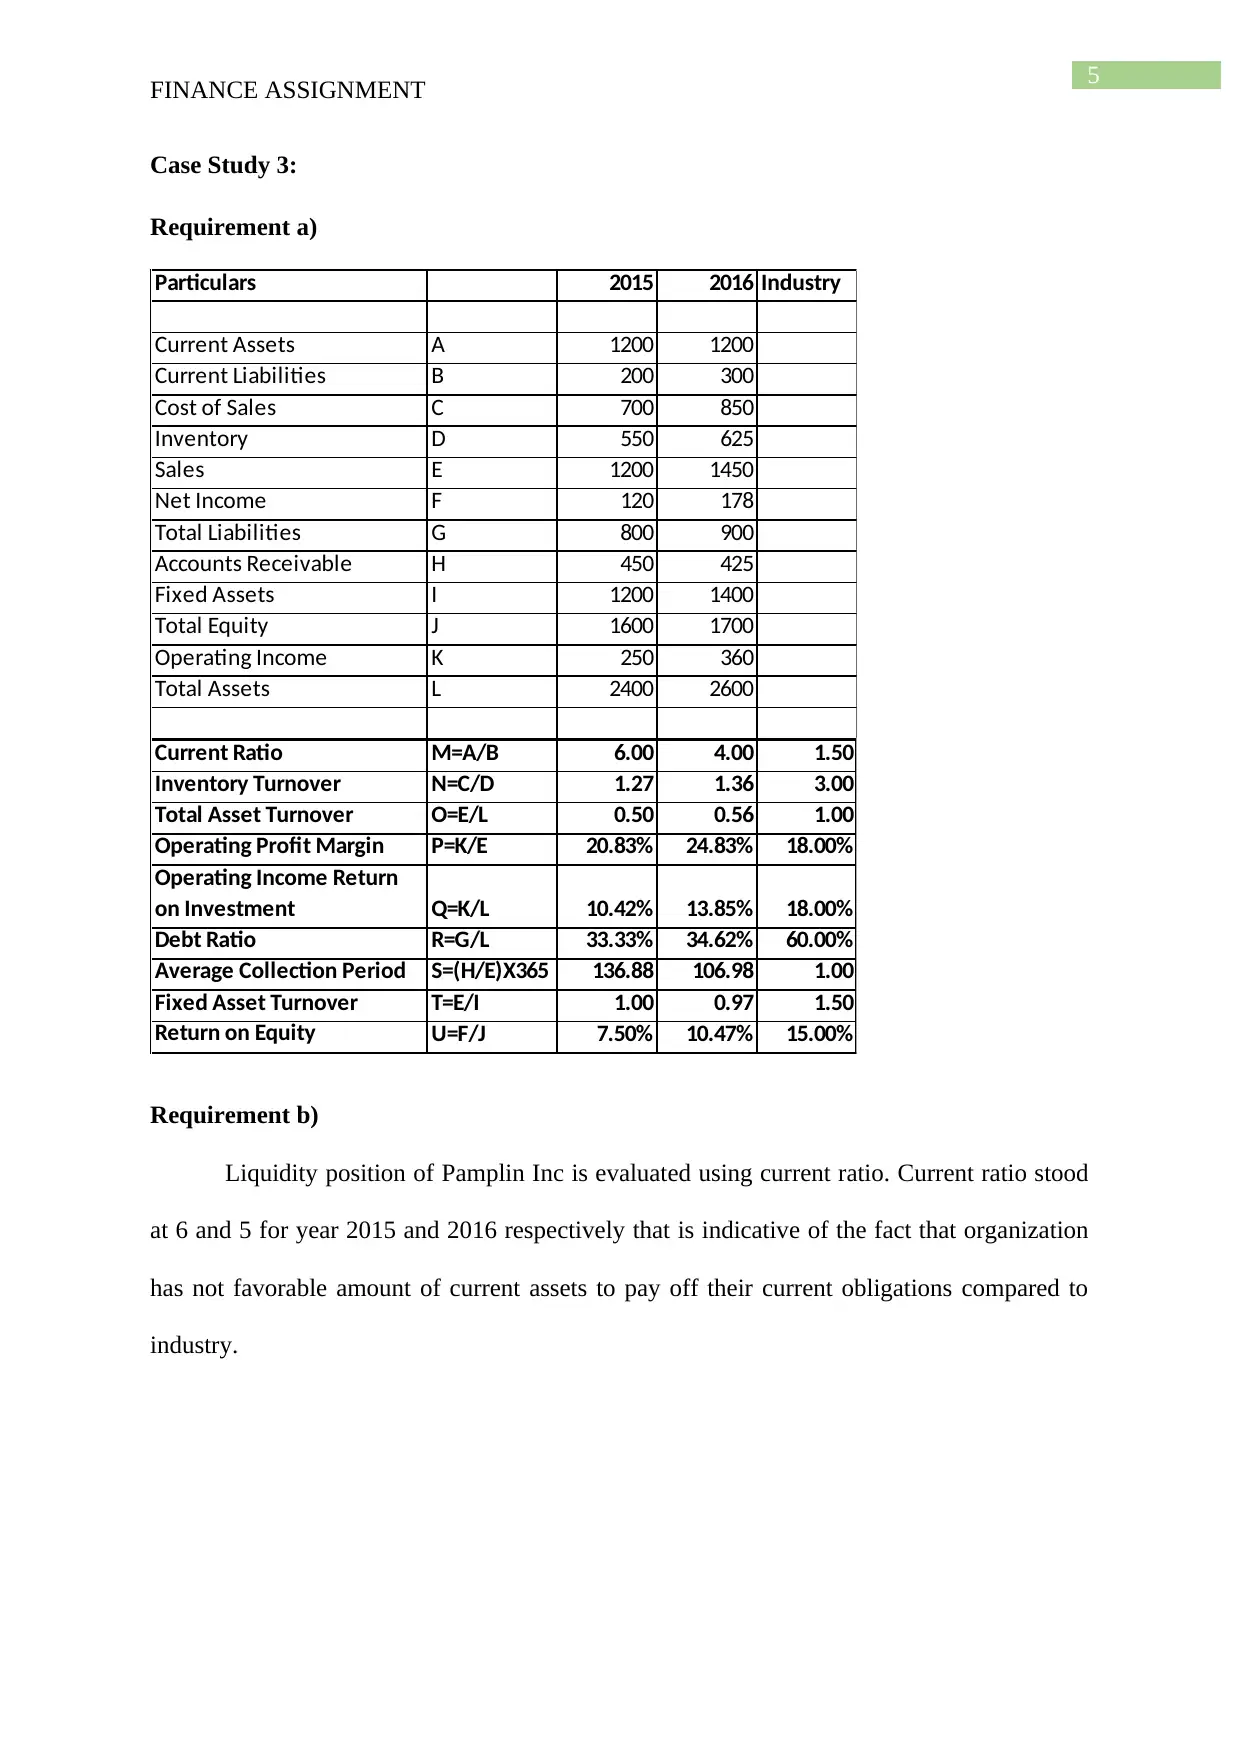
This finance assignment presents a series of case studies designed to assess and enhance understanding of core financial concepts. The assignment delves into inventory management, examining the reorder point system, the influence of container loads, and the implications of holding inventory during inflationary periods. It then explores capital budgeting techniques, evaluating independent projects using net present value, payback period, and accounting rate of return, while also addressing scaling issues and discretionary financing needs. The assignment concludes with an analysis of financial ratios, including current ratio, operating return on investment, debt ratio, and return on equity, to evaluate a company's liquidity, profitability, asset financing, and returns to shareholders. The assignment utilizes real-world scenarios and provides detailed solutions, referencing relevant financial literature to support the analysis and conclusions.
Document Page
Running head: FINANCE ASSIGNMENT
Finance assignment
Name of the Student
Name of the University
Author Note
tabler-icon-diamond-filled.svg

Paraphrase This Document

Need a fresh take? Get an instant paraphrase of this document with our AI Paraphraser
Document Page
1
FINANCE ASSIGNMENT
Table of Contents
Case study 1:..............................................................................................................................2
Answer to question 1:.............................................................................................................2
Requirement a)...................................................................................................................2
Requirement b)...................................................................................................................2
Requirement c)...................................................................................................................2
Answer to question 2:.............................................................................................................3
Case study 2:..............................................................................................................................3
Answer to question 1:.............................................................................................................3
Answer to question 2:.............................................................................................................4
Case Study 3:..............................................................................................................................5
Requirement a).......................................................................................................................5
Requirement b).......................................................................................................................5
Requirement c).......................................................................................................................6
Requirement d).......................................................................................................................6
Requirement e).......................................................................................................................6
References list:...........................................................................................................................7
Document Page
2
FINANCE ASSIGNMENT
Case study 1:
Answer to question 1:
Requirement a)
Flame electrical relies on using re order point system that is stocks are re ordered
when they fall below a certain point. Various factors that forms the basis of red ordering
point involves the order lead time, basis of predicted demand, lead time variability, cost of
transportations and the physical size of lamps (Titman et al. 2017).
Requirement b)
The influence of container load is the main reason attributable to departure from
conventional economic order quantity theory.
Requirement c)
i. Average Inventory:
Particulars Amount
Annual Demand A 20000
Safety Stock B 5000
Average Inventory C=(A+B)/2 12500
ii. EOQ Computation:
Particulars Amount
Annual Demand A 20000
Cost of Placing Order B $25.00
Per Unit Cost of Carrying InventoryC $8.00
EOQ D=√[2xAx(B/C)] 354
Document Page
3
FINANCE ASSIGNMENT
Answer to question 2:
Firms might be inclined to hold large amount of inventories during inflationary
situation as they anticipate increase in price. However, holding large inventories during such
circumstances is not sensible. It is so because of possibility of fall in price, increase in cost of
stockholding like wastage, capital blockage and possibility that there will be new supply
sources at competitive rate (Brooks 2015).
Case study 2:
Answer to question 1:
The Durango cereal company uses techniques of capital budgeting for evaluating the
independent projects. It can be seen that both the projects that is poofy puffs and filling fiber
generates positive net present value. Therefore, company can accept both the projects.
However, it can be seen that payback period of poofy puffs project is higher than that of
filling fiber project. In addition to this, it can be seen that accounting rate of return of both the
project is higher than the minimum required rate of return (Scott 2015). Therefore, Durango
Cereal Company can accept both the project.
POOFY PUFFS:
Particulars 0 1 2 3 4
Cash Flow -$2,48,90,000.00 $1,29,50,000.00 $1,09,23,000.00 $82,31,000.00 $72,42,000.00
Discount Rate 10% 10% 10% 10% 10%
Cumulative Cash Flow -$2,48,90,000.00 -$1,19,40,000.00 -$10,17,000.00 $72,14,000.00 $1,44,56,000.00
Discounted Cash Flow -$2,48,90,000.00 $1,17,72,727.27 $90,27,272.73 $61,84,072.13 $49,46,383.44
Payback Period (in yrs.) 2.12
Net Present Value $70,40,455.57
Accounting Rate of Return 39.52%
Period
tabler-icon-diamond-filled.svg

Paraphrase This Document

Need a fresh take? Get an instant paraphrase of this document with our AI Paraphraser
Document Page
4
FINANCE ASSIGNMENT
FILLING FIBER:
Particulars 0 1 2 3 4
Cash Flow -$1,35,00,000.00 $72,30,000.00 $81,00,000.00 $86,29,000.00 $52,38,900.00
Discount Rate 10% 10% 10% 10% 10%
Cumulative Cash Flow -$1,35,00,000.00 -$62,70,000.00 $18,30,000.00 $1,04,59,000.00 $1,56,97,900.00
Discounted Cash Flow -$1,35,00,000.00 $65,72,727.27 $66,94,214.88 $64,83,095.42 $35,78,239.19
Payback Period (in yrs.) 1.79
Net Present Value $98,28,276.76
Accounting Rate of Return 54.07%
Period
When considering the scaling issue, it can be seen that it would be feasible for
Durango Cereal Company to accept the project of filling fiber. This is so because it can be
seen that payback period of filling fiber project is less than poofy puffs project. Moreover, net
present value of filling fiber project is more than poofy puffs project along with higher
accounting rate of return. Therefore, considering scaling issues, it would be appropriate to
accept filling fiber project.
Answer to question 2:
Discretionary financing needed is the difference between total liabilities, owner’s
equity and total assets. Borrowing money and issuing of common stocks are the two forms of
discrete financing. The formula used for computation of discretionary funding needed is
difference between projected change in assets and projected change in liabilities and change
in retained earnings of company.
If the value of projected change is assets is more than that of projected change in
retained Earnings and projected change in liabilities, then discretionary financing needed
would be surplus. On other hand, if value of projected change in assets is less than that of
projected change in retained earnings and liabilities, then there is deficit of discretionary
funds.
Document Page
5
FINANCE ASSIGNMENT
Case Study 3:
Requirement a)
Particulars 2015 2016 Industry
Current Assets A 1200 1200
Current Liabilities B 200 300
Cost of Sales C 700 850
Inventory D 550 625
Sales E 1200 1450
Net Income F 120 178
Total Liabilities G 800 900
Accounts Receivable H 450 425
Fixed Assets I 1200 1400
Total Equity J 1600 1700
Operating Income K 250 360
Total Assets L 2400 2600
Current Ratio M=A/B 6.00 4.00 1.50
Inventory Turnover N=C/D 1.27 1.36 3.00
Total Asset Turnover O=E/L 0.50 0.56 1.00
Operating Profit Margin P=K/E 20.83% 24.83% 18.00%
Operating Income Return
on Investment Q=K/L 10.42% 13.85% 18.00%
Debt Ratio R=G/L 33.33% 34.62% 60.00%
Average Collection Period S=(H/E)X365 136.88 106.98 1.00
Fixed Asset Turnover T=E/I 1.00 0.97 1.50
Return on Equity U=F/J 7.50% 10.47% 15.00%
Requirement b)
Liquidity position of Pamplin Inc is evaluated using current ratio. Current ratio stood
at 6 and 5 for year 2015 and 2016 respectively that is indicative of the fact that organization
has not favorable amount of current assets to pay off their current obligations compared to
industry.
Document Page
6
FINANCE ASSIGNMENT
Requirement c)
It can be seen that operating return on investment at 10.42% and 13.45% in year 2015
and 2016 as against industry standard of 18%. Therefore, management of organization is not
generating adequate profit on assets.
Requirement d)
Assets financing is explained by debt ratio that stood at 33.33% in year 2015 and
34.62% in year 2016 respectively. However, industry standard is 60%. Therefore, debt ratio
of company is favorable.
Requirement e)
Return to shareholder is explained by return on equity ratio that stood at 7.5% and
10.47 in year 2015 and 2016 respectively. However, industry standard is 15% indicating that
common stockholders of company are not receiving good returns on investment compared to
industry standard.
tabler-icon-diamond-filled.svg

Paraphrase This Document

Need a fresh take? Get an instant paraphrase of this document with our AI Paraphraser
Document Page
7
FINANCE ASSIGNMENT
References list:
Barr, M.J. and McClellan, G.S., 2018. Budgets and financial management in higher
education. John Wiley & Sons.
Brooks, R., 2015. Financial management: core concepts. Pearson.
Scott, W.R., 2015. Financial accounting theory (Vol. 2, No. 0, p. 0). Prentice Hall.
Titman, S., Keown, A.J. and Martin, J.D., 2017. Financial management: Principles and
applications. Pearson.
chevron_up_icon
1 out of 8
circle_padding
hide_on_mobile
zoom_out_icon
[object Object]