Accounting and Finance Report: Capital Budgeting & Company Analysis
VerifiedAdded on 2020/03/28
|15
|1926
|34
Report
AI Summary
This finance report delves into capital budgeting techniques, including payback period, net present value, and internal rate of return, analyzing best, worst, and base case scenarios. It then focuses on a detailed analysis of APN Outdoor Group, an advertising company, examining its capital structure, weighted average cost of capital (WACC), and key financial ratios. The report compares APN with a competitor, oOh!media Limited, and assesses their financial performance, profitability, and solvency. It also discusses the importance of minimizing the cost of capital and its impact on shareholder wealth maximization, offering insights into the company's growth trajectory and investment potential. The report concludes with a summary of the findings and references supporting the analysis.

Paraphrase This Document
Need a fresh take? Get an instant paraphrase of this document with our AI Paraphraser
1
By student name
Professor
University
Date: 16 September 2017.
1 | P a g e
By student name
Professor
University
Date: 16 September 2017.
1 | P a g e
2
Contents
Question No.1…………..……………………..........……………………………..……………………...3
Question No.2…………..……………………..........……………………………..……………………...8
Introduction and Executive Summary…......………………………………………...7
Report and other analysis.………………..........………………………………………...7
Conclusion…..…………………………………..........……………………………..………...13
Refrences.....……………………………………………………………….....................................14
2 | P a g e
⊘ This is a preview!⊘
Do you want full access?
Subscribe today to unlock all pages.
Trusted by 1+ million students worldwide
3
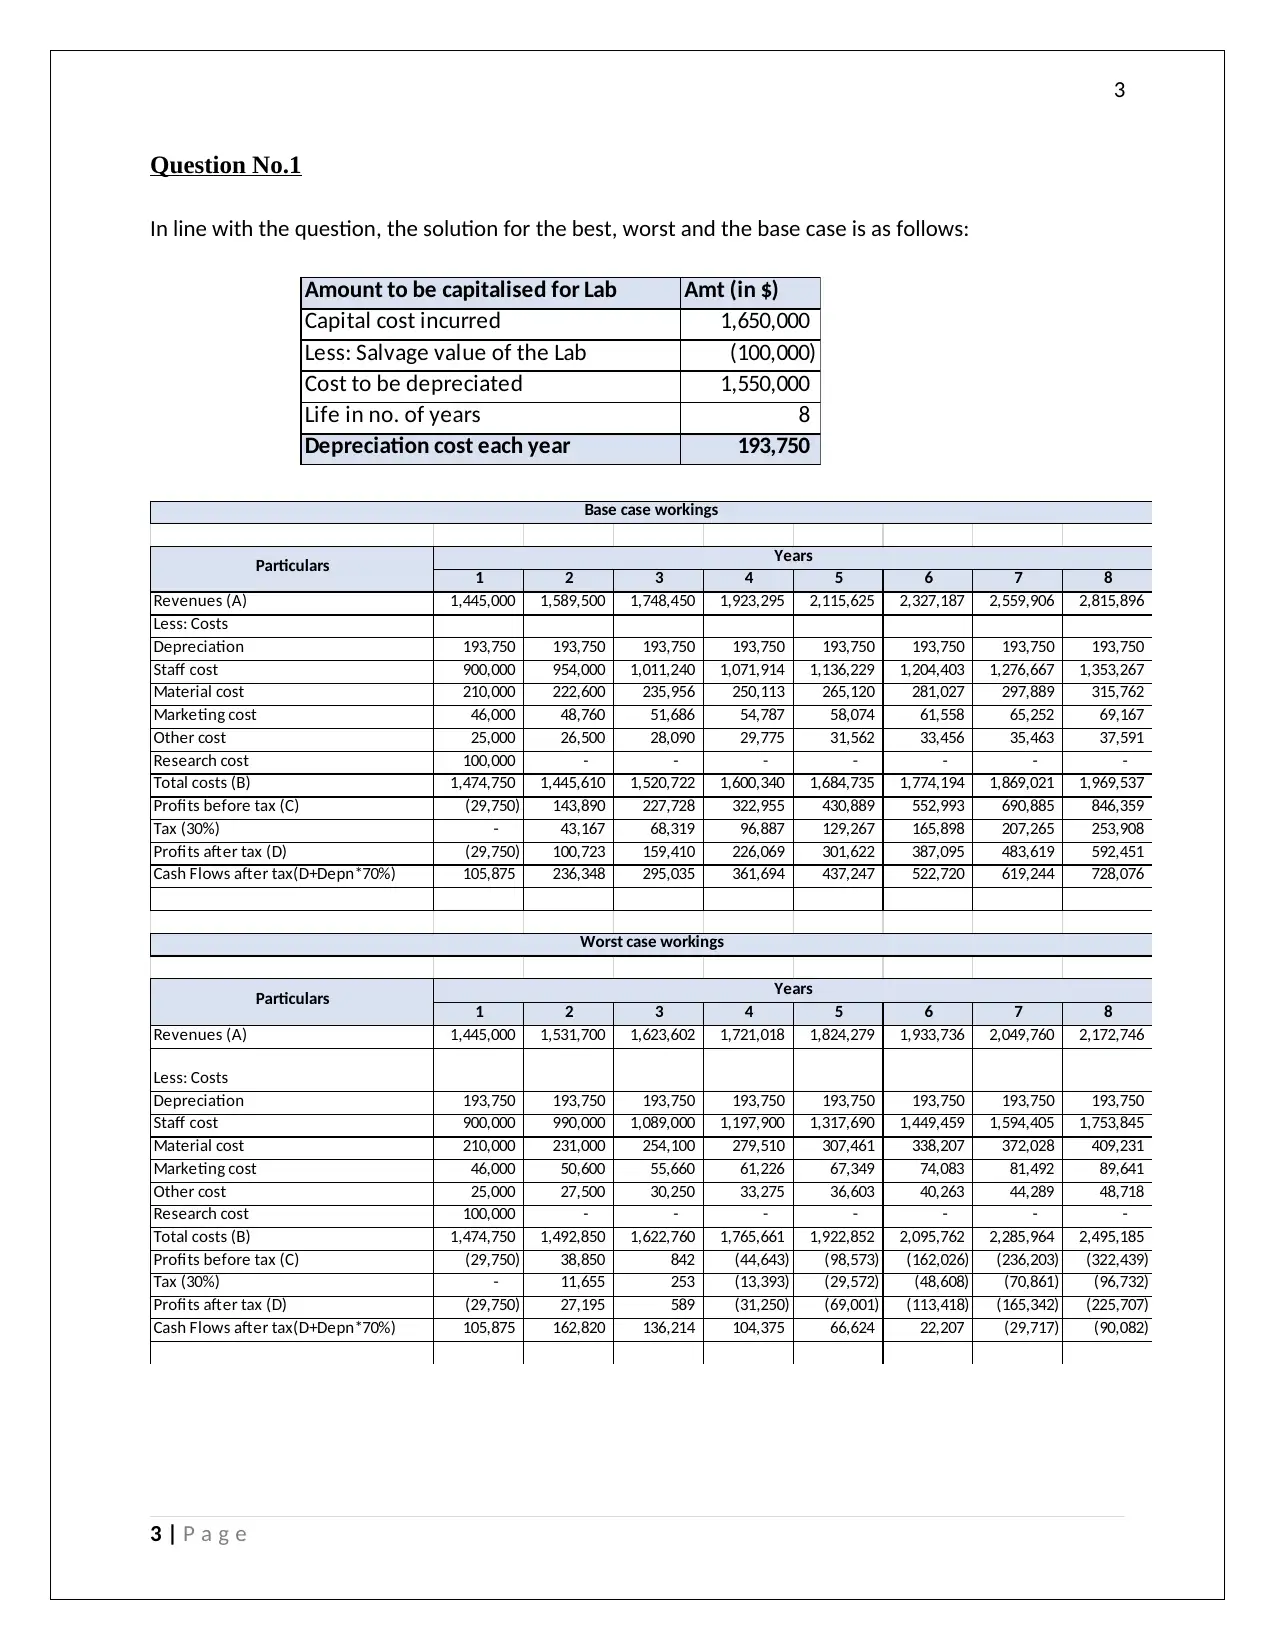
Question No.1
In line with the question, the solution for the best, worst and the base case is as follows:
Amount to be capitalised for Lab Amt (in $)
Capital cost incurred 1,650,000
Less: Salvage value of the Lab (100,000)
Cost to be depreciated 1,550,000
Life in no. of years 8
Depreciation cost each year 193,750
1 2 3 4 5 6 7 8
Revenues (A) 1,445,000 1,589,500 1,748,450 1,923,295 2,115,625 2,327,187 2,559,906 2,815,896
Less: Costs
Depreciation 193,750 193,750 193,750 193,750 193,750 193,750 193,750 193,750
Staff cost 900,000 954,000 1,011,240 1,071,914 1,136,229 1,204,403 1,276,667 1,353,267
Material cost 210,000 222,600 235,956 250,113 265,120 281,027 297,889 315,762
Marketing cost 46,000 48,760 51,686 54,787 58,074 61,558 65,252 69,167
Other cost 25,000 26,500 28,090 29,775 31,562 33,456 35,463 37,591
Research cost 100,000 - - - - - - -
Total costs (B) 1,474,750 1,445,610 1,520,722 1,600,340 1,684,735 1,774,194 1,869,021 1,969,537
Profits before tax (C) (29,750) 143,890 227,728 322,955 430,889 552,993 690,885 846,359
Tax (30%) - 43,167 68,319 96,887 129,267 165,898 207,265 253,908
Profits after tax (D) (29,750) 100,723 159,410 226,069 301,622 387,095 483,619 592,451
Cash Flows after tax(D+Depn*70%) 105,875 236,348 295,035 361,694 437,247 522,720 619,244 728,076
1 2 3 4 5 6 7 8
Revenues (A) 1,445,000 1,531,700 1,623,602 1,721,018 1,824,279 1,933,736 2,049,760 2,172,746
Less: Costs
Depreciation 193,750 193,750 193,750 193,750 193,750 193,750 193,750 193,750
Staff cost 900,000 990,000 1,089,000 1,197,900 1,317,690 1,449,459 1,594,405 1,753,845
Material cost 210,000 231,000 254,100 279,510 307,461 338,207 372,028 409,231
Marketing cost 46,000 50,600 55,660 61,226 67,349 74,083 81,492 89,641
Other cost 25,000 27,500 30,250 33,275 36,603 40,263 44,289 48,718
Research cost 100,000 - - - - - - -
Total costs (B) 1,474,750 1,492,850 1,622,760 1,765,661 1,922,852 2,095,762 2,285,964 2,495,185
Profits before tax (C) (29,750) 38,850 842 (44,643) (98,573) (162,026) (236,203) (322,439)
Tax (30%) - 11,655 253 (13,393) (29,572) (48,608) (70,861) (96,732)
Profits after tax (D) (29,750) 27,195 589 (31,250) (69,001) (113,418) (165,342) (225,707)
Cash Flows after tax(D+Depn*70%) 105,875 162,820 136,214 104,375 66,624 22,207 (29,717) (90,082)
Particulars Years
Base case workings
Worst case workings
Particulars Years
3 | P a g e
Paraphrase This Document
Need a fresh take? Get an instant paraphrase of this document with our AI Paraphraser
4
1 2 3 4 5 6 7 8
Revenues (A) 1,445,000 1,661,750 1,911,013 2,197,664 2,527,314 2,906,411 3,342,373 3,843,729
Less: Costs
Depreciation 193,750 193,750 193,750 193,750 193,750 193,750 193,750 193,750
Staff cost 900,000 927,000 954,810 983,454 1,012,958 1,043,347 1,074,647 1,106,886
Material cost 210,000 216,300 222,789 229,473 236,357 243,448 250,751 258,274
Marketing cost 46,000 47,380 48,801 50,265 51,773 53,327 54,926 56,574
Other cost 25,000 25,750 26,523 27,318 28,138 28,982 29,851 30,747
Research cost 100,000 - - - - - - -
Total costs (B) 1,474,750 1,410,180 1,446,673 1,484,261 1,522,976 1,562,853 1,603,926 1,646,231
Profits before tax (C) (29,750) 251,570 464,340 713,404 1,004,338 1,343,558 1,738,447 2,197,498
Tax (30%) - 75,471 139,302 214,021 301,301 403,068 521,534 659,249
Profits after tax (D) (29,750) 176,099 325,038 499,383 703,037 940,491 1,216,913 1,538,248
Cash Flows after tax(D+Depn*70%) 105,875 311,724 460,663 635,008 838,662 1,076,116 1,352,538 1,673,873
Particulars Years
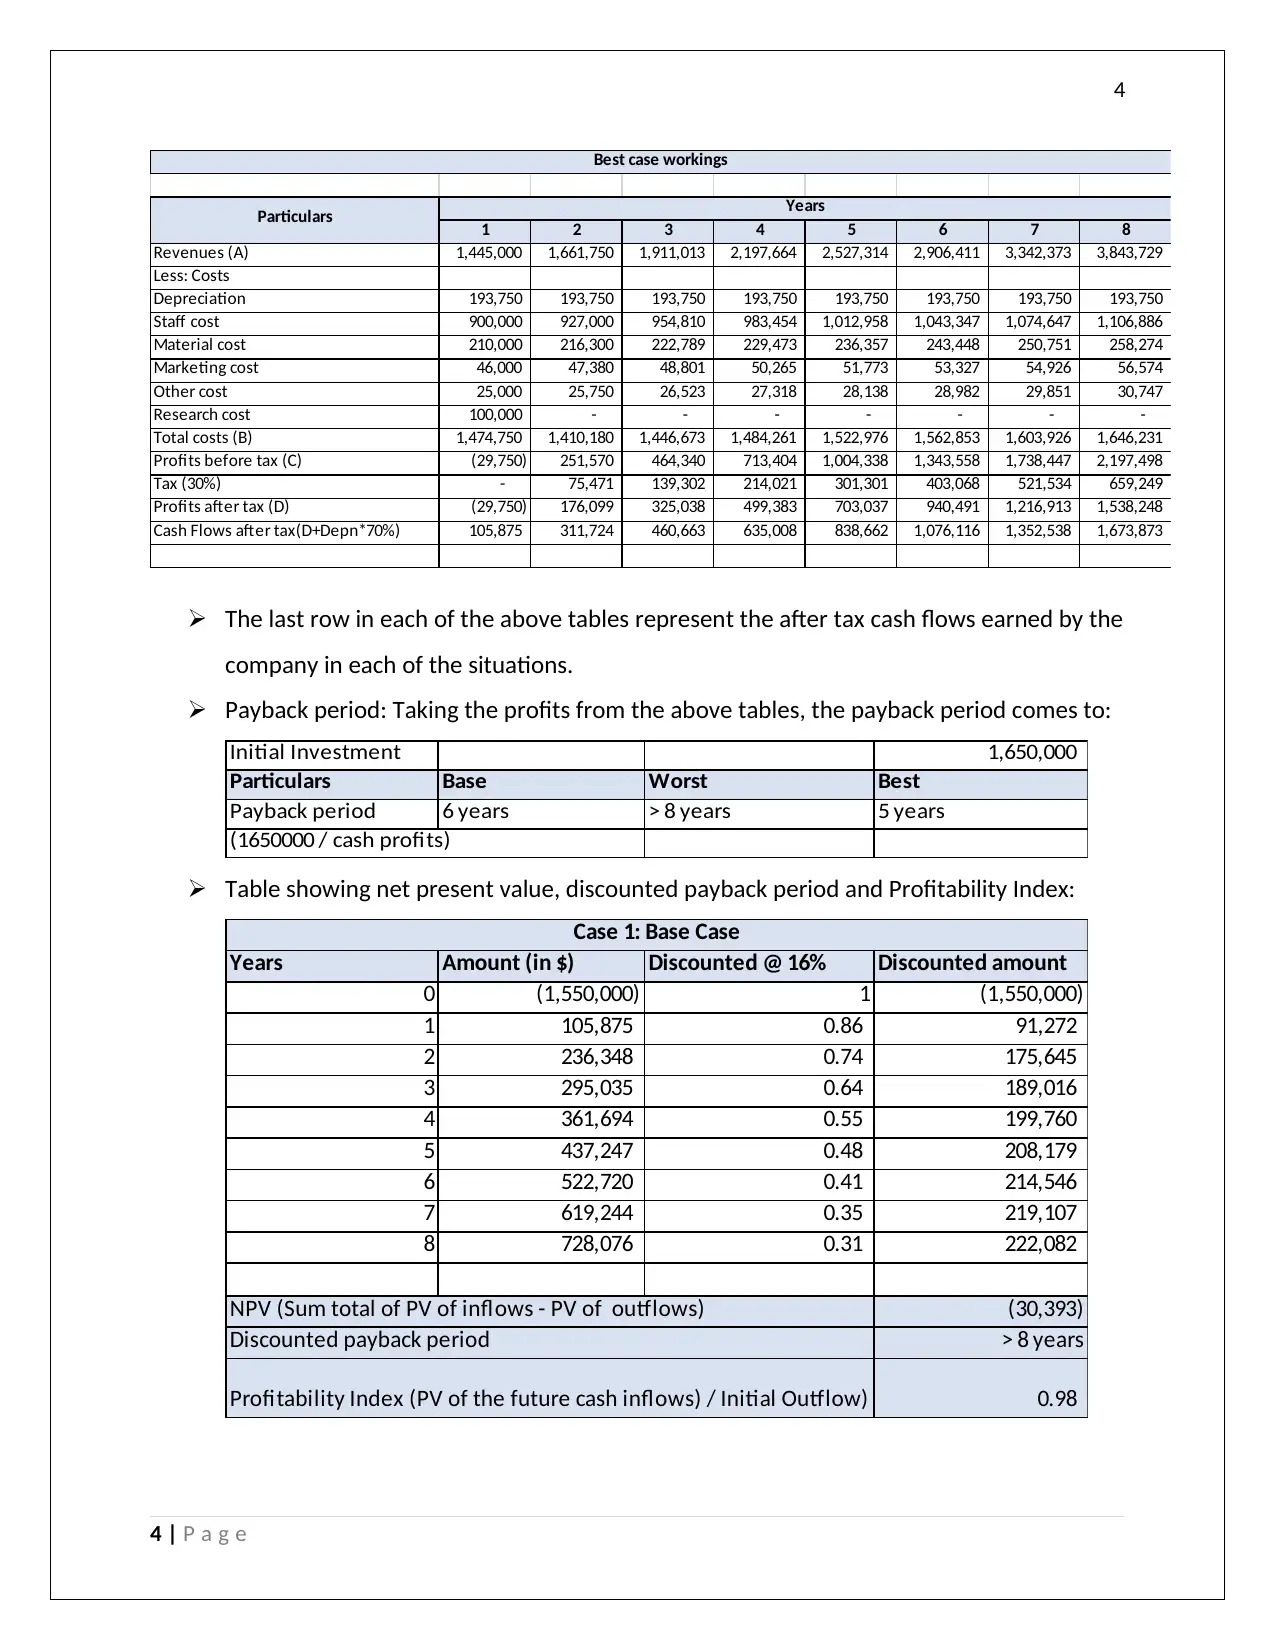
Best case workings
The last row in each of the above tables represent the after tax cash flows earned by the
company in each of the situations.
Payback period: Taking the profits from the above tables, the payback period comes to:
Initial Investment 1,650,000
Particulars Base Worst Best
Payback period 6 years > 8 years 5 years
(1650000 / cash profits)
Table showing net present value, discounted payback period and Profitability Index:
Years Amount (in $) Discounted @ 16% Discounted amount
0 (1,550,000) 1 (1,550,000)
1 105,875 0.86 91,272
2 236,348 0.74 175,645
3 295,035 0.64 189,016
4 361,694 0.55 199,760
5 437,247 0.48 208,179
6 522,720 0.41 214,546
7 619,244 0.35 219,107
8 728,076 0.31 222,082
(30,393)
> 8 years
0.98
Case 1: Base Case
NPV (Sum total of PV of inflows - PV of outflows)
Discounted payback period
Profitability Index (PV of the future cash inflows) / Initial Outflow)
4 | P a g e
1 2 3 4 5 6 7 8
Revenues (A) 1,445,000 1,661,750 1,911,013 2,197,664 2,527,314 2,906,411 3,342,373 3,843,729
Less: Costs
Depreciation 193,750 193,750 193,750 193,750 193,750 193,750 193,750 193,750
Staff cost 900,000 927,000 954,810 983,454 1,012,958 1,043,347 1,074,647 1,106,886
Material cost 210,000 216,300 222,789 229,473 236,357 243,448 250,751 258,274
Marketing cost 46,000 47,380 48,801 50,265 51,773 53,327 54,926 56,574
Other cost 25,000 25,750 26,523 27,318 28,138 28,982 29,851 30,747
Research cost 100,000 - - - - - - -
Total costs (B) 1,474,750 1,410,180 1,446,673 1,484,261 1,522,976 1,562,853 1,603,926 1,646,231
Profits before tax (C) (29,750) 251,570 464,340 713,404 1,004,338 1,343,558 1,738,447 2,197,498
Tax (30%) - 75,471 139,302 214,021 301,301 403,068 521,534 659,249
Profits after tax (D) (29,750) 176,099 325,038 499,383 703,037 940,491 1,216,913 1,538,248
Cash Flows after tax(D+Depn*70%) 105,875 311,724 460,663 635,008 838,662 1,076,116 1,352,538 1,673,873
Particulars Years
Best case workings
The last row in each of the above tables represent the after tax cash flows earned by the
company in each of the situations.
Payback period: Taking the profits from the above tables, the payback period comes to:
Initial Investment 1,650,000
Particulars Base Worst Best
Payback period 6 years > 8 years 5 years
(1650000 / cash profits)
Table showing net present value, discounted payback period and Profitability Index:
Years Amount (in $) Discounted @ 16% Discounted amount
0 (1,550,000) 1 (1,550,000)
1 105,875 0.86 91,272
2 236,348 0.74 175,645
3 295,035 0.64 189,016
4 361,694 0.55 199,760
5 437,247 0.48 208,179
6 522,720 0.41 214,546
7 619,244 0.35 219,107
8 728,076 0.31 222,082
(30,393)
> 8 years
0.98
Case 1: Base Case
NPV (Sum total of PV of inflows - PV of outflows)
Discounted payback period
Profitability Index (PV of the future cash inflows) / Initial Outflow)
4 | P a g e
5
Years Amount (in $) Discounted @ 16% Discounted amount
0 (1,550,000) 1 (1,550,000)
1 105,875 0.86 91,272
2 162,820 0.74 121,002
3 136,214 0.64 87,267
4 104,375 0.55 57,645
5 66,624 0.48 31,721
6 22,207 0.41 9,115
7 (29,717) 0.35 (10,515)
8 (90,082) 0.31 (27,477)
(1,189,972)
> 8 years
0.23
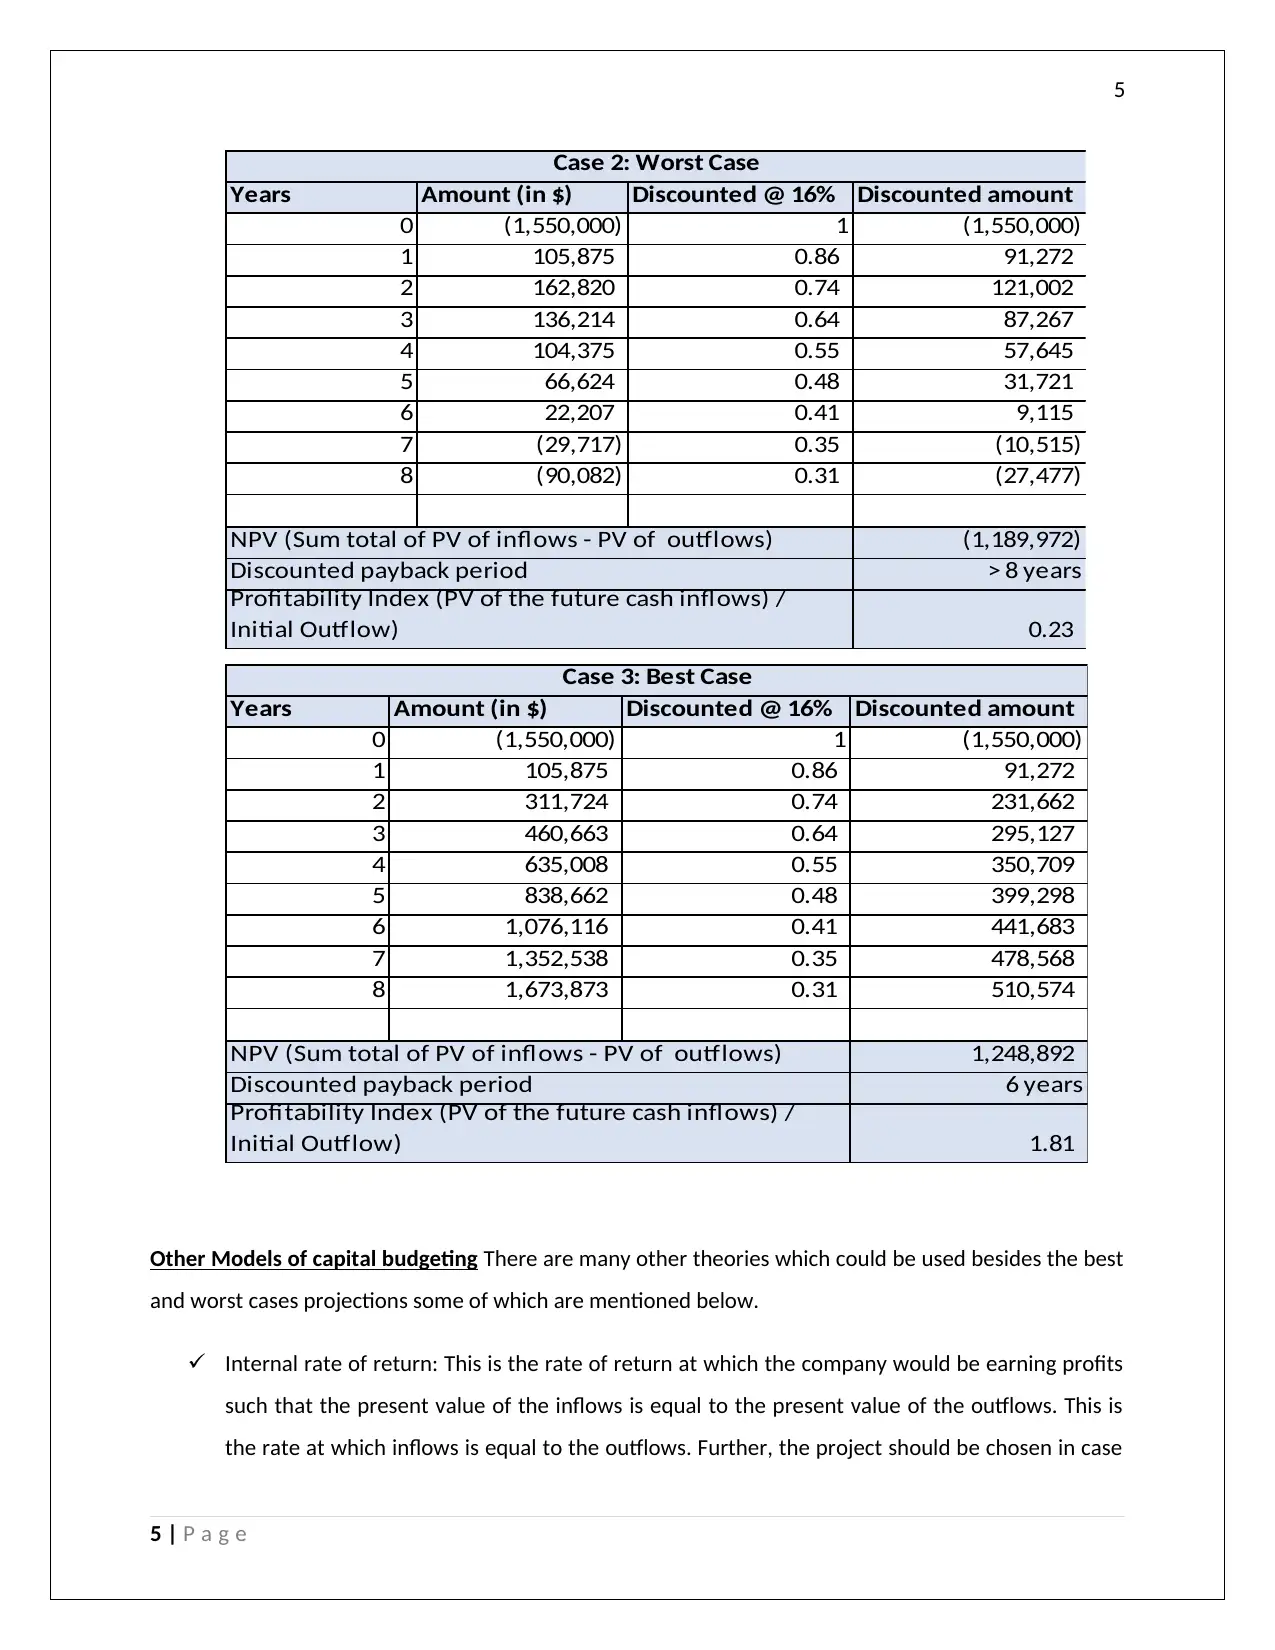
Case 2: Worst Case
NPV (Sum total of PV of inflows - PV of outflows)
Discounted payback period
Profitability Index (PV of the future cash inflows) /
Initial Outflow)
Years Amount (in $) Discounted @ 16% Discounted amount
0 (1,550,000) 1 (1,550,000)
1 105,875 0.86 91,272
2 311,724 0.74 231,662
3 460,663 0.64 295,127
4 635,008 0.55 350,709
5 838,662 0.48 399,298
6 1,076,116 0.41 441,683
7 1,352,538 0.35 478,568
8 1,673,873 0.31 510,574
1,248,892
6 years
1.81
Case 3: Best Case
NPV (Sum total of PV of inflows - PV of outflows)
Discounted payback period
Profitability Index (PV of the future cash inflows) /
Initial Outflow)
Other Models of capital budgeting There are many other theories which could be used besides the best
and worst cases projections some of which are mentioned below.
Internal rate of return: This is the rate of return at which the company would be earning profits
such that the present value of the inflows is equal to the present value of the outflows. This is
the rate at which inflows is equal to the outflows. Further, the project should be chosen in case
5 | P a g e
Years Amount (in $) Discounted @ 16% Discounted amount
0 (1,550,000) 1 (1,550,000)
1 105,875 0.86 91,272
2 162,820 0.74 121,002
3 136,214 0.64 87,267
4 104,375 0.55 57,645
5 66,624 0.48 31,721
6 22,207 0.41 9,115
7 (29,717) 0.35 (10,515)
8 (90,082) 0.31 (27,477)
(1,189,972)
> 8 years
0.23
Case 2: Worst Case
NPV (Sum total of PV of inflows - PV of outflows)
Discounted payback period
Profitability Index (PV of the future cash inflows) /
Initial Outflow)
Years Amount (in $) Discounted @ 16% Discounted amount
0 (1,550,000) 1 (1,550,000)
1 105,875 0.86 91,272
2 311,724 0.74 231,662
3 460,663 0.64 295,127
4 635,008 0.55 350,709
5 838,662 0.48 399,298
6 1,076,116 0.41 441,683
7 1,352,538 0.35 478,568
8 1,673,873 0.31 510,574
1,248,892
6 years
1.81
Case 3: Best Case
NPV (Sum total of PV of inflows - PV of outflows)
Discounted payback period
Profitability Index (PV of the future cash inflows) /
Initial Outflow)
Other Models of capital budgeting There are many other theories which could be used besides the best
and worst cases projections some of which are mentioned below.
Internal rate of return: This is the rate of return at which the company would be earning profits
such that the present value of the inflows is equal to the present value of the outflows. This is
the rate at which inflows is equal to the outflows. Further, the project should be chosen in case
5 | P a g e
⊘ This is a preview!⊘
Do you want full access?
Subscribe today to unlock all pages.
Trusted by 1+ million students worldwide
6
the IRR is more than the expected rate of return and rejected in case if it is less than the
expected rate. (Bena, Ferraira, Matos, & Pires, 2017)
Return on investment: This is the rate at which the investors earn on the investment being done
in the company. This is calculated by dividing the distributable profit by the shareholder’s funds.
Apart from all this, a weighted average of the returns fro the 3 situations given could have been
taken out and then analysed whether to invest in the opportunity or not. There could have been
any basis of giving the weights like the industry trend and tehn if the output would have been
positive, the project could be accepted and if negative or zero, the project should have been
rejected.
Decision on the above Project
The above proposal can be accepted only in the case of the best case and the base case scenario.
Since, in the worst case, the project is in loss from all the capital budgeting perspectives the same
cannot be considered. Moreover, to take the decision, certain other information is alo required like
the proportion amongst the best, base and the worst case scenario so that the decision can be taken
on the average basis. The other alternatives could be make or buy decision, subcontracting it or
seeing for an alternative vendor offering more discount. (Fay & Negangard, 2017)
6 | P a g e
Paraphrase This Document
Need a fresh take? Get an instant paraphrase of this document with our AI Paraphraser
7
Question No. 2
Introduction and Executive Summary
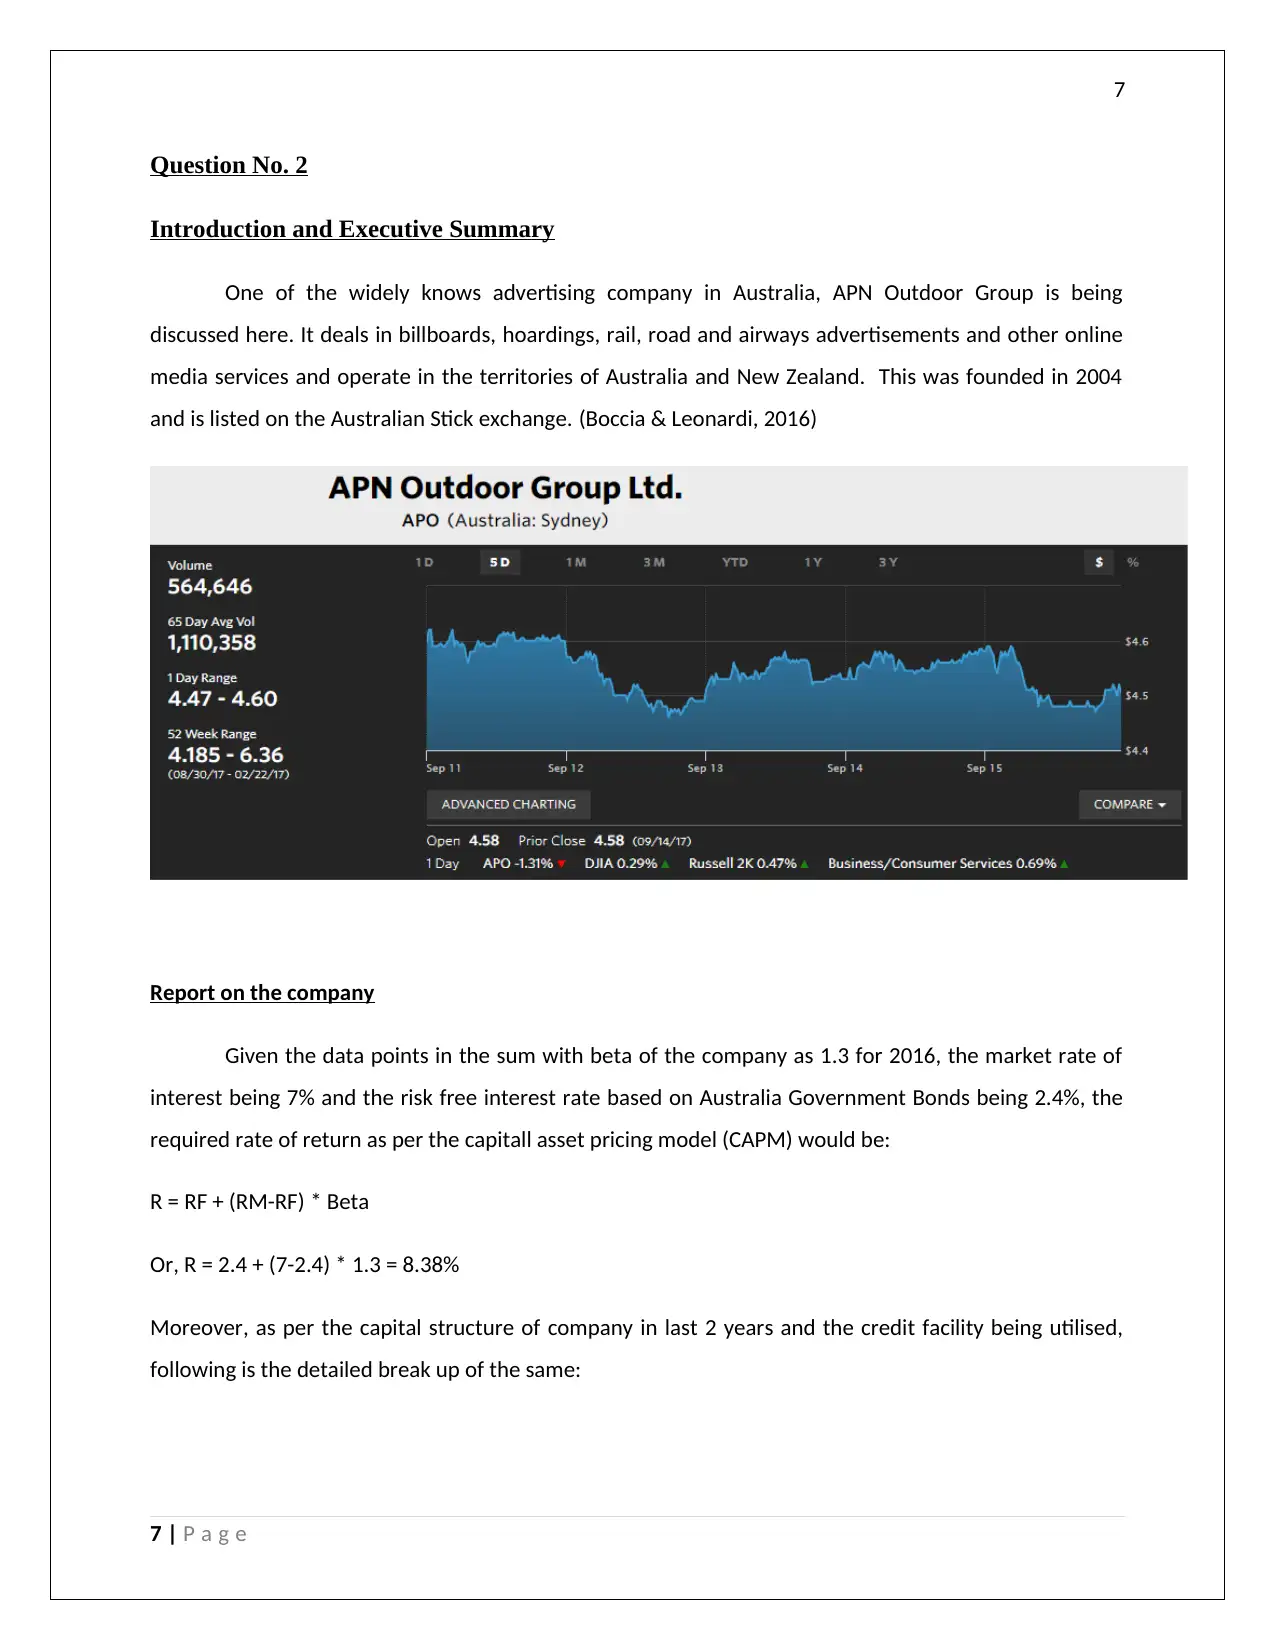
One of the widely knows advertising company in Australia, APN Outdoor Group is being
discussed here. It deals in billboards, hoardings, rail, road and airways advertisements and other online
media services and operate in the territories of Australia and New Zealand. This was founded in 2004
and is listed on the Australian Stick exchange. (Boccia & Leonardi, 2016)
Report on the company
Given the data points in the sum with beta of the company as 1.3 for 2016, the market rate of
interest being 7% and the risk free interest rate based on Australia Government Bonds being 2.4%, the
required rate of return as per the capitall asset pricing model (CAPM) would be:
R = RF + (RM-RF) * Beta
Or, R = 2.4 + (7-2.4) * 1.3 = 8.38%
Moreover, as per the capital structure of company in last 2 years and the credit facility being utilised,
following is the detailed break up of the same:
7 | P a g e
Question No. 2
Introduction and Executive Summary
One of the widely knows advertising company in Australia, APN Outdoor Group is being
discussed here. It deals in billboards, hoardings, rail, road and airways advertisements and other online
media services and operate in the territories of Australia and New Zealand. This was founded in 2004
and is listed on the Australian Stick exchange. (Boccia & Leonardi, 2016)
Report on the company
Given the data points in the sum with beta of the company as 1.3 for 2016, the market rate of
interest being 7% and the risk free interest rate based on Australia Government Bonds being 2.4%, the
required rate of return as per the capitall asset pricing model (CAPM) would be:
R = RF + (RM-RF) * Beta
Or, R = 2.4 + (7-2.4) * 1.3 = 8.38%
Moreover, as per the capital structure of company in last 2 years and the credit facility being utilised,
following is the detailed break up of the same:
7 | P a g e
8
FQ2 2017 (J un- 30- 2017) Capital Structure As Reported Details
Description Type Principal Due (AUD)
General Corporate Facility A * Revolving Credit 80.0
General Corporate Facility C * Revolving Credit -
Working Capital Facility B * Revolving Credit 23.0
FY 2016 (Dec- 31- 2016) Capital Structure As Reported Details
Description Type Principal Due (AUD)
General Corporate Facility A Revolving Credit 80.0
General Corporate Facility C Revolving Credit -
Working Capital Facility B Revolving Credit 23.0
APN Outdoor Group Limited Capital Structure
Details
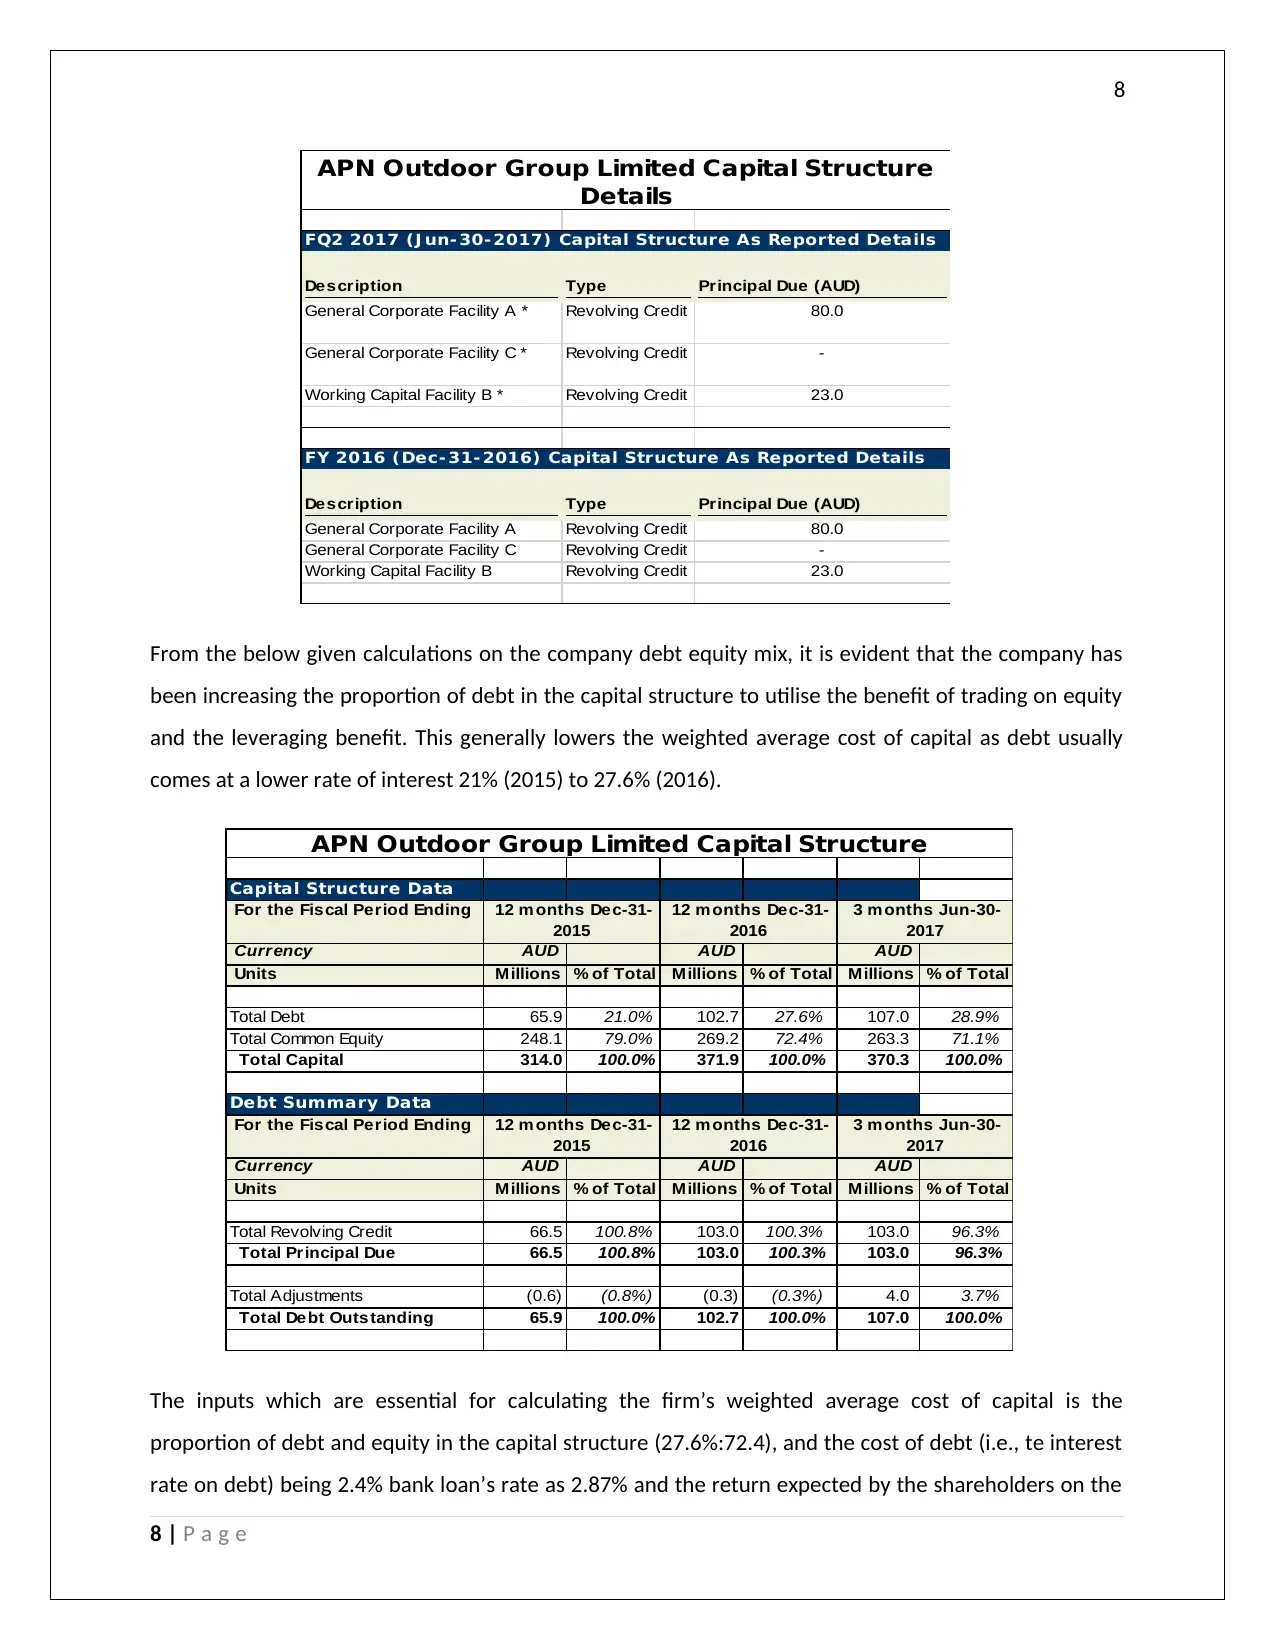
From the below given calculations on the company debt equity mix, it is evident that the company has
been increasing the proportion of debt in the capital structure to utilise the benefit of trading on equity
and the leveraging benefit. This generally lowers the weighted average cost of capital as debt usually
comes at a lower rate of interest 21% (2015) to 27.6% (2016).
Capital Structure Data
For the Fiscal Period Ending
Currency AUD AUD AUD
Units Millions % of Total Millions % of Total Millions % of Total
Total Debt 65.9 21.0% 102.7 27.6% 107.0 28.9%
Total Common Equity 248.1 79.0% 269.2 72.4% 263.3 71.1%
Total Capital 314.0 100.0% 371.9 100.0% 370.3 100.0%
Debt Summary Data
For the Fiscal Period Ending
Currency AUD AUD AUD
Units Millions % of Total Millions % of Total Millions % of Total
Total Revolving Credit 66.5 100.8% 103.0 100.3% 103.0 96.3%
Total Principal Due 66.5 100.8% 103.0 100.3% 103.0 96.3%
Total Adjustments (0.6) (0.8%) (0.3) (0.3%) 4.0 3.7%
Total Debt Outstanding 65.9 100.0% 102.7 100.0% 107.0 100.0%
APN Outdoor Group Limited Capital Structure
12 m onths Dec-31-
2015
12 m onths Dec-31-
2016
3 m onths Jun-30-
2017
12 m onths Dec-31-
2015
12 m onths Dec-31-
2016
3 m onths Jun-30-
2017
The inputs which are essential for calculating the firm’s weighted average cost of capital is the
proportion of debt and equity in the capital structure (27.6%:72.4), and the cost of debt (i.e., te interest
rate on debt) being 2.4% bank loan’s rate as 2.87% and the return expected by the shareholders on the
8 | P a g e
FQ2 2017 (J un- 30- 2017) Capital Structure As Reported Details
Description Type Principal Due (AUD)
General Corporate Facility A * Revolving Credit 80.0
General Corporate Facility C * Revolving Credit -
Working Capital Facility B * Revolving Credit 23.0
FY 2016 (Dec- 31- 2016) Capital Structure As Reported Details
Description Type Principal Due (AUD)
General Corporate Facility A Revolving Credit 80.0
General Corporate Facility C Revolving Credit -
Working Capital Facility B Revolving Credit 23.0
APN Outdoor Group Limited Capital Structure
Details
From the below given calculations on the company debt equity mix, it is evident that the company has
been increasing the proportion of debt in the capital structure to utilise the benefit of trading on equity
and the leveraging benefit. This generally lowers the weighted average cost of capital as debt usually
comes at a lower rate of interest 21% (2015) to 27.6% (2016).
Capital Structure Data
For the Fiscal Period Ending
Currency AUD AUD AUD
Units Millions % of Total Millions % of Total Millions % of Total
Total Debt 65.9 21.0% 102.7 27.6% 107.0 28.9%
Total Common Equity 248.1 79.0% 269.2 72.4% 263.3 71.1%
Total Capital 314.0 100.0% 371.9 100.0% 370.3 100.0%
Debt Summary Data
For the Fiscal Period Ending
Currency AUD AUD AUD
Units Millions % of Total Millions % of Total Millions % of Total
Total Revolving Credit 66.5 100.8% 103.0 100.3% 103.0 96.3%
Total Principal Due 66.5 100.8% 103.0 100.3% 103.0 96.3%
Total Adjustments (0.6) (0.8%) (0.3) (0.3%) 4.0 3.7%
Total Debt Outstanding 65.9 100.0% 102.7 100.0% 107.0 100.0%
APN Outdoor Group Limited Capital Structure
12 m onths Dec-31-
2015
12 m onths Dec-31-
2016
3 m onths Jun-30-
2017
12 m onths Dec-31-
2015
12 m onths Dec-31-
2016
3 m onths Jun-30-
2017
The inputs which are essential for calculating the firm’s weighted average cost of capital is the
proportion of debt and equity in the capital structure (27.6%:72.4), and the cost of debt (i.e., te interest
rate on debt) being 2.4% bank loan’s rate as 2.87% and the return expected by the shareholders on the
8 | P a g e
⊘ This is a preview!⊘
Do you want full access?
Subscribe today to unlock all pages.
Trusted by 1+ million students worldwide
9
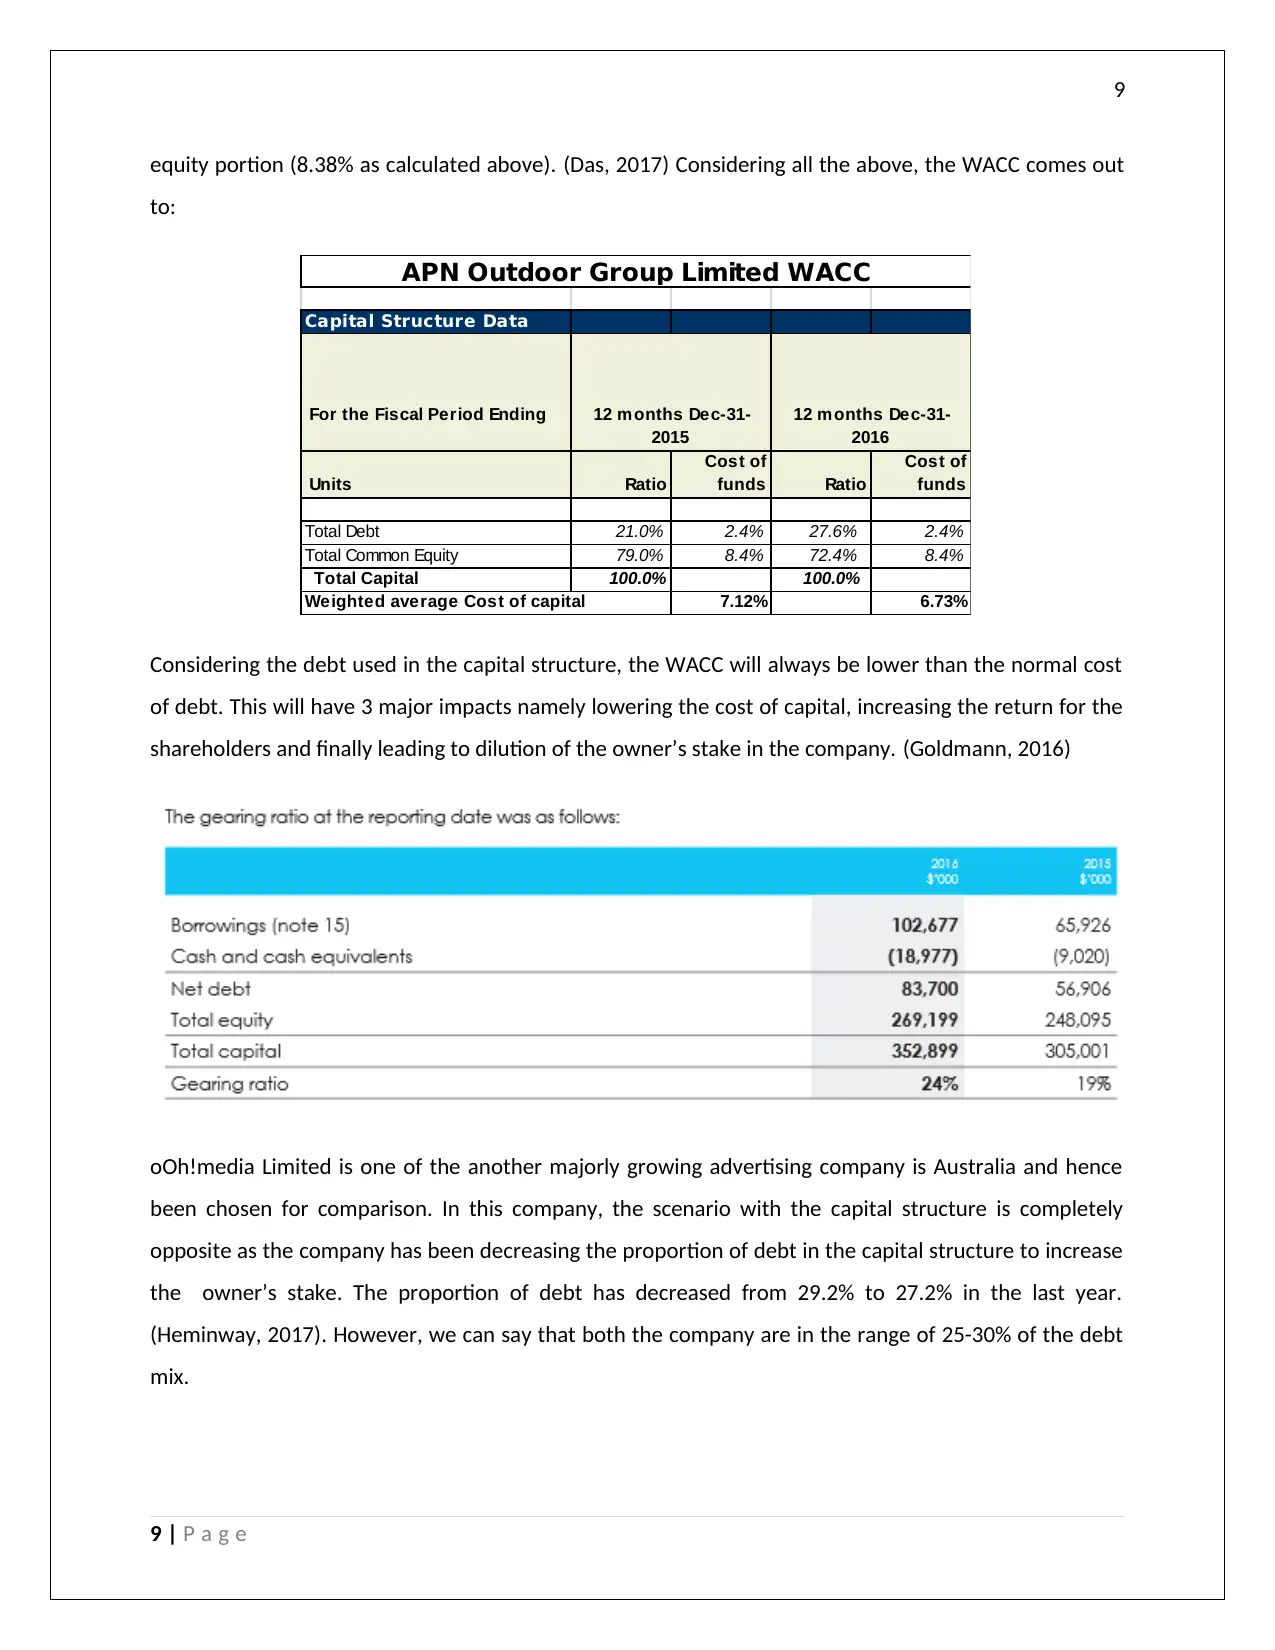
equity portion (8.38% as calculated above). (Das, 2017) Considering all the above, the WACC comes out
to:
Capital Structure Data
For the Fiscal Period Ending
Units Ratio
Cost of
funds Ratio
Cost of
funds
Total Debt 21.0% 2.4% 27.6% 2.4%
Total Common Equity 79.0% 8.4% 72.4% 8.4%
Total Capital 100.0% 100.0%
Weighted average Cost of capital 7.12% 6.73%
12 m onths Dec-31-
2015
12 m onths Dec-31-
2016
APN Outdoor Group Limited WACC
Considering the debt used in the capital structure, the WACC will always be lower than the normal cost
of debt. This will have 3 major impacts namely lowering the cost of capital, increasing the return for the
shareholders and finally leading to dilution of the owner’s stake in the company. (Goldmann, 2016)
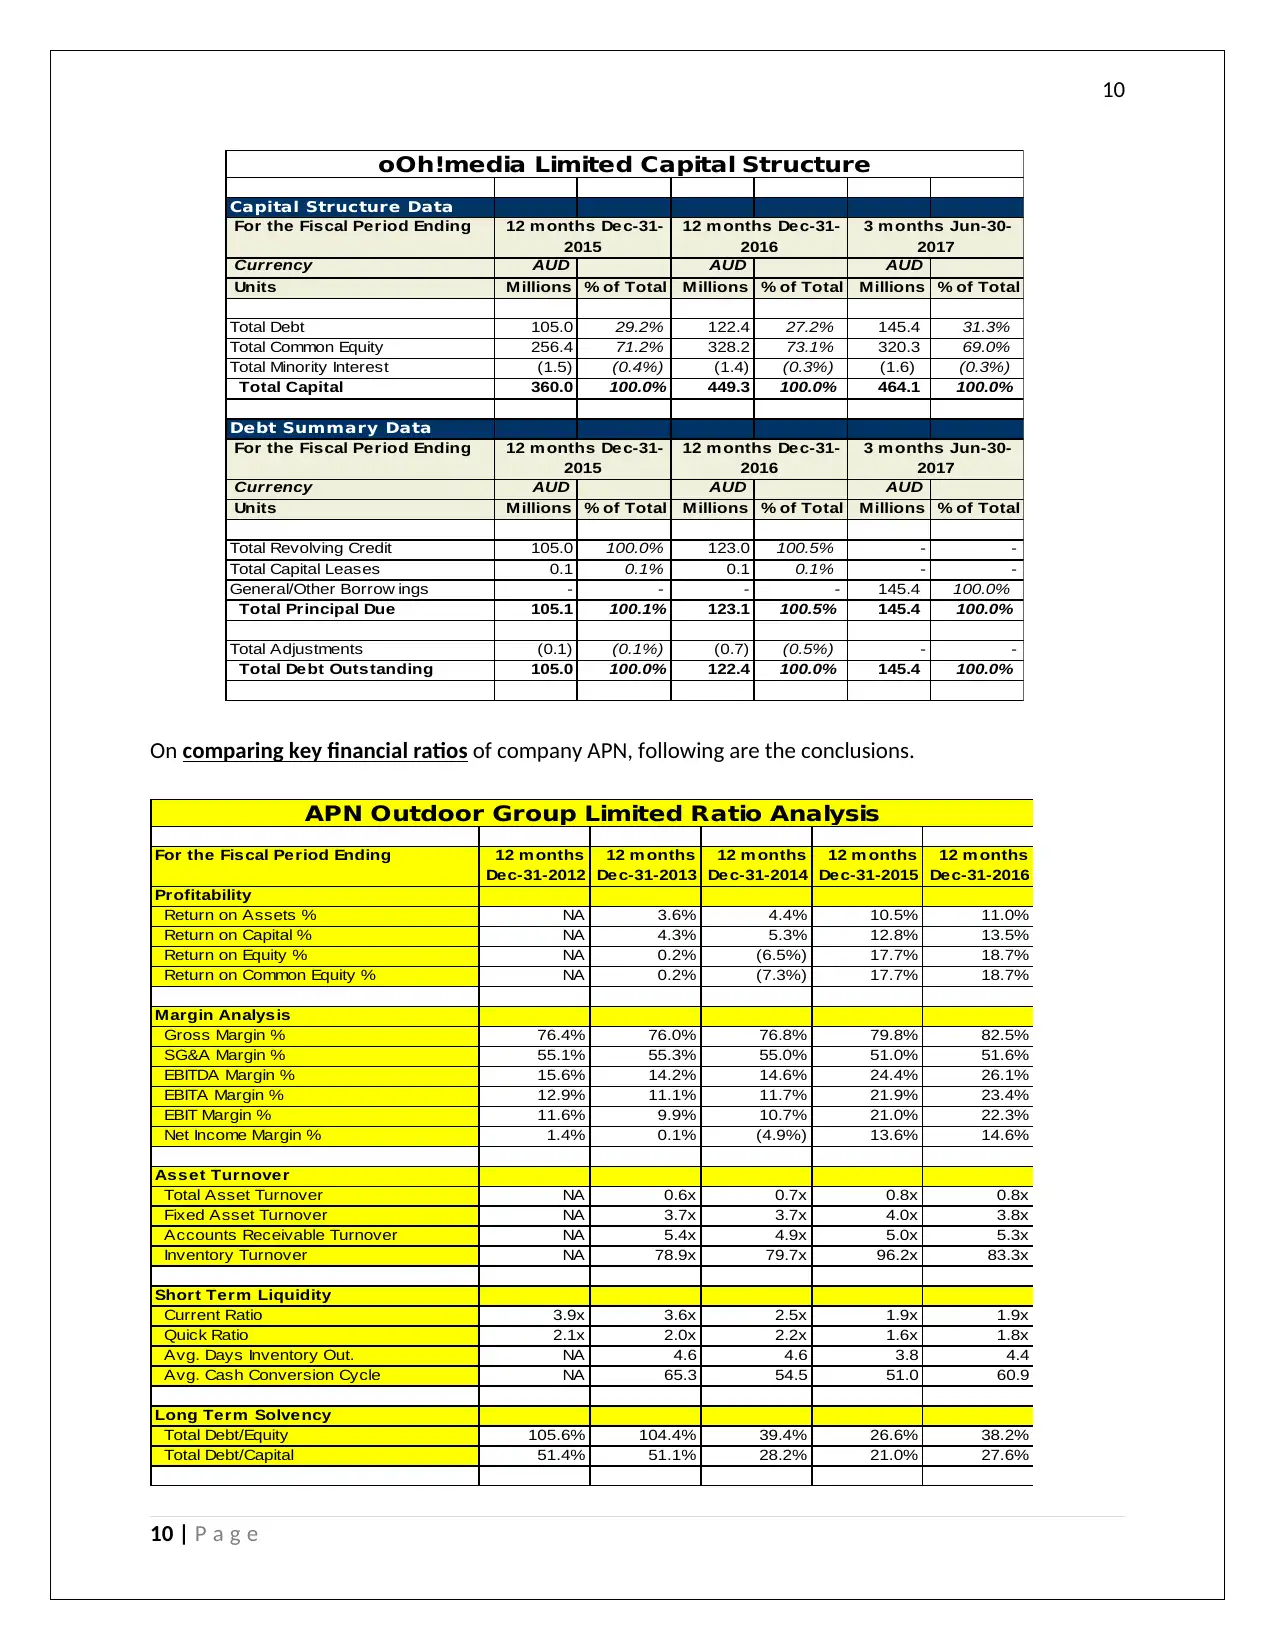
oOh!media Limited is one of the another majorly growing advertising company is Australia and hence
been chosen for comparison. In this company, the scenario with the capital structure is completely
opposite as the company has been decreasing the proportion of debt in the capital structure to increase
the owner’s stake. The proportion of debt has decreased from 29.2% to 27.2% in the last year.
(Heminway, 2017). However, we can say that both the company are in the range of 25-30% of the debt
mix.
9 | P a g e
equity portion (8.38% as calculated above). (Das, 2017) Considering all the above, the WACC comes out
to:
Capital Structure Data
For the Fiscal Period Ending
Units Ratio
Cost of
funds Ratio
Cost of
funds
Total Debt 21.0% 2.4% 27.6% 2.4%
Total Common Equity 79.0% 8.4% 72.4% 8.4%
Total Capital 100.0% 100.0%
Weighted average Cost of capital 7.12% 6.73%
12 m onths Dec-31-
2015
12 m onths Dec-31-
2016
APN Outdoor Group Limited WACC
Considering the debt used in the capital structure, the WACC will always be lower than the normal cost
of debt. This will have 3 major impacts namely lowering the cost of capital, increasing the return for the
shareholders and finally leading to dilution of the owner’s stake in the company. (Goldmann, 2016)
oOh!media Limited is one of the another majorly growing advertising company is Australia and hence
been chosen for comparison. In this company, the scenario with the capital structure is completely
opposite as the company has been decreasing the proportion of debt in the capital structure to increase
the owner’s stake. The proportion of debt has decreased from 29.2% to 27.2% in the last year.
(Heminway, 2017). However, we can say that both the company are in the range of 25-30% of the debt
mix.
9 | P a g e
Paraphrase This Document
Need a fresh take? Get an instant paraphrase of this document with our AI Paraphraser
10
Capital Structure Data
For the Fiscal Period Ending
Currency AUD AUD AUD
Units Millions % of Total Millions % of Total Millions % of Total
Total Debt 105.0 29.2% 122.4 27.2% 145.4 31.3%
Total Common Equity 256.4 71.2% 328.2 73.1% 320.3 69.0%
Total Minority Interest (1.5) (0.4%) (1.4) (0.3%) (1.6) (0.3%)
Total Capital 360.0 100.0% 449.3 100.0% 464.1 100.0%
Debt Summary Data
For the Fiscal Period Ending
Currency AUD AUD AUD
Units Millions % of Total Millions % of Total Millions % of Total
Total Revolving Credit 105.0 100.0% 123.0 100.5% - -
Total Capital Leases 0.1 0.1% 0.1 0.1% - -
General/Other Borrow ings - - - - 145.4 100.0%
Total Principal Due 105.1 100.1% 123.1 100.5% 145.4 100.0%
Total Adjustments (0.1) (0.1%) (0.7) (0.5%) - -
Total Debt Outstanding 105.0 100.0% 122.4 100.0% 145.4 100.0%
oOh!media Limited Capital Structure
12 m onths Dec-31-
2015
12 m onths Dec-31-
2016
3 m onths Jun-30-
2017
12 m onths Dec-31-
2015
12 m onths Dec-31-
2016
3 m onths Jun-30-
2017
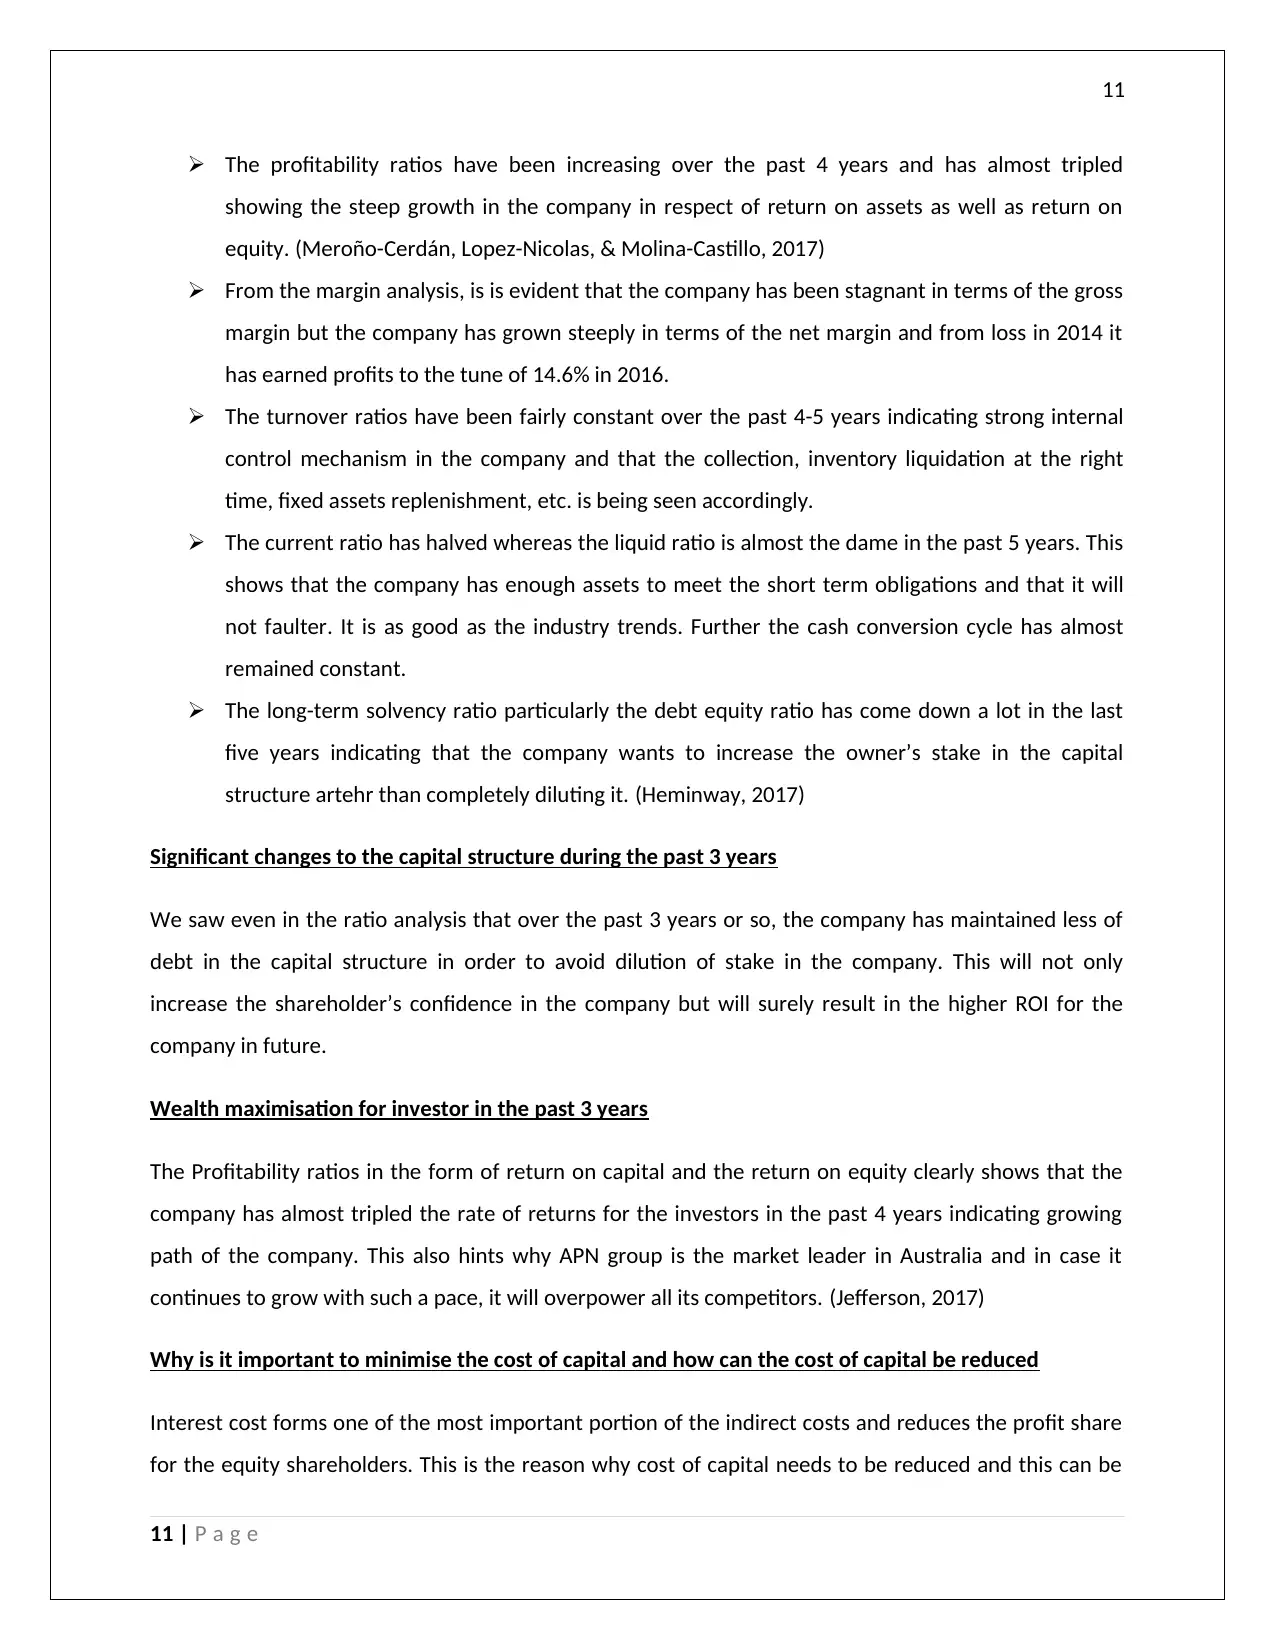
On comparing key financial ratios of company APN, following are the conclusions.
For the Fiscal Period Ending 12 m onths
Dec-31-2012
12 m onths
Dec-31-2013
12 m onths
Dec-31-2014
12 m onths
Dec-31-2015
12 m onths
Dec-31-2016
Profitability
Return on Assets % NA 3.6% 4.4% 10.5% 11.0%
Return on Capital % NA 4.3% 5.3% 12.8% 13.5%
Return on Equity % NA 0.2% (6.5%) 17.7% 18.7%
Return on Common Equity % NA 0.2% (7.3%) 17.7% 18.7%
Margin Analysis
Gross Margin % 76.4% 76.0% 76.8% 79.8% 82.5%
SG&A Margin % 55.1% 55.3% 55.0% 51.0% 51.6%
EBITDA Margin % 15.6% 14.2% 14.6% 24.4% 26.1%
EBITA Margin % 12.9% 11.1% 11.7% 21.9% 23.4%
EBIT Margin % 11.6% 9.9% 10.7% 21.0% 22.3%
Net Income Margin % 1.4% 0.1% (4.9%) 13.6% 14.6%
Asset Turnover
Total Asset Turnover NA 0.6x 0.7x 0.8x 0.8x
Fixed Asset Turnover NA 3.7x 3.7x 4.0x 3.8x
Accounts Receivable Turnover NA 5.4x 4.9x 5.0x 5.3x
Inventory Turnover NA 78.9x 79.7x 96.2x 83.3x
Short Term Liquidity
Current Ratio 3.9x 3.6x 2.5x 1.9x 1.9x
Quick Ratio 2.1x 2.0x 2.2x 1.6x 1.8x
Avg. Days Inventory Out. NA 4.6 4.6 3.8 4.4
Avg. Cash Conversion Cycle NA 65.3 54.5 51.0 60.9
Long Term Solvency
Total Debt/Equity 105.6% 104.4% 39.4% 26.6% 38.2%
Total Debt/Capital 51.4% 51.1% 28.2% 21.0% 27.6%
APN Outdoor Group Limited Ratio Analysis
10 | P a g e
Capital Structure Data
For the Fiscal Period Ending
Currency AUD AUD AUD
Units Millions % of Total Millions % of Total Millions % of Total
Total Debt 105.0 29.2% 122.4 27.2% 145.4 31.3%
Total Common Equity 256.4 71.2% 328.2 73.1% 320.3 69.0%
Total Minority Interest (1.5) (0.4%) (1.4) (0.3%) (1.6) (0.3%)
Total Capital 360.0 100.0% 449.3 100.0% 464.1 100.0%
Debt Summary Data
For the Fiscal Period Ending
Currency AUD AUD AUD
Units Millions % of Total Millions % of Total Millions % of Total
Total Revolving Credit 105.0 100.0% 123.0 100.5% - -
Total Capital Leases 0.1 0.1% 0.1 0.1% - -
General/Other Borrow ings - - - - 145.4 100.0%
Total Principal Due 105.1 100.1% 123.1 100.5% 145.4 100.0%
Total Adjustments (0.1) (0.1%) (0.7) (0.5%) - -
Total Debt Outstanding 105.0 100.0% 122.4 100.0% 145.4 100.0%
oOh!media Limited Capital Structure
12 m onths Dec-31-
2015
12 m onths Dec-31-
2016
3 m onths Jun-30-
2017
12 m onths Dec-31-
2015
12 m onths Dec-31-
2016
3 m onths Jun-30-
2017
On comparing key financial ratios of company APN, following are the conclusions.
For the Fiscal Period Ending 12 m onths
Dec-31-2012
12 m onths
Dec-31-2013
12 m onths
Dec-31-2014
12 m onths
Dec-31-2015
12 m onths
Dec-31-2016
Profitability
Return on Assets % NA 3.6% 4.4% 10.5% 11.0%
Return on Capital % NA 4.3% 5.3% 12.8% 13.5%
Return on Equity % NA 0.2% (6.5%) 17.7% 18.7%
Return on Common Equity % NA 0.2% (7.3%) 17.7% 18.7%
Margin Analysis
Gross Margin % 76.4% 76.0% 76.8% 79.8% 82.5%
SG&A Margin % 55.1% 55.3% 55.0% 51.0% 51.6%
EBITDA Margin % 15.6% 14.2% 14.6% 24.4% 26.1%
EBITA Margin % 12.9% 11.1% 11.7% 21.9% 23.4%
EBIT Margin % 11.6% 9.9% 10.7% 21.0% 22.3%
Net Income Margin % 1.4% 0.1% (4.9%) 13.6% 14.6%
Asset Turnover
Total Asset Turnover NA 0.6x 0.7x 0.8x 0.8x
Fixed Asset Turnover NA 3.7x 3.7x 4.0x 3.8x
Accounts Receivable Turnover NA 5.4x 4.9x 5.0x 5.3x
Inventory Turnover NA 78.9x 79.7x 96.2x 83.3x
Short Term Liquidity
Current Ratio 3.9x 3.6x 2.5x 1.9x 1.9x
Quick Ratio 2.1x 2.0x 2.2x 1.6x 1.8x
Avg. Days Inventory Out. NA 4.6 4.6 3.8 4.4
Avg. Cash Conversion Cycle NA 65.3 54.5 51.0 60.9
Long Term Solvency
Total Debt/Equity 105.6% 104.4% 39.4% 26.6% 38.2%
Total Debt/Capital 51.4% 51.1% 28.2% 21.0% 27.6%
APN Outdoor Group Limited Ratio Analysis
10 | P a g e
11
The profitability ratios have been increasing over the past 4 years and has almost tripled
showing the steep growth in the company in respect of return on assets as well as return on
equity. (Meroño-Cerdán, Lopez-Nicolas, & Molina-Castillo, 2017)
From the margin analysis, is is evident that the company has been stagnant in terms of the gross
margin but the company has grown steeply in terms of the net margin and from loss in 2014 it
has earned profits to the tune of 14.6% in 2016.
The turnover ratios have been fairly constant over the past 4-5 years indicating strong internal
control mechanism in the company and that the collection, inventory liquidation at the right
time, fixed assets replenishment, etc. is being seen accordingly.
The current ratio has halved whereas the liquid ratio is almost the dame in the past 5 years. This
shows that the company has enough assets to meet the short term obligations and that it will
not faulter. It is as good as the industry trends. Further the cash conversion cycle has almost
remained constant.
The long-term solvency ratio particularly the debt equity ratio has come down a lot in the last
five years indicating that the company wants to increase the owner’s stake in the capital
structure artehr than completely diluting it. (Heminway, 2017)
Significant changes to the capital structure during the past 3 years
We saw even in the ratio analysis that over the past 3 years or so, the company has maintained less of
debt in the capital structure in order to avoid dilution of stake in the company. This will not only
increase the shareholder’s confidence in the company but will surely result in the higher ROI for the
company in future.
Wealth maximisation for investor in the past 3 years
The Profitability ratios in the form of return on capital and the return on equity clearly shows that the
company has almost tripled the rate of returns for the investors in the past 4 years indicating growing
path of the company. This also hints why APN group is the market leader in Australia and in case it
continues to grow with such a pace, it will overpower all its competitors. (Jefferson, 2017)
Why is it important to minimise the cost of capital and how can the cost of capital be reduced
Interest cost forms one of the most important portion of the indirect costs and reduces the profit share
for the equity shareholders. This is the reason why cost of capital needs to be reduced and this can be
11 | P a g e
⊘ This is a preview!⊘
Do you want full access?
Subscribe today to unlock all pages.
Trusted by 1+ million students worldwide
1 out of 15
Related Documents


Your All-in-One AI-Powered Toolkit for Academic Success.
+13062052269
info@desklib.com
Available 24*7 on WhatsApp / Email
![[object Object]](/_next/static/media/star-bottom.7253800d.svg)
Unlock your academic potential
Copyright © 2020–2026 A2Z Services. All Rights Reserved. Developed and managed by ZUCOL.