Financial Decision Making: Ratio Analysis, Investment Appraisal
VerifiedAdded on 2023/04/07
|18
|4045
|178
Report
AI Summary
This report provides a financial analysis of Associated British Food Plc. using data from 2014 to 2018. It explores financial ratios, including profitability (Return on Capital Employed), liquidity (Current Ratio), asset efficiency (Receivable Turnover Ratio), and solvency (Debt to Equity Ratio), highlighting their limitations and applicability. The report includes an investment appraisal of £30,000,000 to £40,000,000 using Net Present Value (NPV) and Internal Rate of Return (IRR) techniques, followed by a sensitivity analysis. Furthermore, it examines the potential acquisition strategies for company expansion, evaluating synergistic gains, financing, and associated risks. The conclusion assesses the financial stability of Associated British Food based on these analyses.

Running Head: Finance for Decision Making
[Type the company name]
Finance for Decision Making
[Type the document subtitle]
Laptop04011
[Pick the date]
[Type the company name]
Finance for Decision Making
[Type the document subtitle]
Laptop04011
[Pick the date]
Paraphrase This Document
Need a fresh take? Get an instant paraphrase of this document with our AI Paraphraser
Finance for Decision Making
Contents
Introduction......................................................................................................................................3
Overview of Ratio Analysis.............................................................................................................3
Profitability Ratio........................................................................................................................4
Return on Capital Employed...................................................................................................4
Liquidity Ratio.............................................................................................................................4
Current Ratio...........................................................................................................................5
Asset Efficiency Ratio.................................................................................................................5
Receivable Turnover Ratio......................................................................................................6
Solvency Ratio.............................................................................................................................6
Debt to Equity Ratio................................................................................................................7
Ratio Limitation...........................................................................................................................7
Investment Appraisal.......................................................................................................................8
Net Present Value........................................................................................................................8
Limitation................................................................................................................................8
Internal Rate of Return................................................................................................................8
Limitations...............................................................................................................................9
Investment Analysis.....................................................................................................................9
Sensitivity Analysis...................................................................................................................11
Potential Merger and Acquisition..................................................................................................11
Acquisition Rationale................................................................................................................12
Proposed Deal Value and Finance.............................................................................................13
Synergetic Gains........................................................................................................................13
Risk Assessment and Implication..............................................................................................14
Conclusion.....................................................................................................................................14

Finance for Decision Making
References......................................................................................................................................15
References......................................................................................................................................15
⊘ This is a preview!⊘
Do you want full access?
Subscribe today to unlock all pages.
Trusted by 1+ million students worldwide
Finance for Decision Making
Introduction
Associated British Food Plc. is a British multinational food processing and retailing organization
that operates its business in diversified food products and Retail Company worldwide. The
company operates its business functions in five segments that are sugar, retail, agriculture,
grocery and ingredients. The company is headquartered in London and its ingredient division is
world’s second largest producer of both sugar and bakery yeast. The public limited company was
founded in 1935 by Willard Garfield Weston, since then the company has been profitable in the
environment. In the previous year, ABF earned revenue of $ 15574 million with 137000 numbers
of employees working with them. The retail division of the company naming Primark has more
than 345 stores in different markets. The company sell its produce to Belgium, Ireland, Austria,
UK, Netherlands, Italy, Portugal, France, Spain, Germany and the US. Around 54.5% shares of
the company are held by Wittington investments (MorningStar 2019).
Further, the purpose of below mentioned report is to enlighten the reader about the company
Associated British Food using the annual reports, data and other information about the company
starting from the year 2014 to 2018 with further elaboration in three sections. The paper is going
to explore the limitation, applicability and the financial ratios to determine the actual financial
performance of the company by applying one financial ratio from each category. Further, the
investment appraisal of £30,000,000 to £40,000,000 with a discounting rate of 15% and ten years
life will be conducted using NPV and IRR techniques which is further followed by the sensitivity
analysis to elaborate the implication and limitations of the analysis. The third aspect presented in
the paper is the expansion of the company through potential acquisition, along with this
synergistic gain and financing have been evaluated in the paper to critically analyse the
expansion decision made along with the implications. Lastly, conclusion is drawn based on these
sections and further provides a viewpoint on the financial steadiness of Associated British Food.
Overview of Ratio Analysis
With the help of information so received from the financial statement, income statement ad cash
flow statement, the ratio analysis can be performed for further evaluation of the business
performance. Ratio analysis refers to a critical quantitative tool that helps in gaining information
Paraphrase This Document
Need a fresh take? Get an instant paraphrase of this document with our AI Paraphraser

Finance for Decision Making
about the liquidity, efficiency, financial gearing and the profitability of company by comparing
the information contained from the financial statements. This tool indicates the financial trends
of the company in both positive and negative ways (Uechi, et. al., 2015). Below mentioned is the
elaboration of each of four ratios to discover the areas where the company needs to improve and
help the investor to understand if there is any need of future change.
Profitability Ratio
Profitability ratio of a company helps the investor to analyse the effectiveness of the business to
produce profits in the environment. With the help of ROCE (return on capital employed) and net
profit margin ratio, a business can compare its profitability against their spending and suggest on
overall functions. The below mentioned is the analysis of ROCE for better information about
profitability of the company.
Return on Capital Employed
2014 2015 2016 2017 2018
0.00%
5.00%
10.00%
15.00%
20.00%
25.00%
Profitability Ratio
Return on equity
Net margin
Axis Title
The ROCE of the company explains that ABF is aiming to provide higher degree of returns to
the customers in the market. However, as compared to the return provided in the year 2014, the
ROCE has depleted in 2018. In 2018, the return on capital employed depleted because of
increase in equity of the company. Along with this, the net profits of the company also depleted
from 2017 to 2018 (Williams, and Dobelman 2017).
Liquidity Ratio
Liquidity ratio provides information to the managers about the short term position of the
company. This ratio provides information about the current assets and liability affecting the
Finance for Decision Making
liquidity of an organization. It is important for the organizations to attain optimum level of
liquidity for the company to meet unseen liability in the environment. Below mentioned is the
analysis of current ratio of the company (Zainudin, and Hashim 2016):
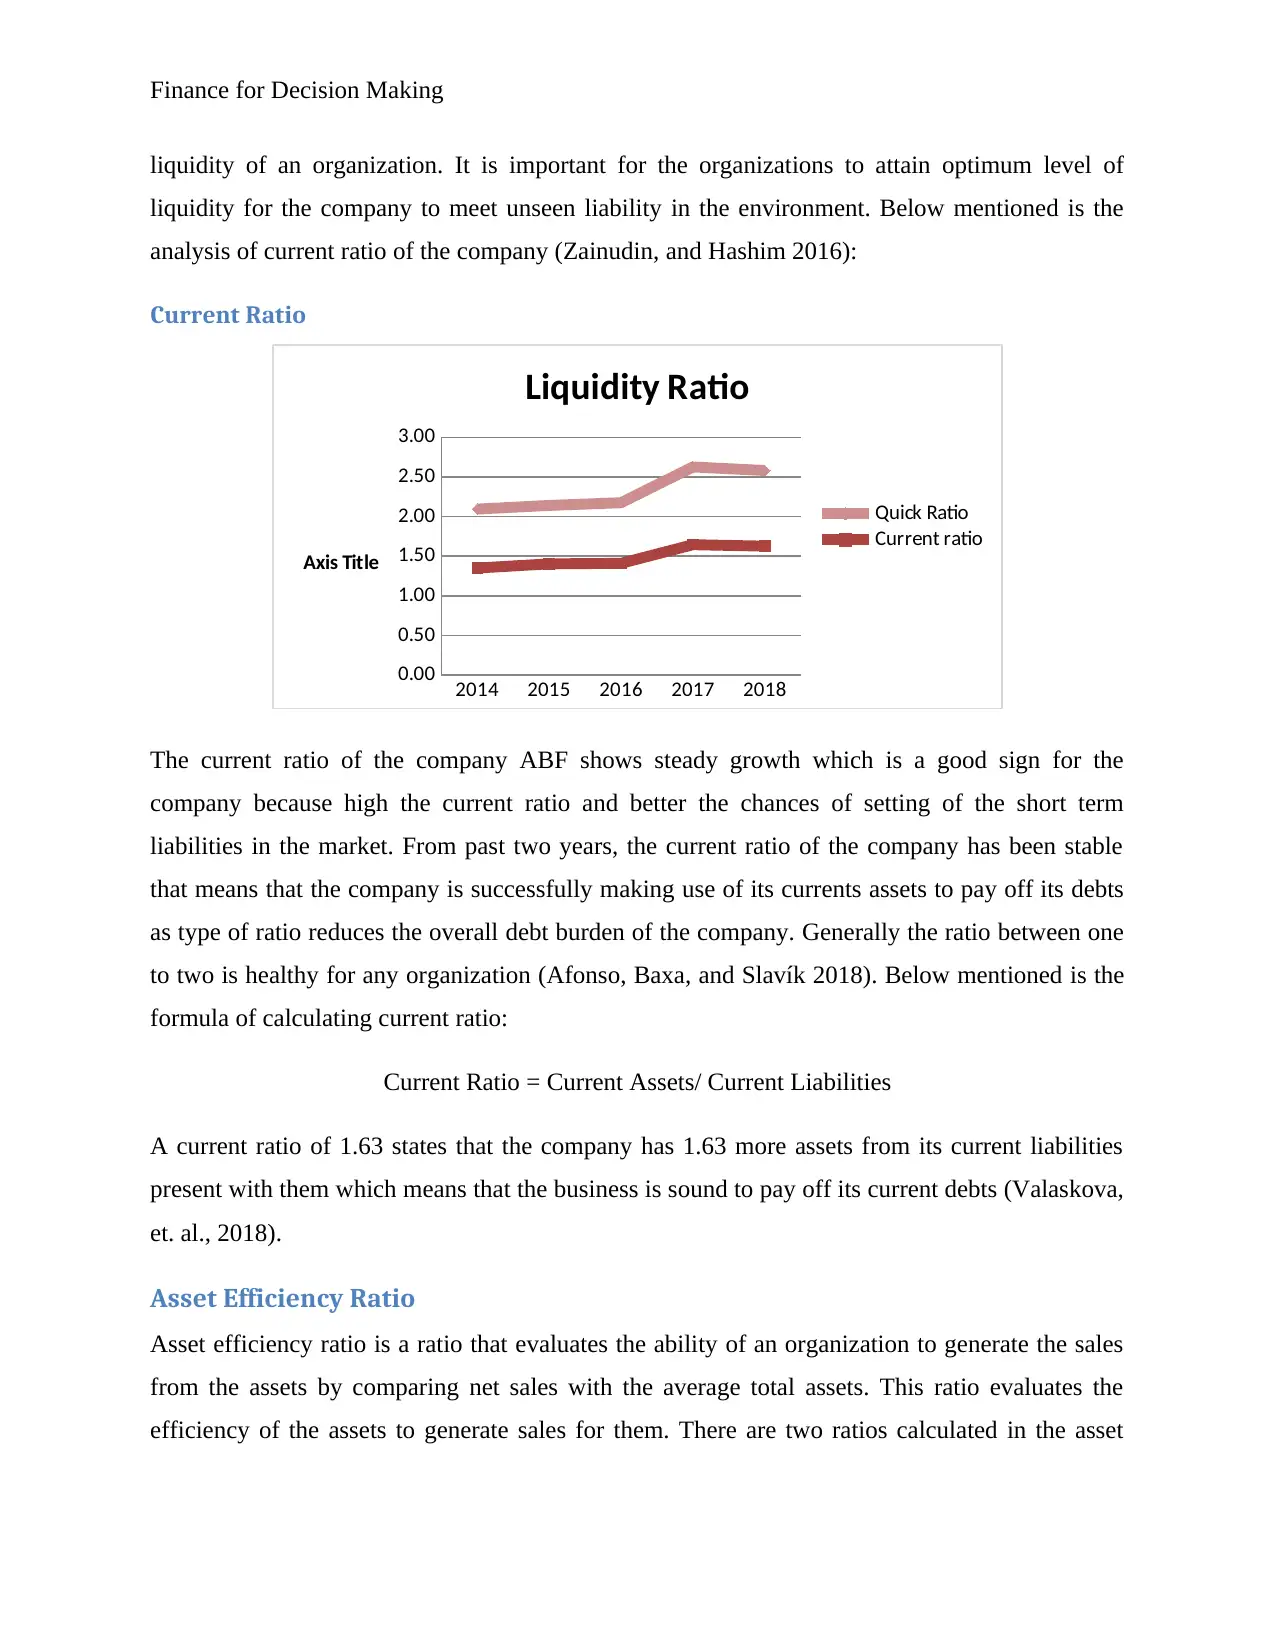
Current Ratio
2014 2015 2016 2017 2018
0.00
0.50
1.00
1.50
2.00
2.50
3.00
Liquidity Ratio
Quick Ratio
Current ratio
Axis Title
The current ratio of the company ABF shows steady growth which is a good sign for the
company because high the current ratio and better the chances of setting of the short term
liabilities in the market. From past two years, the current ratio of the company has been stable
that means that the company is successfully making use of its currents assets to pay off its debts
as type of ratio reduces the overall debt burden of the company. Generally the ratio between one
to two is healthy for any organization (Afonso, Baxa, and Slavík 2018). Below mentioned is the
formula of calculating current ratio:
Current Ratio = Current Assets/ Current Liabilities
A current ratio of 1.63 states that the company has 1.63 more assets from its current liabilities
present with them which means that the business is sound to pay off its current debts (Valaskova,
et. al., 2018).
Asset Efficiency Ratio
Asset efficiency ratio is a ratio that evaluates the ability of an organization to generate the sales
from the assets by comparing net sales with the average total assets. This ratio evaluates the
efficiency of the assets to generate sales for them. There are two ratios calculated in the asset
liquidity of an organization. It is important for the organizations to attain optimum level of
liquidity for the company to meet unseen liability in the environment. Below mentioned is the
analysis of current ratio of the company (Zainudin, and Hashim 2016):
Current Ratio
2014 2015 2016 2017 2018
0.00
0.50
1.00
1.50
2.00
2.50
3.00
Liquidity Ratio
Quick Ratio
Current ratio
Axis Title
The current ratio of the company ABF shows steady growth which is a good sign for the
company because high the current ratio and better the chances of setting of the short term
liabilities in the market. From past two years, the current ratio of the company has been stable
that means that the company is successfully making use of its currents assets to pay off its debts
as type of ratio reduces the overall debt burden of the company. Generally the ratio between one
to two is healthy for any organization (Afonso, Baxa, and Slavík 2018). Below mentioned is the
formula of calculating current ratio:
Current Ratio = Current Assets/ Current Liabilities
A current ratio of 1.63 states that the company has 1.63 more assets from its current liabilities
present with them which means that the business is sound to pay off its current debts (Valaskova,
et. al., 2018).
Asset Efficiency Ratio
Asset efficiency ratio is a ratio that evaluates the ability of an organization to generate the sales
from the assets by comparing net sales with the average total assets. This ratio evaluates the
efficiency of the assets to generate sales for them. There are two ratios calculated in the asset
⊘ This is a preview!⊘
Do you want full access?
Subscribe today to unlock all pages.
Trusted by 1+ million students worldwide

Finance for Decision Making
efficiency ratios that are receivable turnover and creditor’s turnover ratio (Greco, Figueira, and
Ehrgott 2016). Furthermore, elaboration of receivable turnover ratio is discussed below:
Receivable Turnover Ratio
The formula of account receivable turnover ratio is:
Receivable Turnover Ratio= Net Credit Sales/ Average Account Receivable
2014 2015 2016 2017 2018
0.0
5.0
10.0
15.0
20.0
25.0
30.0
Asset Efficiency Ratio
Creditor Turnover Ratio
Receivable Turnover Ratio
Axis Title
The receivable turnover ratio depicts the ability of the business to efficiently collect the
receivables. Higher ratio in this case is more favourable as higher ratio represents more chances
of the company to collect its receivables in a year. Further, the ratio in this case is 14.5 which
state that the company collected its receivables 14.5 times in a year due to which the liquidity of
the company is good (Rani, Yadav, and Jain 2015).
Solvency Ratio
The solvency ratio measures the ability of a business to sustain operations by comparing the debt
to equity level and debt to asset levels of the company. Like liquidity ratio, this type of ratio also
identifies the ability of firm to pay off its debts but in long term. This type of ratio measures the
long term ability of a company pays its debts and maintains sustainability (Myšková, and Hájek
2017). Further, more explanation of debt to equity ratio is discussed below:
Paraphrase This Document
Need a fresh take? Get an instant paraphrase of this document with our AI Paraphraser

Finance for Decision Making
Debt to Equity Ratio
2014 2015 2016 2017 2018
0.00
0.20
0.40
0.60
0.80
1.00
1.20
Solvency Ratio
Debt to assets
Debt to Equity Ratio
Axis Title
The formula of this ratio is mentioned below:
Debt to Equity Ratio= Long Term Debts/ Equity
This ratio shows the unfavourable growth of the company in the target market as the graph states
that the ratio is depleting which is not a good sign for the company. The debt to equity ratio of
0.33 explains that the company has 67% of long term liability over 33% of equity present in the
company. This company is leveraging high amount of debts which cannot be properly paid by
the equity of the company. The company needs to improve in this case as this ratio is fluctuating
between 0.33 to 0.38 and it is not growing (Camilleri, and Camilleri 2017).
Ratio Limitation
The ratio analysis is formed using historical result which does not mean that this type of
progress will continue in near future also.
There is presence of disparity as income statement data is evaluated on current cost while
balance sheet information is stated in historical cost (Richardson, Lanis, and Taylor
2015).
Inflation over time can change the results of the business.
It is difficult to interpret the results of the company as some ratios many times might
appear excellent but there might be a different and odd reason behind it (Enekwe 2015).
Debt to Equity Ratio
2014 2015 2016 2017 2018
0.00
0.20
0.40
0.60
0.80
1.00
1.20
Solvency Ratio
Debt to assets
Debt to Equity Ratio
Axis Title
The formula of this ratio is mentioned below:
Debt to Equity Ratio= Long Term Debts/ Equity
This ratio shows the unfavourable growth of the company in the target market as the graph states
that the ratio is depleting which is not a good sign for the company. The debt to equity ratio of
0.33 explains that the company has 67% of long term liability over 33% of equity present in the
company. This company is leveraging high amount of debts which cannot be properly paid by
the equity of the company. The company needs to improve in this case as this ratio is fluctuating
between 0.33 to 0.38 and it is not growing (Camilleri, and Camilleri 2017).
Ratio Limitation
The ratio analysis is formed using historical result which does not mean that this type of
progress will continue in near future also.
There is presence of disparity as income statement data is evaluated on current cost while
balance sheet information is stated in historical cost (Richardson, Lanis, and Taylor
2015).
Inflation over time can change the results of the business.
It is difficult to interpret the results of the company as some ratios many times might
appear excellent but there might be a different and odd reason behind it (Enekwe 2015).

Finance for Decision Making
Investment Appraisal
Investment appraisals are conducted to measure the practicability of the project and evaluate that
what benefits this investment will give to the company. Further, the net present value and
internal rate of rate are two ways that determine the profitability of the project.
Net Present Value
NPV is concept that was laid by Hirshleifer in the year 1958 based on the investment
consumption model. The discounted cash flow helps in analysing the capital investment
ventures. NPV helps in evaluating the potential outflow from a project by calculating the
difference between the present value of the cash inflow and outflow of the project (Petković
2015). In simple words, this calculation evaluates the amount of money that an investment will
generate after the cost adjustment and considering the time value of money. This concept tells
that money never be same as the value of pound keeps on growing due to interest and
opportunity cost. Thus, this methods helps in attaining the profitability from a project for a
certain amount of time say 10 years (Patrick, and French 2016).
Limitation
Net Present Value is a great tool to calculate the profitability of an investment decision of the
organization; however this tool is not always accurate. As this equation depends on so many
different factors that it can never be completely accurate. The interest rate on which the
calculation has been made might not be same for next 10 years. Also, the realist market have
limitation of funds and restriction to the capital resulting to which the application of NPV tool is
constrained. Nobody knows that the company will earn the expected profits in the market or not.
The only sure thing is the amount that the business has to pay for the project (Gallo 2016).
Internal Rate of Return
Internal Rate of Return (IRR) refers to a minimum discount rate that the management of an
organization utilize to identify the return that the future project will provide to the business. This
analysis helps the management in understanding that which project would be more profitable for
them in near future. The IRR for a project equates the net present value of future cash flow from
the project to zero. The biggest advantage of IRR tool is that it takes into account the risk, returns
⊘ This is a preview!⊘
Do you want full access?
Subscribe today to unlock all pages.
Trusted by 1+ million students worldwide

Finance for Decision Making
and time related to the certain project. This process helps the organization to make a wise choice
(Bell 2017).
Limitations
IRR does not work with the investments which are further considered as non-conventional cash
flow. The limitation of this type of method is that it does not consider important factors like
project duration, size of the project or future costs in account. This process only compares the
existing cost of the project, excluding all these factors. Thus, it is not wise for the management to
make investment decision without considering the size of the project. So, it can be said that
dependent or contingent projects along with mutually exclusive projects are ignored by the
management while calculating IRR (Gabriel Filho, et. al., 2016).
Investment Analysis
With the initial investment of £30,000,000 million by the company Associated British Food at a
discounted rate of 15% over the period of 10 years, this money will be segregated to new product
line. The company is aiming to invest in the production new product for the company that would
be ‘herbal tea’. Based on the industry analysis, the average industry price of tea in the industry is
£ 20 pound, a volume of 350,000 tea bags, variable price of £ 2450000 total and fixed cost of £
750000 pound.
Below mentioned is the excel screenshot of £ 30,000,000 investment at discounted rate of 12%:
Paraphrase This Document
Need a fresh take? Get an instant paraphrase of this document with our AI Paraphraser

Finance for Decision Making
The NPV of the company ABF at 15% discount rate shows profitability to the company. The
IRR through this type of activity shows 19.36 % of return for the company. Thus, it should be
stated that with this type of investment the company can earn profitability with time (Bornholt
2017).
The NPV of the company ABF at 15% discount rate shows profitability to the company. The
IRR through this type of activity shows 19.36 % of return for the company. Thus, it should be
stated that with this type of investment the company can earn profitability with time (Bornholt
2017).

Finance for Decision Making
Sensitivity Analysis
Investment 30,000,000.00-£
Sales 7,000,000.00£
Varibale cost 2,450,000.00£
Fixed cost 750,000.00£
Pre tax prpfit 3,800,000.00£
Taxes 1,400,000.00£
Profit after taxes 2,400,000.00£
Key variables Pessimistic Expected Optimistic Pessimistic Expected Optimistic
Optimistic
Investment 33,000,000.00£ 30,000,000.00£ 27,000,000.00£ 2.15 2.6 2.86
Sales 6,300,000.00£ 7,000,000.00£ 7,700,000.00£ 2.34 2.6 2.98
Varibale cost 2,205,000.00£ 2,450,000.00£ 2,695,000.00£ 2.22 2.6 2.775
% of sales 0.35£ 0.35£ 0.35£
Fixed cost 675,000.00£ 750,000.00£ 825,000.00£ 2.43 2.6 3.05
Sensitivity Analysis
Sensitivity Analysis
Range NPV
Sensitivity analysis evaluates the ways in which different values of an independent variable
affects the dependent variable of the production under the given set of assumptions. This
technique is used in specific boundations that depend upon one or more input variable like effect
that change the interest rate (independent variable) has on price of bond (dependent variable).
Looking at the sensitivity analysis of the company Associated British Food, it should be noted
that the company is in a condition where change in variables will not affect the efficiency of the
company (Maravas, and Pantouvakis 2018). The sensitivity analysis states that this process of
investment is more optimistic than pessimistic. The ratio significantly represent the expectation
of change is likely to occur less in this investment process. Low degree of sensitivity in the
investment project represents that the company attains a great opportunity of attaining
profitability with low degree of risk in the environment (Iooss, and Lemaître 2015).
Potential Merger and Acquisition
Merger and acquisitions refers to a consolidation of two companies. Basically there is difference
in both the terms as merger is the combination of two companies in forms one whereas, in the
process of acquisition, one company takes over another company. Merger and acquisition is one
Sensitivity Analysis
Investment 30,000,000.00-£
Sales 7,000,000.00£
Varibale cost 2,450,000.00£
Fixed cost 750,000.00£
Pre tax prpfit 3,800,000.00£
Taxes 1,400,000.00£
Profit after taxes 2,400,000.00£
Key variables Pessimistic Expected Optimistic Pessimistic Expected Optimistic
Optimistic
Investment 33,000,000.00£ 30,000,000.00£ 27,000,000.00£ 2.15 2.6 2.86
Sales 6,300,000.00£ 7,000,000.00£ 7,700,000.00£ 2.34 2.6 2.98
Varibale cost 2,205,000.00£ 2,450,000.00£ 2,695,000.00£ 2.22 2.6 2.775
% of sales 0.35£ 0.35£ 0.35£
Fixed cost 675,000.00£ 750,000.00£ 825,000.00£ 2.43 2.6 3.05
Sensitivity Analysis
Sensitivity Analysis
Range NPV
Sensitivity analysis evaluates the ways in which different values of an independent variable
affects the dependent variable of the production under the given set of assumptions. This
technique is used in specific boundations that depend upon one or more input variable like effect
that change the interest rate (independent variable) has on price of bond (dependent variable).
Looking at the sensitivity analysis of the company Associated British Food, it should be noted
that the company is in a condition where change in variables will not affect the efficiency of the
company (Maravas, and Pantouvakis 2018). The sensitivity analysis states that this process of
investment is more optimistic than pessimistic. The ratio significantly represent the expectation
of change is likely to occur less in this investment process. Low degree of sensitivity in the
investment project represents that the company attains a great opportunity of attaining
profitability with low degree of risk in the environment (Iooss, and Lemaître 2015).
Potential Merger and Acquisition
Merger and acquisitions refers to a consolidation of two companies. Basically there is difference
in both the terms as merger is the combination of two companies in forms one whereas, in the
process of acquisition, one company takes over another company. Merger and acquisition is one
⊘ This is a preview!⊘
Do you want full access?
Subscribe today to unlock all pages.
Trusted by 1+ million students worldwide
1 out of 18
Related Documents


Your All-in-One AI-Powered Toolkit for Academic Success.
+13062052269
info@desklib.com
Available 24*7 on WhatsApp / Email
![[object Object]](/_next/static/media/star-bottom.7253800d.svg)
Unlock your academic potential
Copyright © 2020–2026 A2Z Services. All Rights Reserved. Developed and managed by ZUCOL.