Finance Portfolio Management Report: GSK and RB Performance
VerifiedAdded on 2022/09/08
|22
|4277
|21
Report
AI Summary
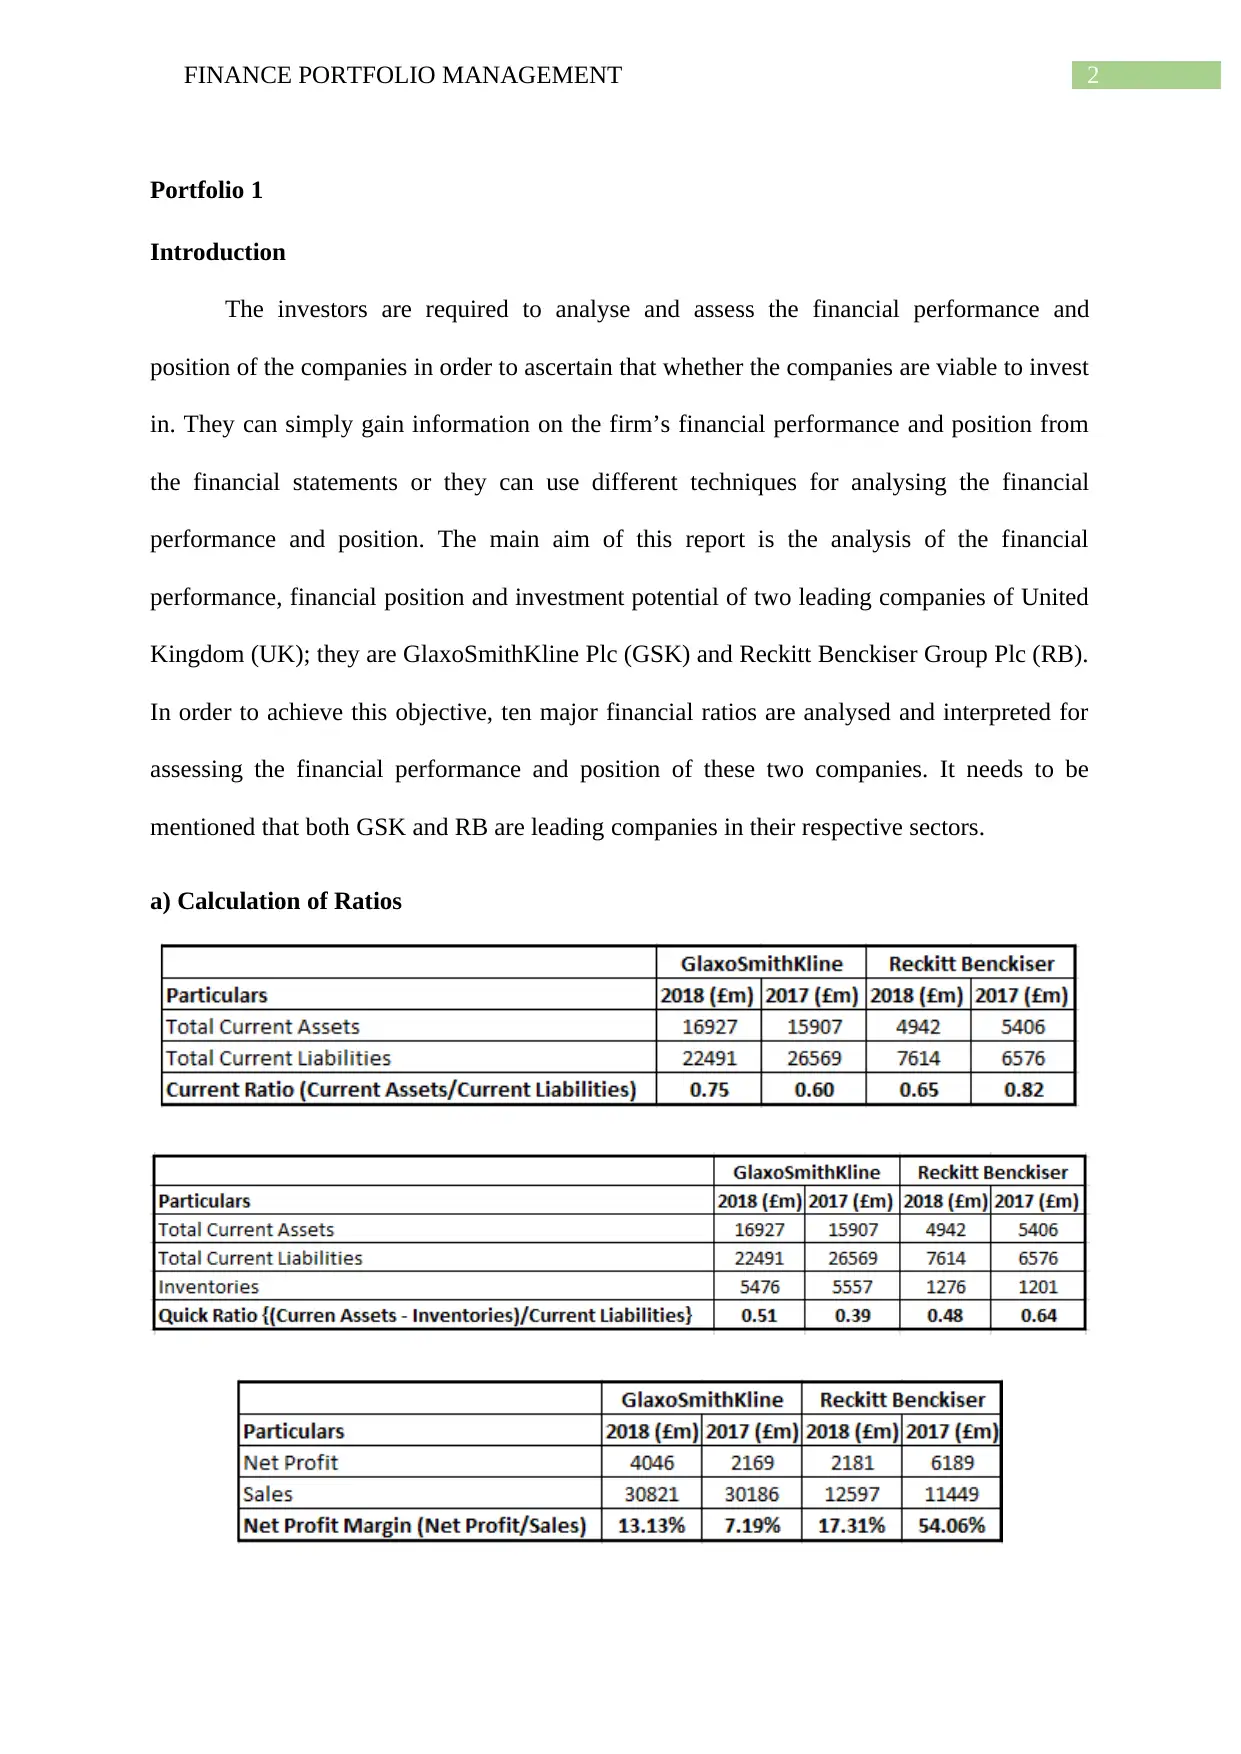
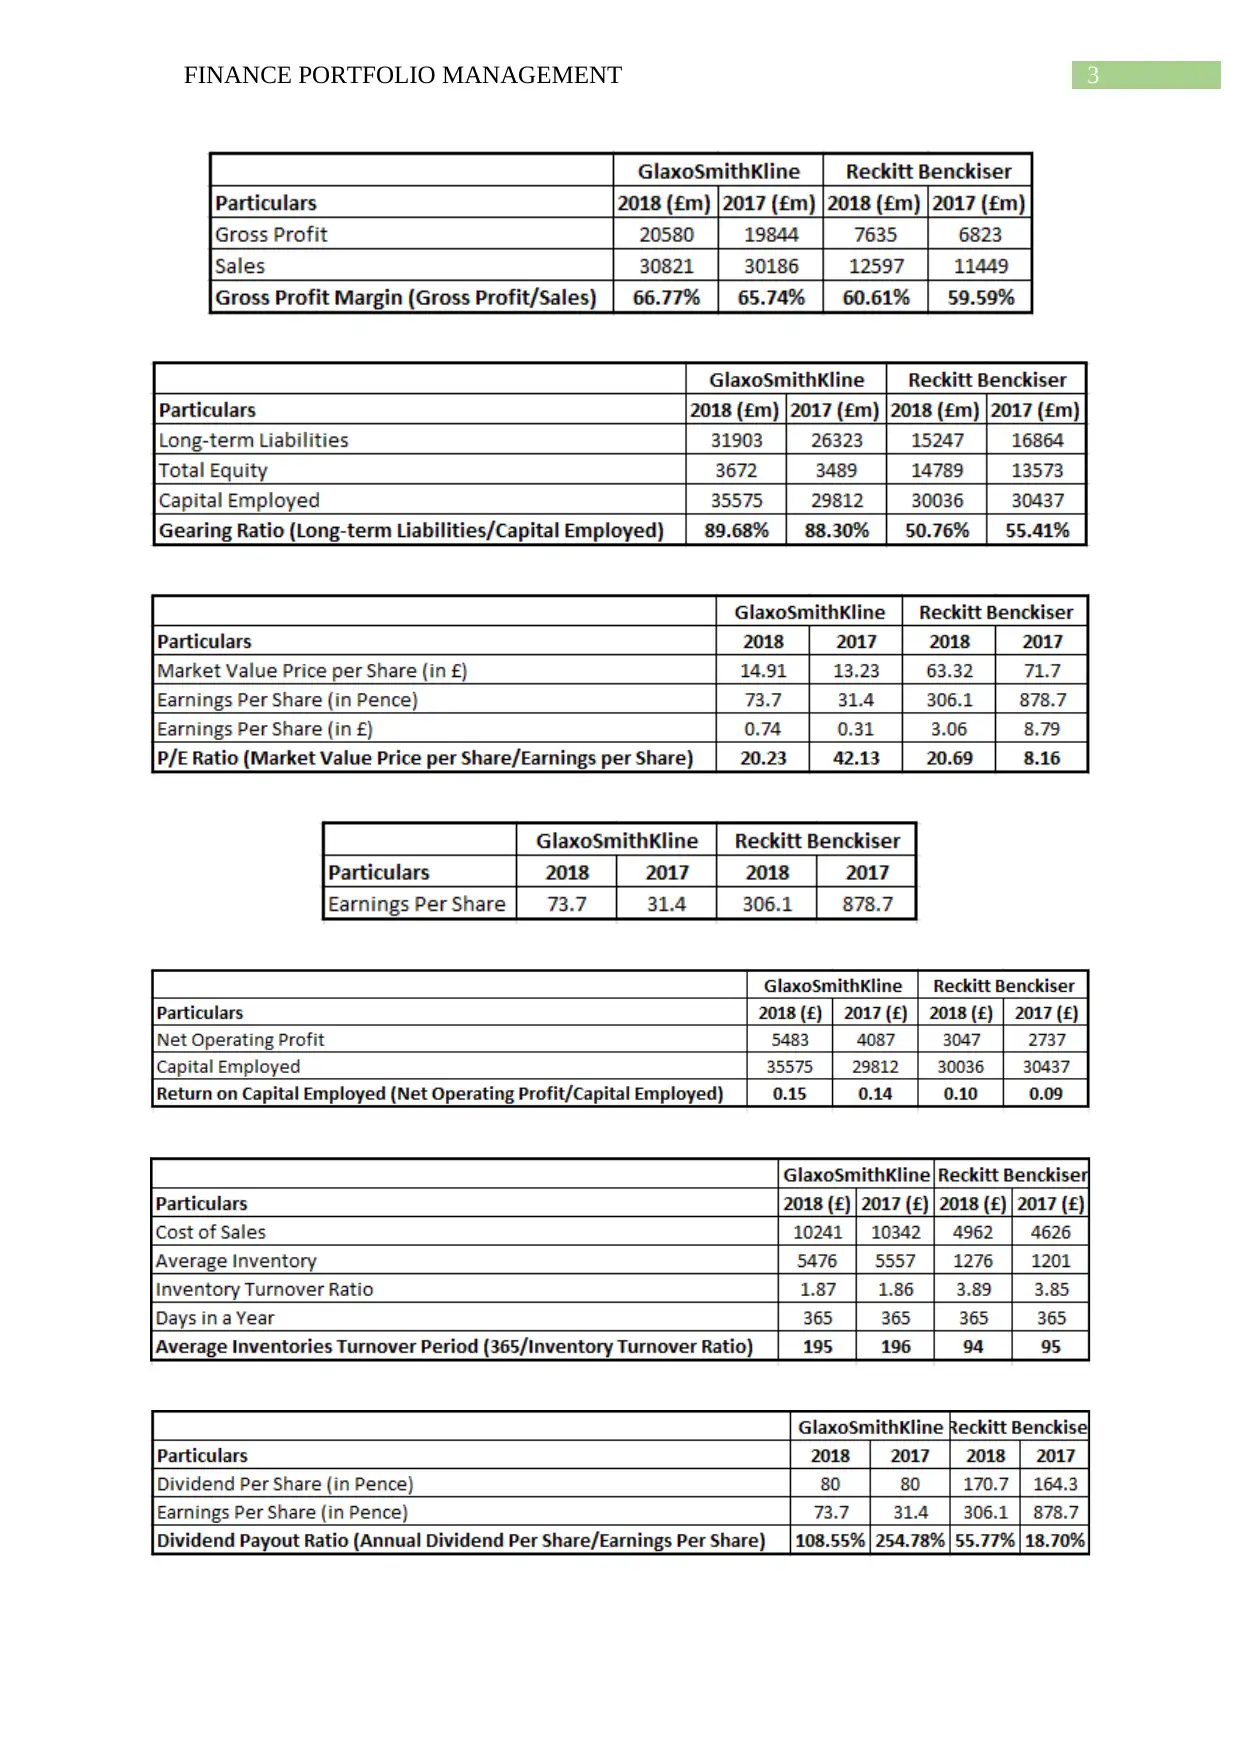
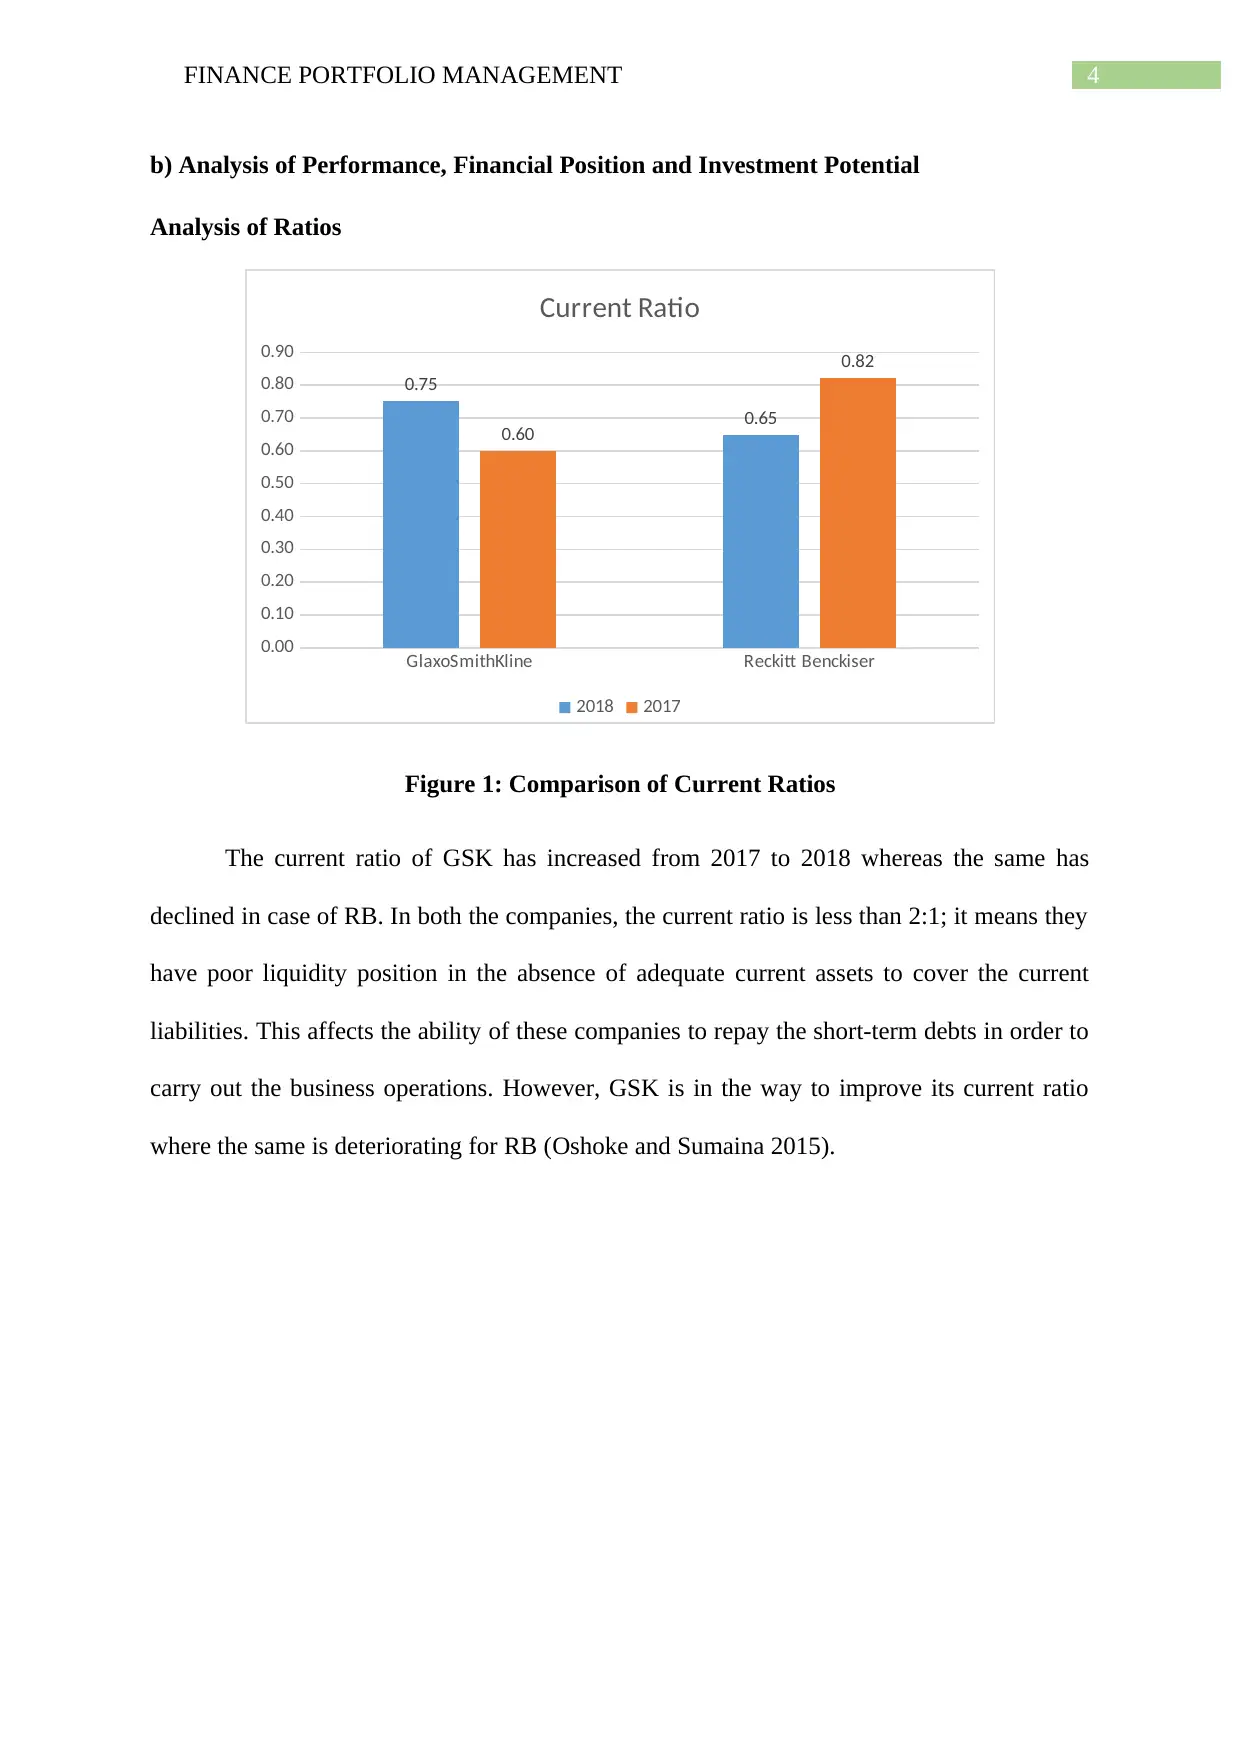
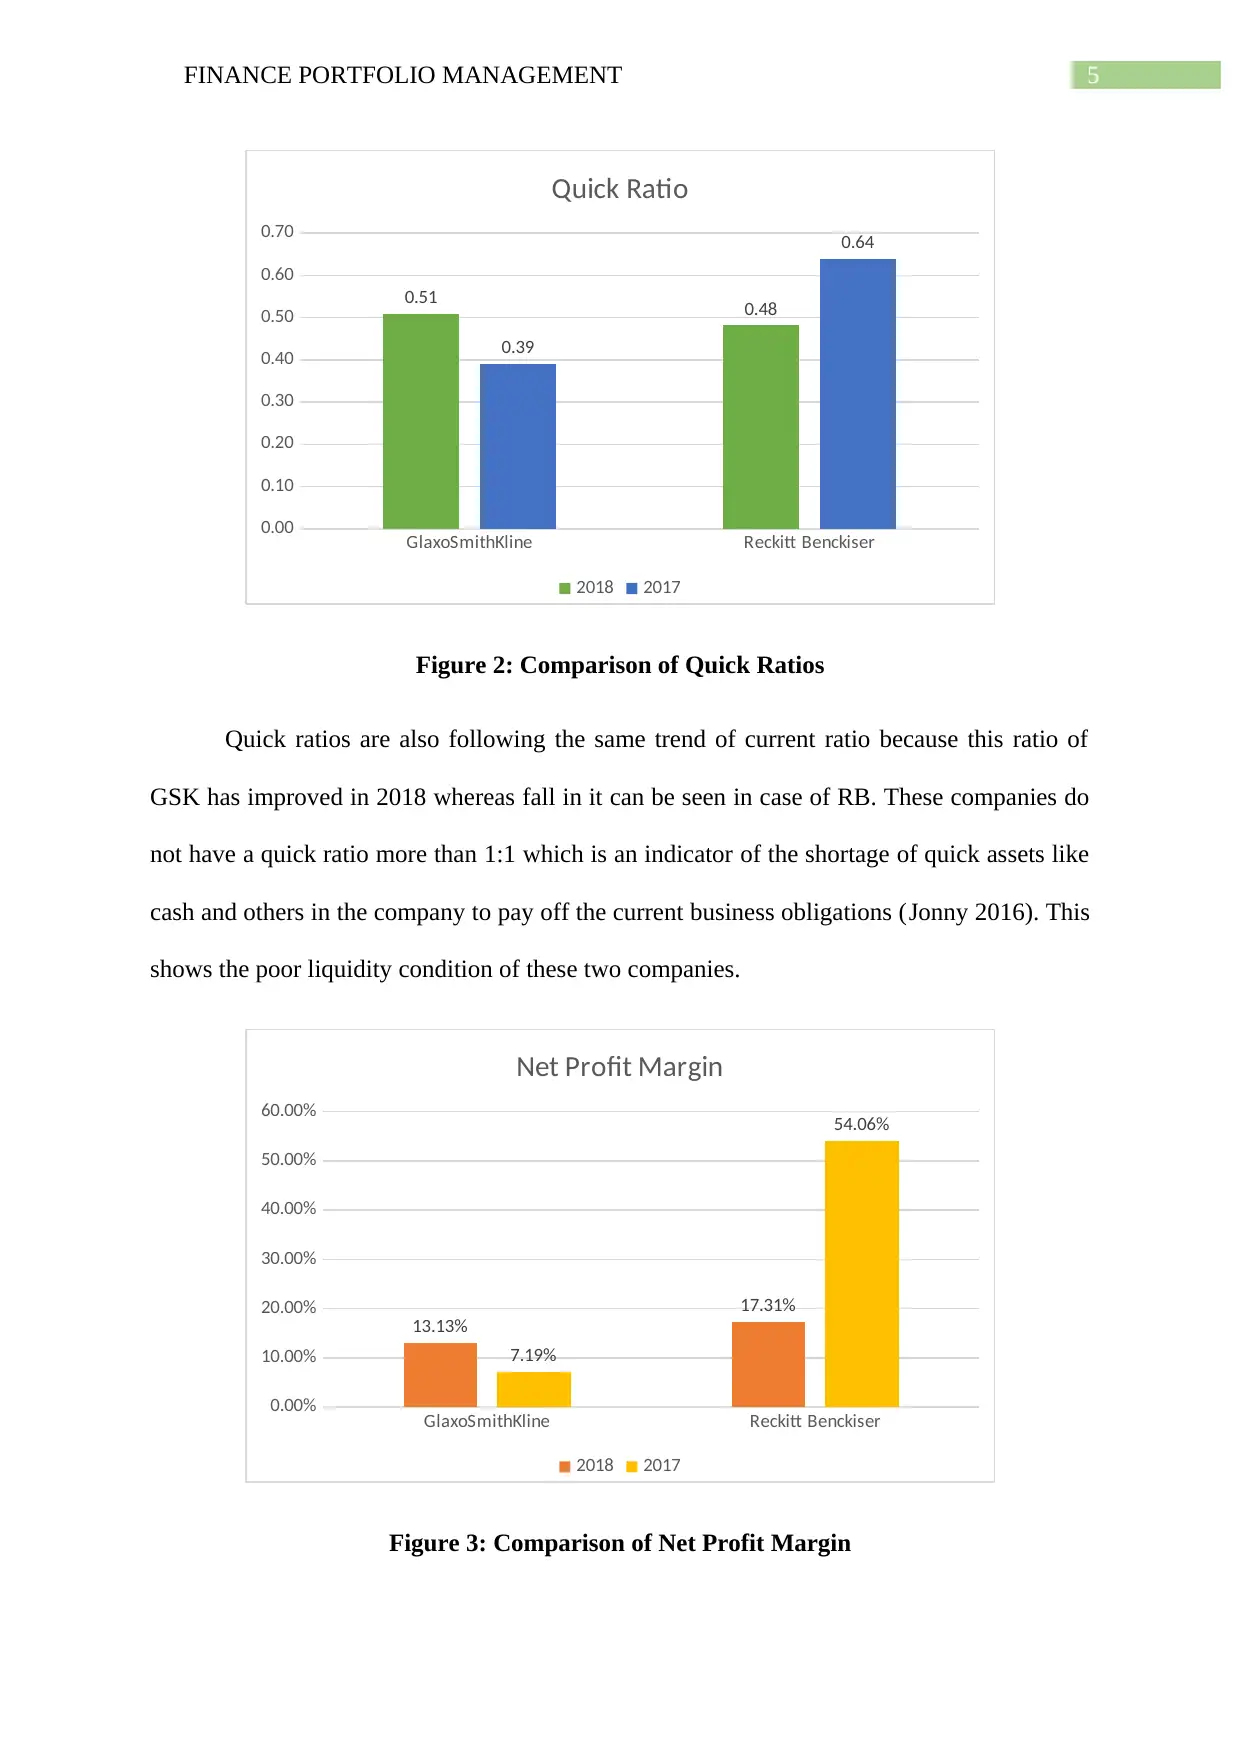
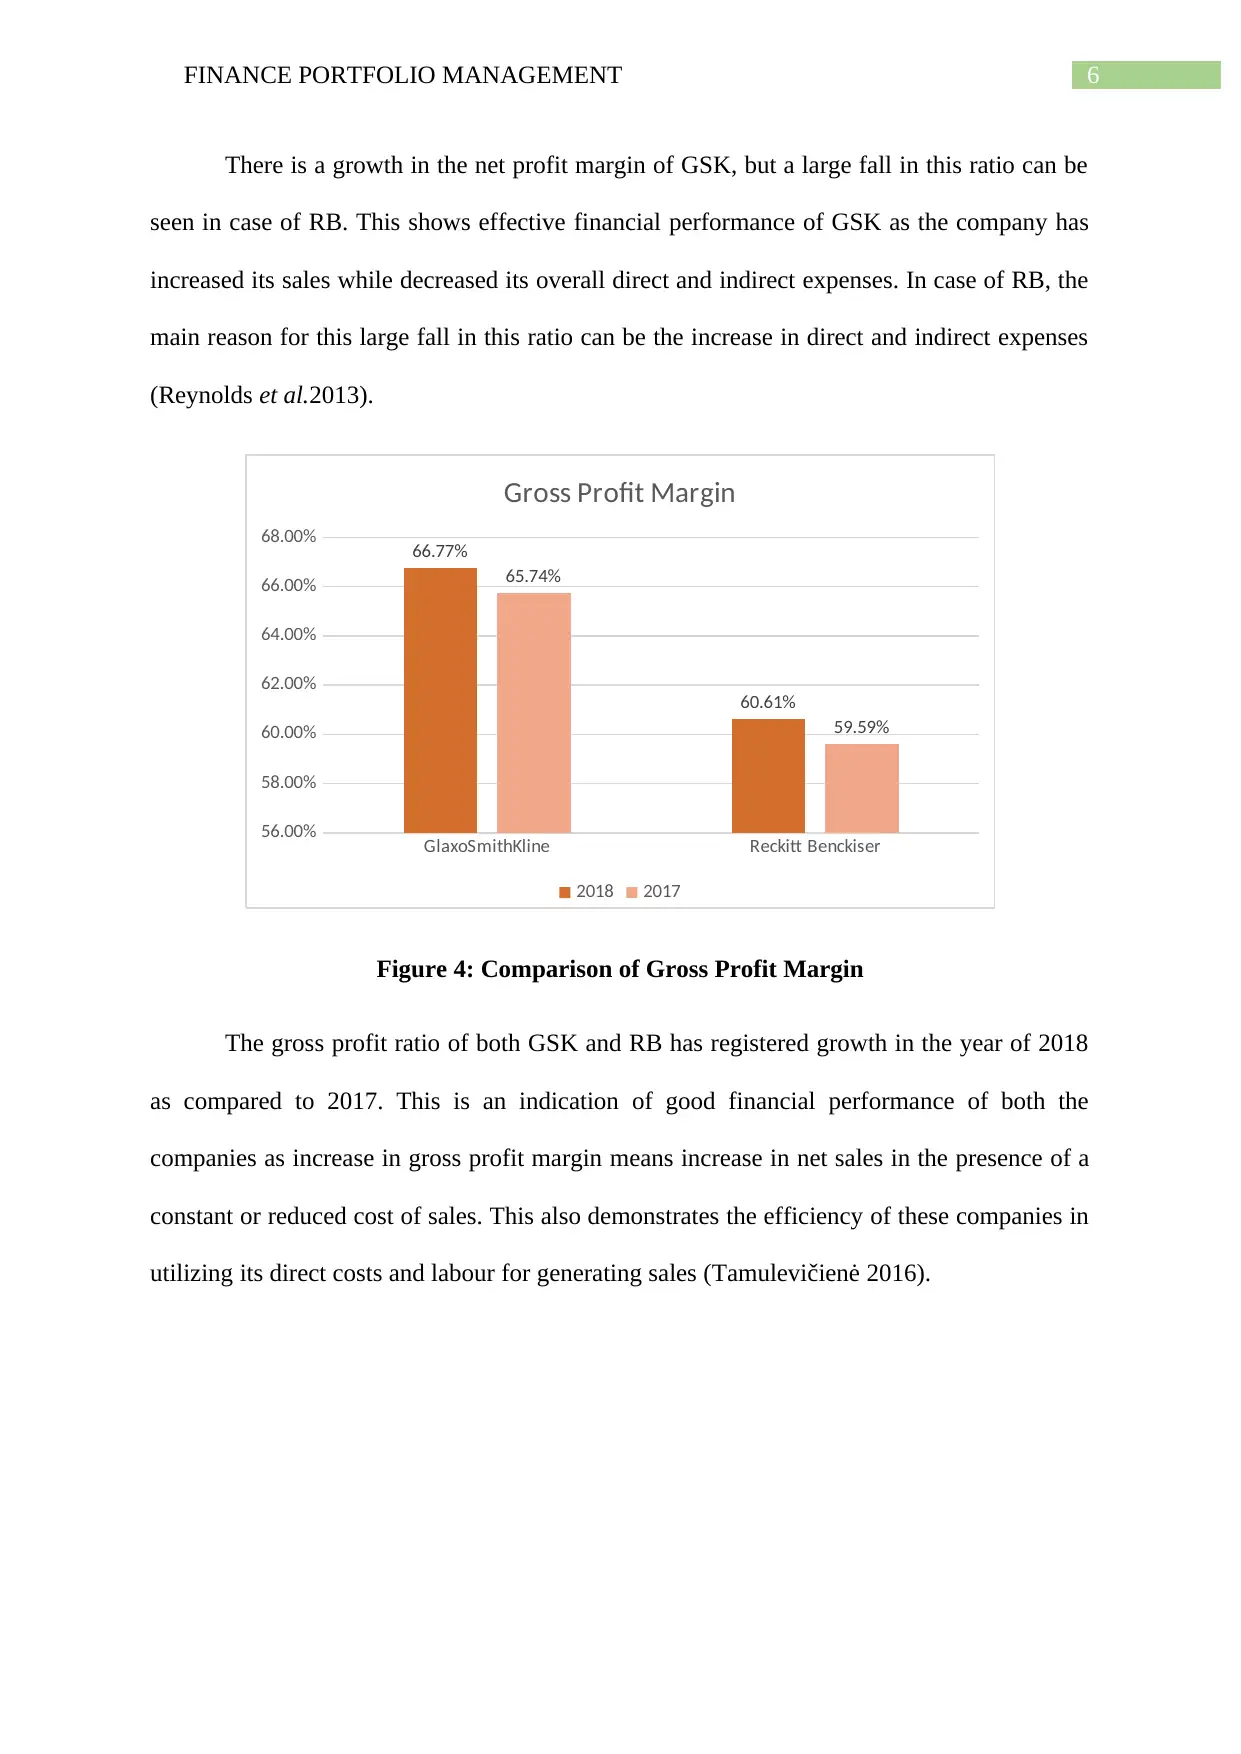
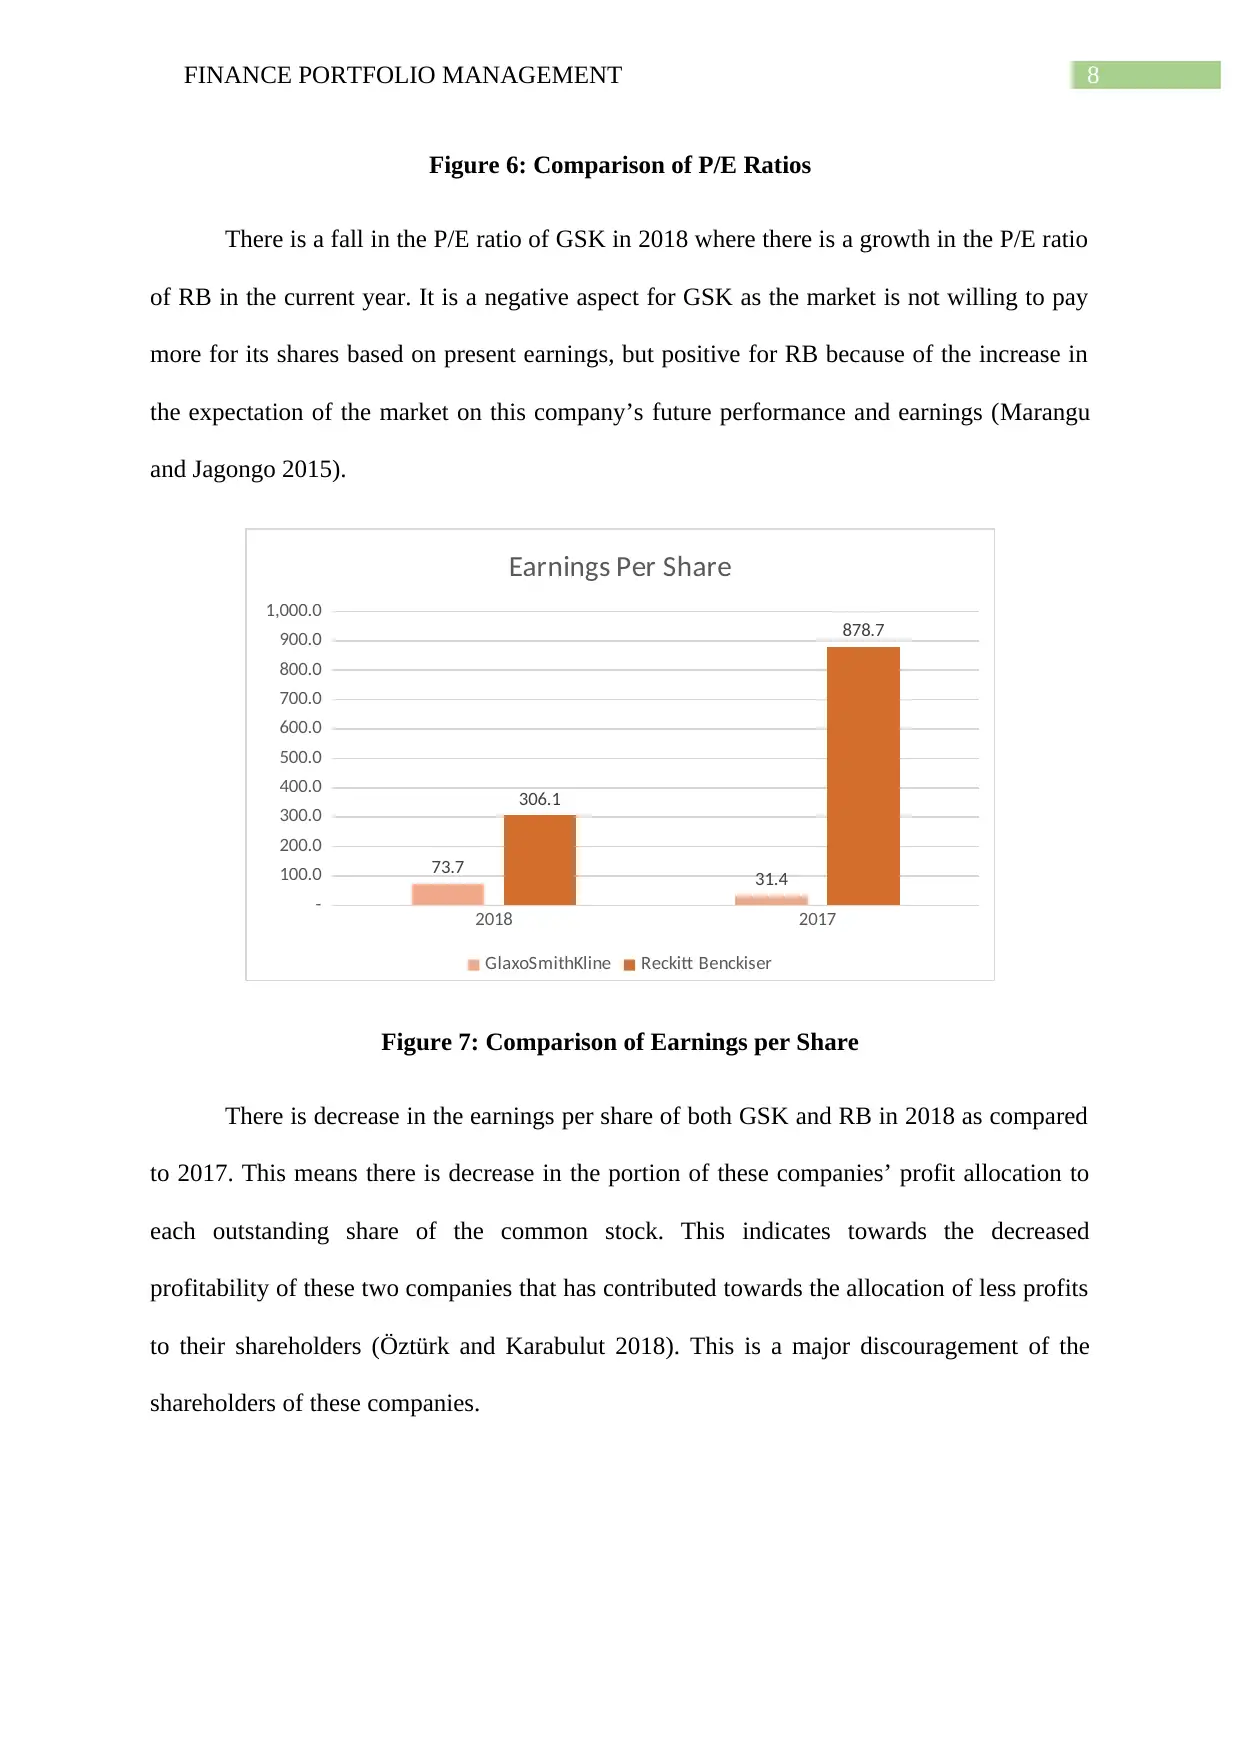
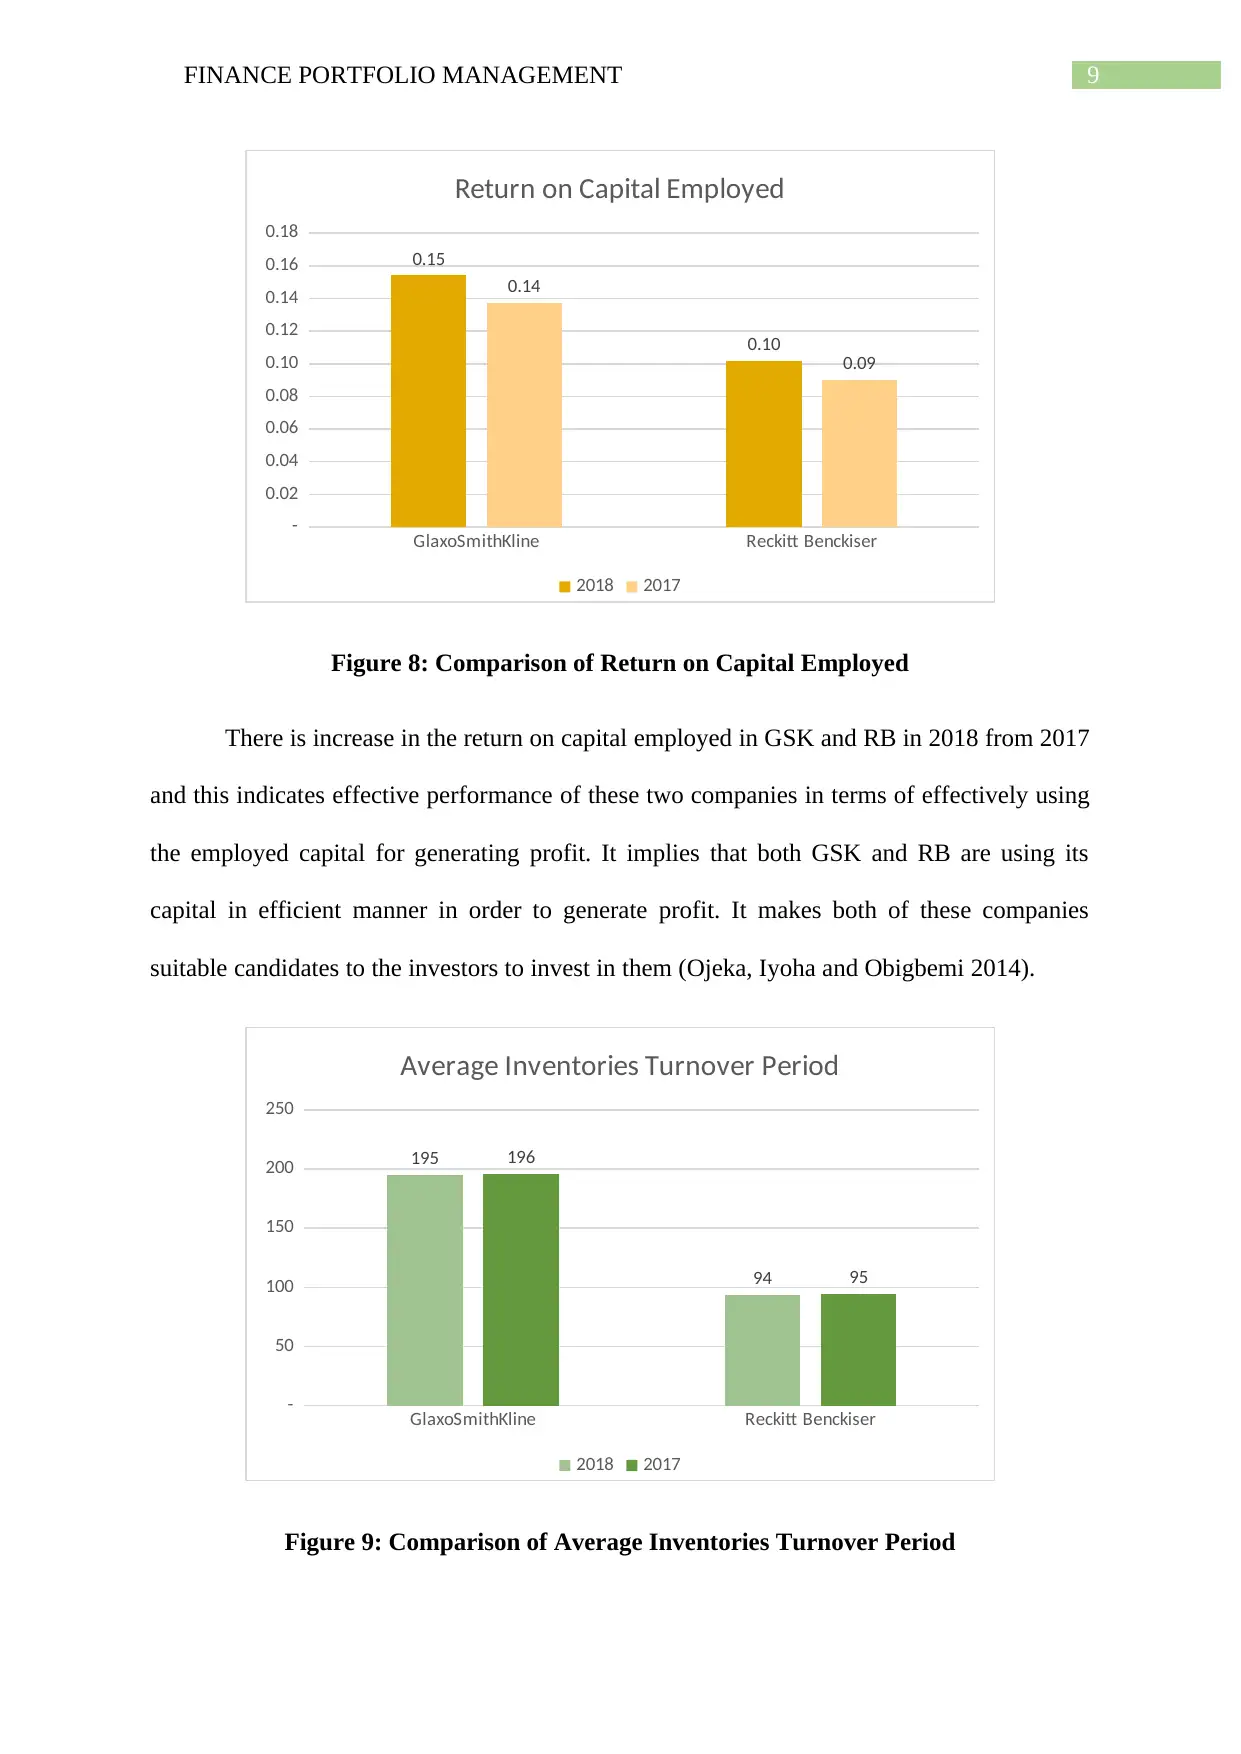
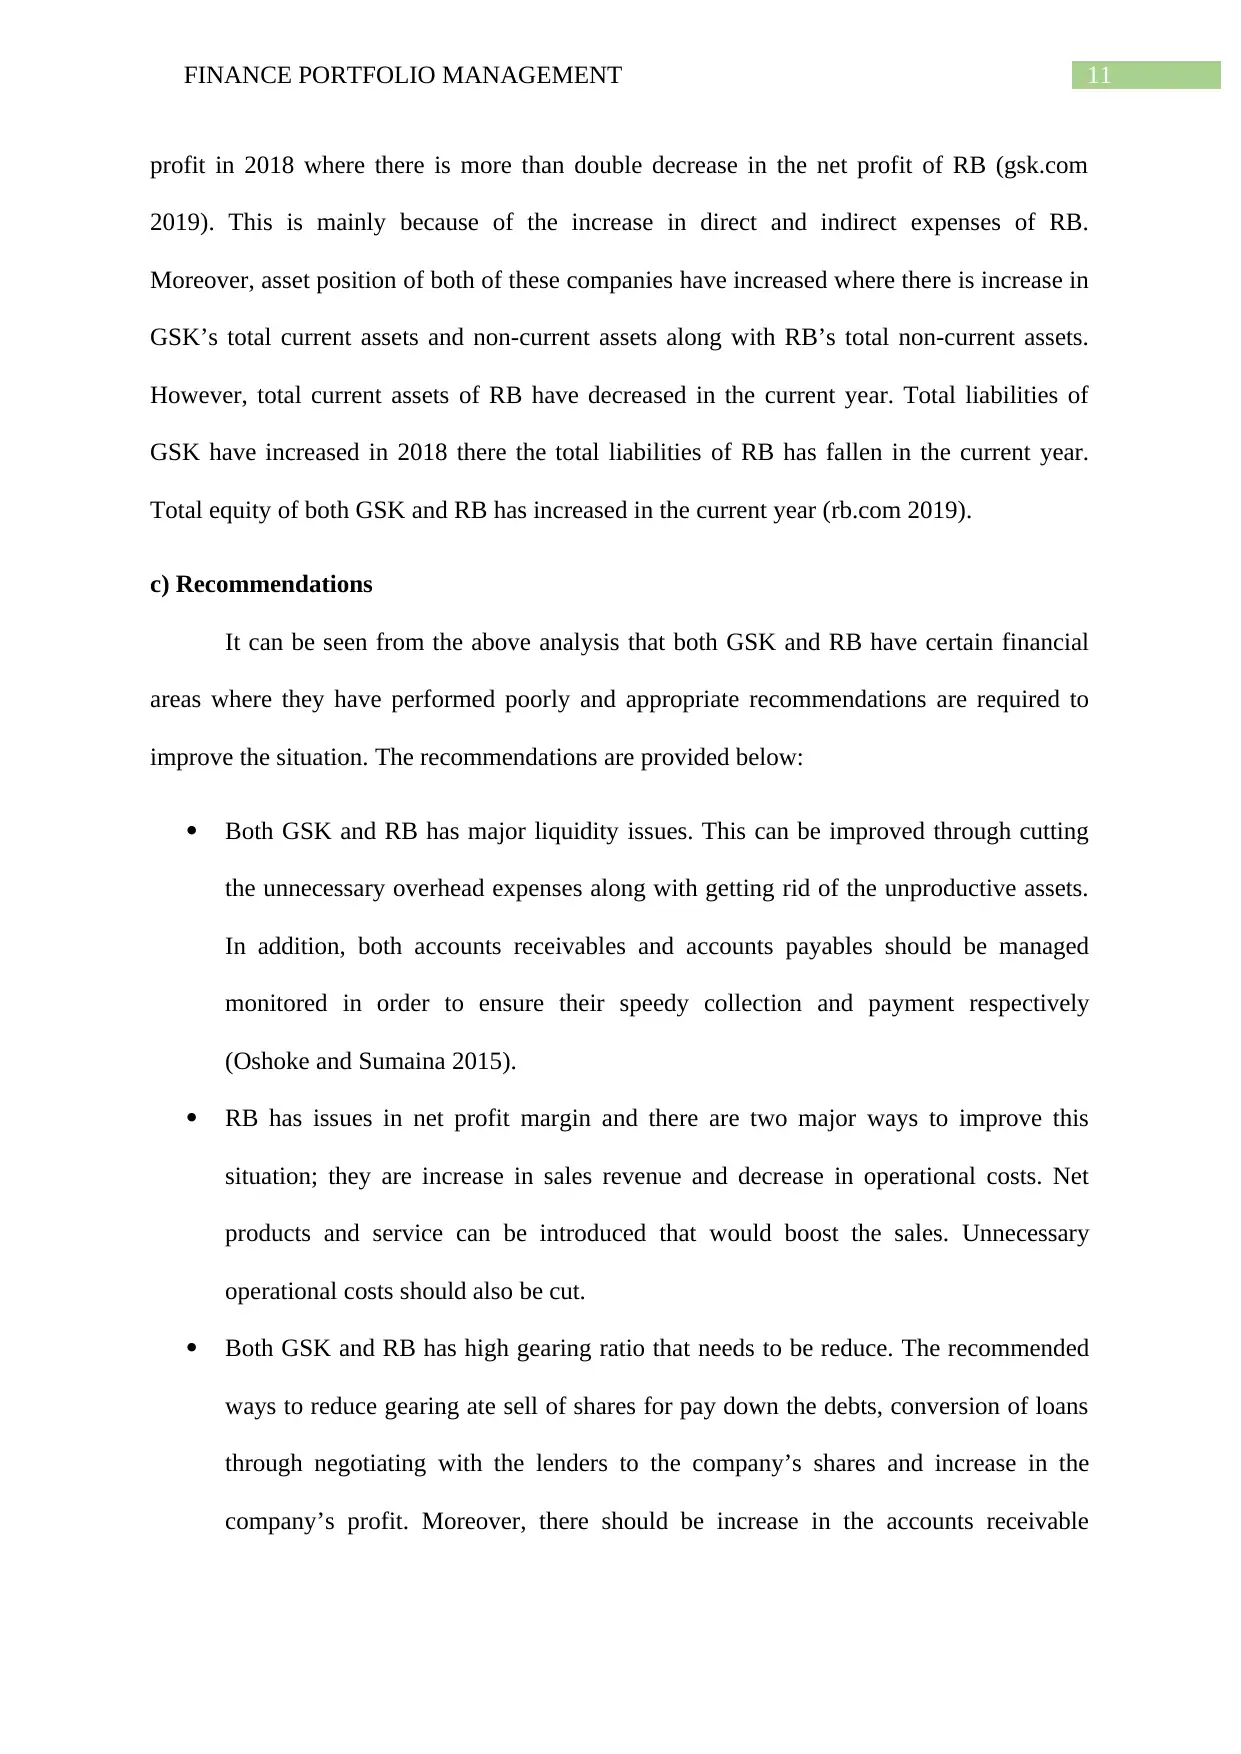
This report provides a comprehensive analysis of the financial performance, financial position, and investment potential of two leading UK companies, GlaxoSmithKline Plc (GSK) and Reckitt Benckiser Group Plc (RB). The analysis involves calculating and interpreting ten major financial ratios to assess liquidity, profitability, and gearing. The report compares the performance of both companies from 2017 to 2018, highlighting trends in current ratios, quick ratios, net profit margin, gross profit margin, gearing ratios, P/E ratios, earnings per share, return on capital employed, average inventories turnover period, and dividend pay-out ratios. Additionally, it reviews audited financial statements and offers recommendations for improvement, focusing on addressing liquidity issues, enhancing net profit margins, reducing gearing ratios, and improving earnings per share. The report also discusses the limitations of relying on financial ratios for company performance interpretation.

Running head: FINANCE PORTFOLIO MANAGEMENT
Finance Portfolio Management
Name of the Student
Name of the University
Author’s Note
Finance Portfolio Management
Name of the Student
Name of the University
Author’s Note
Paraphrase This Document
Need a fresh take? Get an instant paraphrase of this document with our AI Paraphraser

1FINANCE PORTFOLIO MANAGEMENT
Table of Contents
Portfolio 1...................................................................................................................................2
Introduction............................................................................................................................2
a) Calculation of Ratios..........................................................................................................2
b) Analysis of Performance, Financial Position and Investment Potential............................4
Analysis of Ratios..............................................................................................................4
Analysis of Audited Financial Statements.......................................................................10
c) Recommendations............................................................................................................11
d) Limitations of Relying on Financial Ratios to Interpret Company’s Performance.........12
Conclusion............................................................................................................................13
Portfolio 2.................................................................................................................................15
a) Advise to the Senior Management on the Selection of Project........................................15
b) Limitations of Investment Appraisal Techniques in Long-Term Decision Making........17
References................................................................................................................................19

2FINANCE PORTFOLIO MANAGEMENT
Portfolio 1
Introduction
The investors are required to analyse and assess the financial performance and
position of the companies in order to ascertain that whether the companies are viable to invest
in. They can simply gain information on the firm’s financial performance and position from
the financial statements or they can use different techniques for analysing the financial
performance and position. The main aim of this report is the analysis of the financial
performance, financial position and investment potential of two leading companies of United
Kingdom (UK); they are GlaxoSmithKline Plc (GSK) and Reckitt Benckiser Group Plc (RB).
In order to achieve this objective, ten major financial ratios are analysed and interpreted for
assessing the financial performance and position of these two companies. It needs to be
mentioned that both GSK and RB are leading companies in their respective sectors.
a) Calculation of Ratios
⊘ This is a preview!⊘
Do you want full access?
Subscribe today to unlock all pages.

Trusted by 1+ million students worldwide

3FINANCE PORTFOLIO MANAGEMENT
Paraphrase This Document
Need a fresh take? Get an instant paraphrase of this document with our AI Paraphraser

4FINANCE PORTFOLIO MANAGEMENT
b) Analysis of Performance, Financial Position and Investment Potential
Analysis of Ratios
GlaxoSmithKline Reckitt Benckiser
0.00
0.10
0.20
0.30
0.40
0.50
0.60
0.70
0.80
0.90
0.75
0.65
0.60
0.82
Current Ratio
2018 2017
Figure 1: Comparison of Current Ratios
The current ratio of GSK has increased from 2017 to 2018 whereas the same has
declined in case of RB. In both the companies, the current ratio is less than 2:1; it means they
have poor liquidity position in the absence of adequate current assets to cover the current
liabilities. This affects the ability of these companies to repay the short-term debts in order to
carry out the business operations. However, GSK is in the way to improve its current ratio
where the same is deteriorating for RB (Oshoke and Sumaina 2015).

5FINANCE PORTFOLIO MANAGEMENT
GlaxoSmithKline Reckitt Benckiser
0.00
0.10
0.20
0.30
0.40
0.50
0.60
0.70
0.51 0.48
0.39
0.64
Quick Ratio
2018 2017
Figure 2: Comparison of Quick Ratios
Quick ratios are also following the same trend of current ratio because this ratio of
GSK has improved in 2018 whereas fall in it can be seen in case of RB. These companies do
not have a quick ratio more than 1:1 which is an indicator of the shortage of quick assets like
cash and others in the company to pay off the current business obligations (Jonny 2016). This
shows the poor liquidity condition of these two companies.
GlaxoSmithKline Reckitt Benckiser
0.00%
10.00%
20.00%
30.00%
40.00%
50.00%
60.00%
13.13%
17.31%
7.19%
54.06%
Net Profit Margin
2018 2017
Figure 3: Comparison of Net Profit Margin
GlaxoSmithKline Reckitt Benckiser
0.00
0.10
0.20
0.30
0.40
0.50
0.60
0.70
0.51 0.48
0.39
0.64
Quick Ratio
2018 2017
Figure 2: Comparison of Quick Ratios
Quick ratios are also following the same trend of current ratio because this ratio of
GSK has improved in 2018 whereas fall in it can be seen in case of RB. These companies do
not have a quick ratio more than 1:1 which is an indicator of the shortage of quick assets like
cash and others in the company to pay off the current business obligations (Jonny 2016). This
shows the poor liquidity condition of these two companies.
GlaxoSmithKline Reckitt Benckiser
0.00%
10.00%
20.00%
30.00%
40.00%
50.00%
60.00%
13.13%
17.31%
7.19%
54.06%
Net Profit Margin
2018 2017
Figure 3: Comparison of Net Profit Margin
⊘ This is a preview!⊘
Do you want full access?
Subscribe today to unlock all pages.

Trusted by 1+ million students worldwide

6FINANCE PORTFOLIO MANAGEMENT
There is a growth in the net profit margin of GSK, but a large fall in this ratio can be
seen in case of RB. This shows effective financial performance of GSK as the company has
increased its sales while decreased its overall direct and indirect expenses. In case of RB, the
main reason for this large fall in this ratio can be the increase in direct and indirect expenses
(Reynolds et al.2013).
GlaxoSmithKline Reckitt Benckiser
56.00%
58.00%
60.00%
62.00%
64.00%
66.00%
68.00% 66.77%
60.61%
65.74%
59.59%
Gross Profit Margin
2018 2017
Figure 4: Comparison of Gross Profit Margin
The gross profit ratio of both GSK and RB has registered growth in the year of 2018
as compared to 2017. This is an indication of good financial performance of both the
companies as increase in gross profit margin means increase in net sales in the presence of a
constant or reduced cost of sales. This also demonstrates the efficiency of these companies in
utilizing its direct costs and labour for generating sales (Tamulevičienė 2016).
Paraphrase This Document
Need a fresh take? Get an instant paraphrase of this document with our AI Paraphraser

7FINANCE PORTFOLIO MANAGEMENT
GlaxoSmithKline Reckitt Benckiser
0.00%
10.00%
20.00%
30.00%
40.00%
50.00%
60.00%
70.00%
80.00%
90.00%
100.00% 89.68%
50.76%
88.30%
55.41%
Gearing Ratio
2018 2017
Figure 5: Comparison of Gearing Ratios
There is a minor increase in the gearing ratio of GSK in 2018, but the same ratio of
RB has witnessed a fall in 2018 as compared to 2017. In both these companies, this ratio is
more than 50% that makes these companies highly geared. It means the proportion of finance
provided by debt is higher than that of equity which exposed these companies to higher risks
as the payment of interest and repayment of debt are mandatory unlike payment of dividends
(Yapa Abeywardhana 2015).
GlaxoSmithKline Reckitt Benckiser
-
5.00
10.00
15.00
20.00
25.00
30.00
35.00
40.00
45.00
20.23 20.69
42.13
8.16
P/E Ratio
2018 2017
GlaxoSmithKline Reckitt Benckiser
0.00%
10.00%
20.00%
30.00%
40.00%
50.00%
60.00%
70.00%
80.00%
90.00%
100.00% 89.68%
50.76%
88.30%
55.41%
Gearing Ratio
2018 2017
Figure 5: Comparison of Gearing Ratios
There is a minor increase in the gearing ratio of GSK in 2018, but the same ratio of
RB has witnessed a fall in 2018 as compared to 2017. In both these companies, this ratio is
more than 50% that makes these companies highly geared. It means the proportion of finance
provided by debt is higher than that of equity which exposed these companies to higher risks
as the payment of interest and repayment of debt are mandatory unlike payment of dividends
(Yapa Abeywardhana 2015).
GlaxoSmithKline Reckitt Benckiser
-
5.00
10.00
15.00
20.00
25.00
30.00
35.00
40.00
45.00
20.23 20.69
42.13
8.16
P/E Ratio
2018 2017

8FINANCE PORTFOLIO MANAGEMENT
Figure 6: Comparison of P/E Ratios
There is a fall in the P/E ratio of GSK in 2018 where there is a growth in the P/E ratio
of RB in the current year. It is a negative aspect for GSK as the market is not willing to pay
more for its shares based on present earnings, but positive for RB because of the increase in
the expectation of the market on this company’s future performance and earnings (Marangu
and Jagongo 2015).
2018 2017
-
100.0
200.0
300.0
400.0
500.0
600.0
700.0
800.0
900.0
1,000.0
73.7 31.4
306.1
878.7
Earnings Per Share
GlaxoSmithKline Reckitt Benckiser
Figure 7: Comparison of Earnings per Share
There is decrease in the earnings per share of both GSK and RB in 2018 as compared
to 2017. This means there is decrease in the portion of these companies’ profit allocation to
each outstanding share of the common stock. This indicates towards the decreased
profitability of these two companies that has contributed towards the allocation of less profits
to their shareholders (Öztürk and Karabulut 2018). This is a major discouragement of the
shareholders of these companies.
⊘ This is a preview!⊘
Do you want full access?
Subscribe today to unlock all pages.

Trusted by 1+ million students worldwide

9FINANCE PORTFOLIO MANAGEMENT
GlaxoSmithKline Reckitt Benckiser
-
0.02
0.04
0.06
0.08
0.10
0.12
0.14
0.16
0.18
0.15
0.10
0.14
0.09
Return on Capital Employed
2018 2017
Figure 8: Comparison of Return on Capital Employed
There is increase in the return on capital employed in GSK and RB in 2018 from 2017
and this indicates effective performance of these two companies in terms of effectively using
the employed capital for generating profit. It implies that both GSK and RB are using its
capital in efficient manner in order to generate profit. It makes both of these companies
suitable candidates to the investors to invest in them (Ojeka, Iyoha and Obigbemi 2014).
GlaxoSmithKline Reckitt Benckiser
-
50
100
150
200
250
195
94
196
95
Average Inventories Turnover Period
2018 2017
Figure 9: Comparison of Average Inventories Turnover Period
GlaxoSmithKline Reckitt Benckiser
-
0.02
0.04
0.06
0.08
0.10
0.12
0.14
0.16
0.18
0.15
0.10
0.14
0.09
Return on Capital Employed
2018 2017
Figure 8: Comparison of Return on Capital Employed
There is increase in the return on capital employed in GSK and RB in 2018 from 2017
and this indicates effective performance of these two companies in terms of effectively using
the employed capital for generating profit. It implies that both GSK and RB are using its
capital in efficient manner in order to generate profit. It makes both of these companies
suitable candidates to the investors to invest in them (Ojeka, Iyoha and Obigbemi 2014).
GlaxoSmithKline Reckitt Benckiser
-
50
100
150
200
250
195
94
196
95
Average Inventories Turnover Period
2018 2017
Figure 9: Comparison of Average Inventories Turnover Period
Paraphrase This Document
Need a fresh take? Get an instant paraphrase of this document with our AI Paraphraser

10FINANCE PORTFOLIO MANAGEMENT
Minor decrease in the average inventories turnover period can be seen in GSK and RB in
2018 as compared to 2017. However, the average inventories turnover period of RB is less
than that of GSK. This is a good indicator for RB because this means RB takes less time to
clear its inventory averagely in a year as compared to GSK (Grubor, Milicevic and Mijic
2013). This indicates towards the potential issues in the inventory management mechanism in
GSK.
GlaxoSmithKline Reckitt Benckiser
0.00%
50.00%
100.00%
150.00%
200.00%
250.00%
300.00%
108.55%
55.77%
254.78%
18.70%
Dividend Payout Ratio
2018 2017
Figure 10: Comparison of Dividend Pay-out Ratios
The dividend pay-out ratio of GSK has decreased in 2018 from 2017; but the same
has increased has increased in case of RB in the current year. In case of GSK, this fall in this
ratio is an alarming sign for the investors as this signifies that the company cannot afford to
pay such dividend. However, growth in this ratio is a positive aspect for the performance of
RB as this indicates the increase in dividend payment by the company (Ahmed 2015).
Analysis of Audited Financial Statements
The examination of the audited financial statements of both GSK and RB shows the
increase in sales of these two companies and decrease in cost of sales which contributes to the
increase in gross profit for both the companies. However, GSK has almost doubled its net

11FINANCE PORTFOLIO MANAGEMENT
profit in 2018 where there is more than double decrease in the net profit of RB (gsk.com
2019). This is mainly because of the increase in direct and indirect expenses of RB.
Moreover, asset position of both of these companies have increased where there is increase in
GSK’s total current assets and non-current assets along with RB’s total non-current assets.
However, total current assets of RB have decreased in the current year. Total liabilities of
GSK have increased in 2018 there the total liabilities of RB has fallen in the current year.
Total equity of both GSK and RB has increased in the current year (rb.com 2019).
c) Recommendations
It can be seen from the above analysis that both GSK and RB have certain financial
areas where they have performed poorly and appropriate recommendations are required to
improve the situation. The recommendations are provided below:
Both GSK and RB has major liquidity issues. This can be improved through cutting
the unnecessary overhead expenses along with getting rid of the unproductive assets.
In addition, both accounts receivables and accounts payables should be managed
monitored in order to ensure their speedy collection and payment respectively
(Oshoke and Sumaina 2015).
RB has issues in net profit margin and there are two major ways to improve this
situation; they are increase in sales revenue and decrease in operational costs. Net
products and service can be introduced that would boost the sales. Unnecessary
operational costs should also be cut.
Both GSK and RB has high gearing ratio that needs to be reduce. The recommended
ways to reduce gearing ate sell of shares for pay down the debts, conversion of loans
through negotiating with the lenders to the company’s shares and increase in the
company’s profit. Moreover, there should be increase in the accounts receivable
⊘ This is a preview!⊘
Do you want full access?
Subscribe today to unlock all pages.

Trusted by 1+ million students worldwide
1 out of 22
Related Documents

Your All-in-One AI-Powered Toolkit for Academic Success.
+13062052269
info@desklib.com
Available 24*7 on WhatsApp / Email
Unlock your academic potential
Copyright © 2020–2025 A2Z Services. All Rights Reserved. Developed and managed by ZUCOL.