FINANCE 12: Depreciation, Inventory, Intangibles Analysis Report

Verified

Added on  2020/03/02

|12
|2062
|89
Report
AI Summary
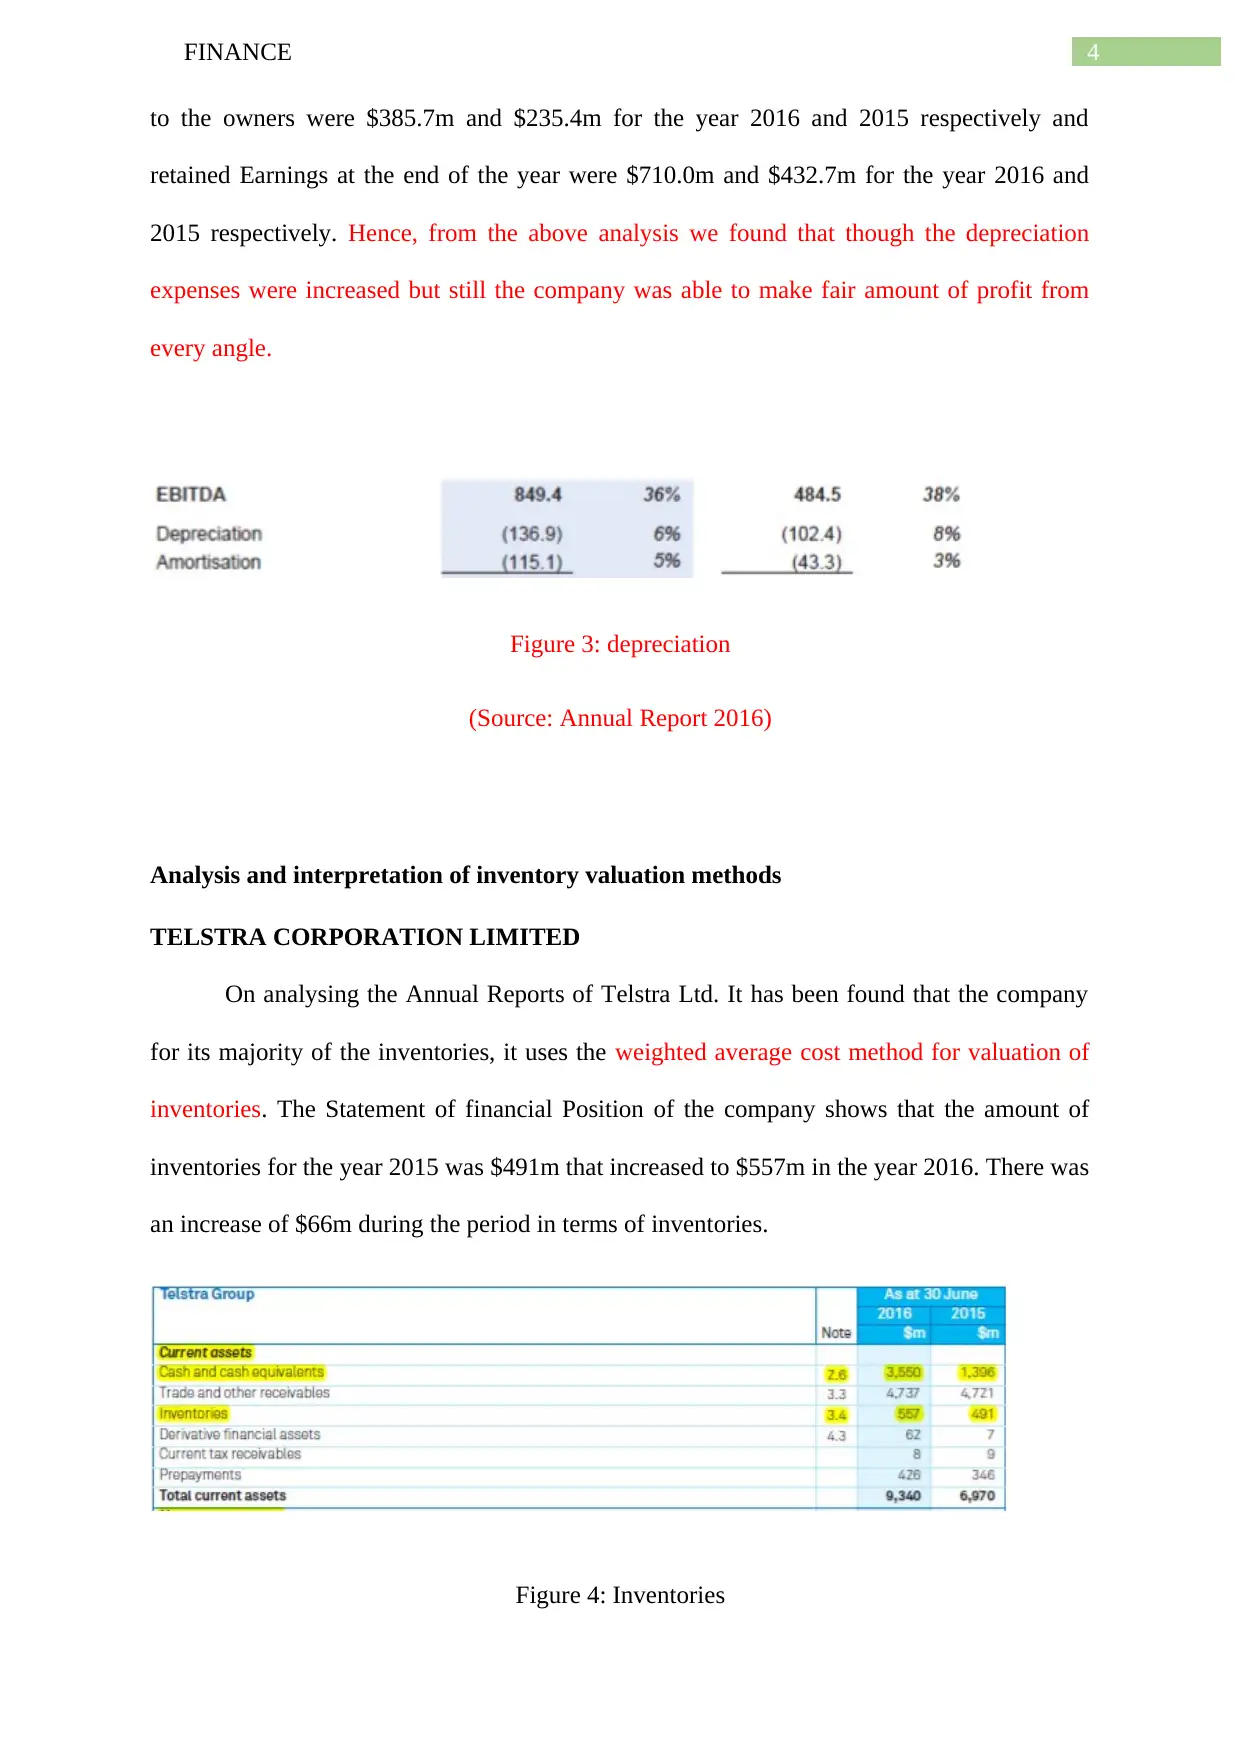
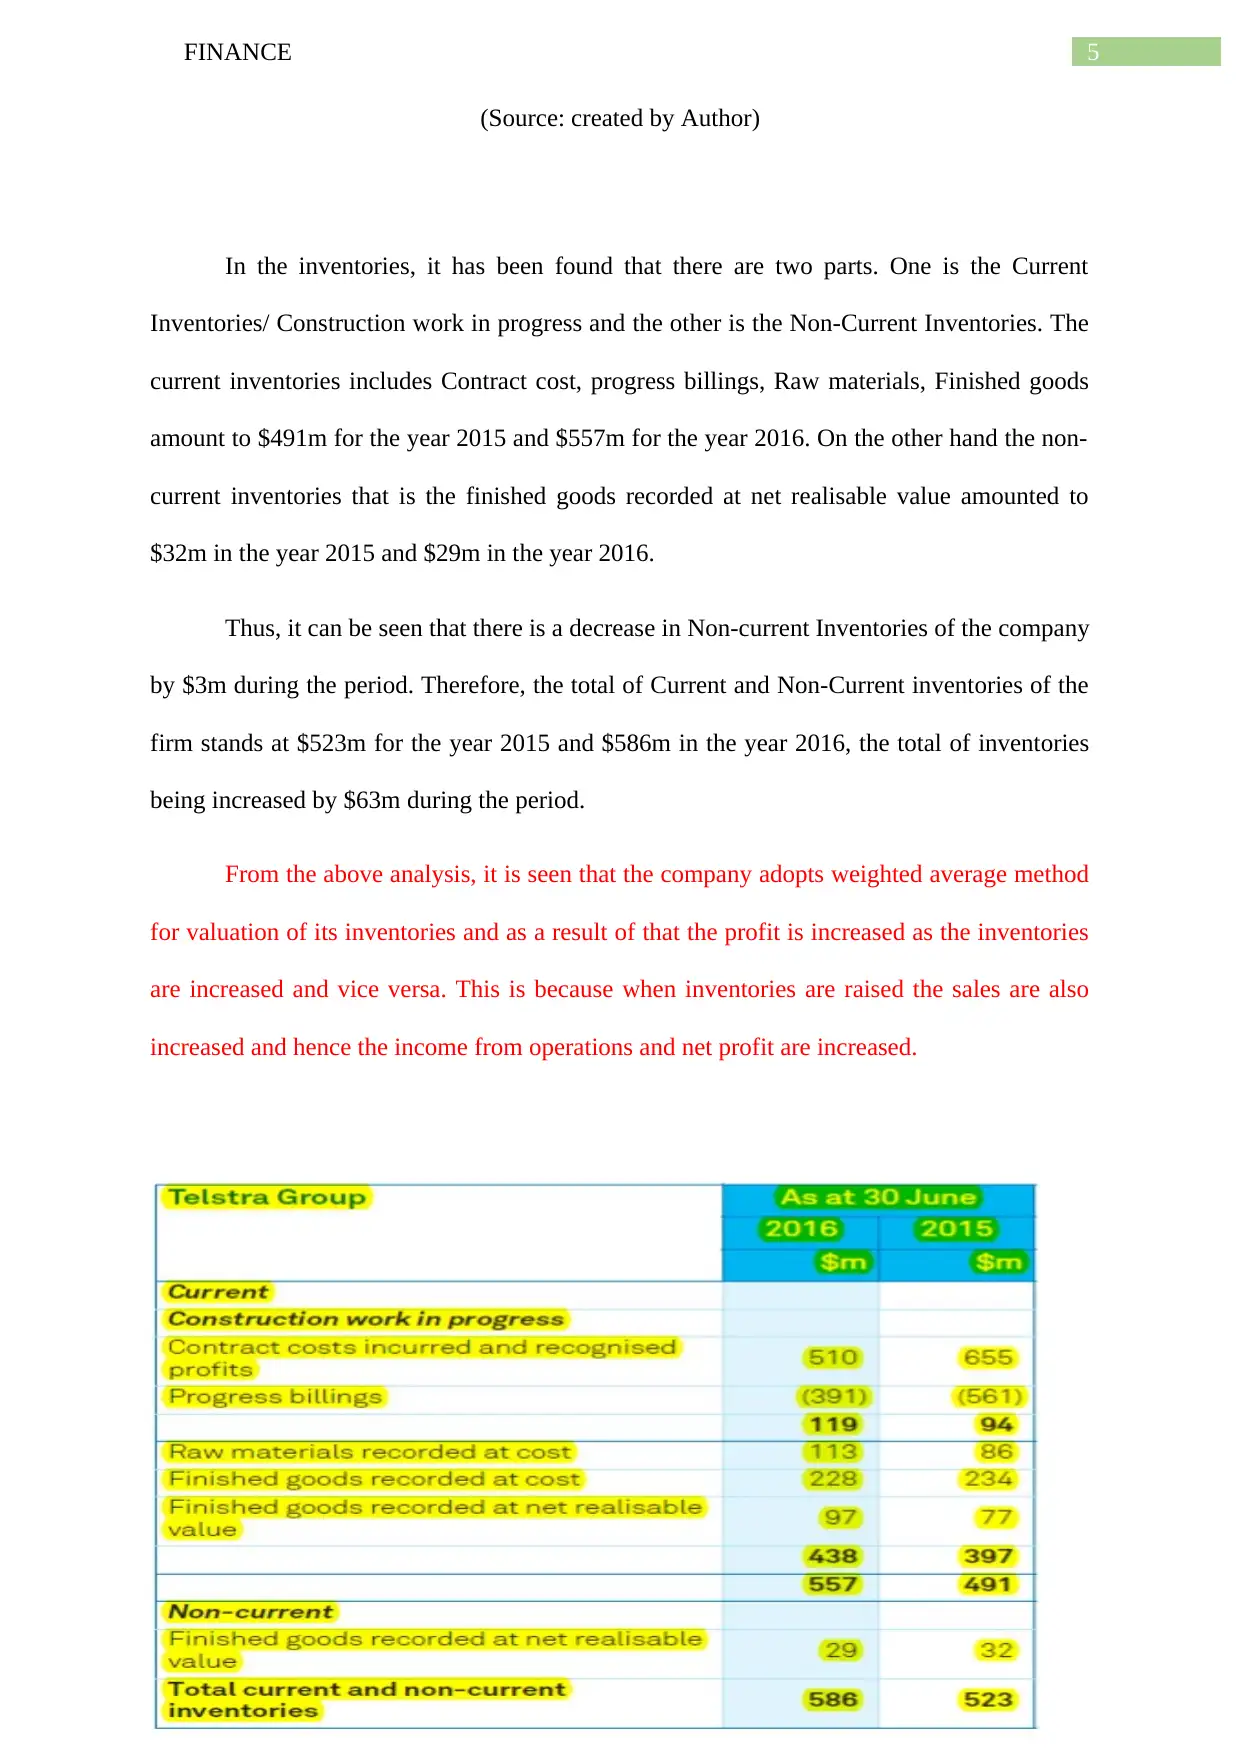
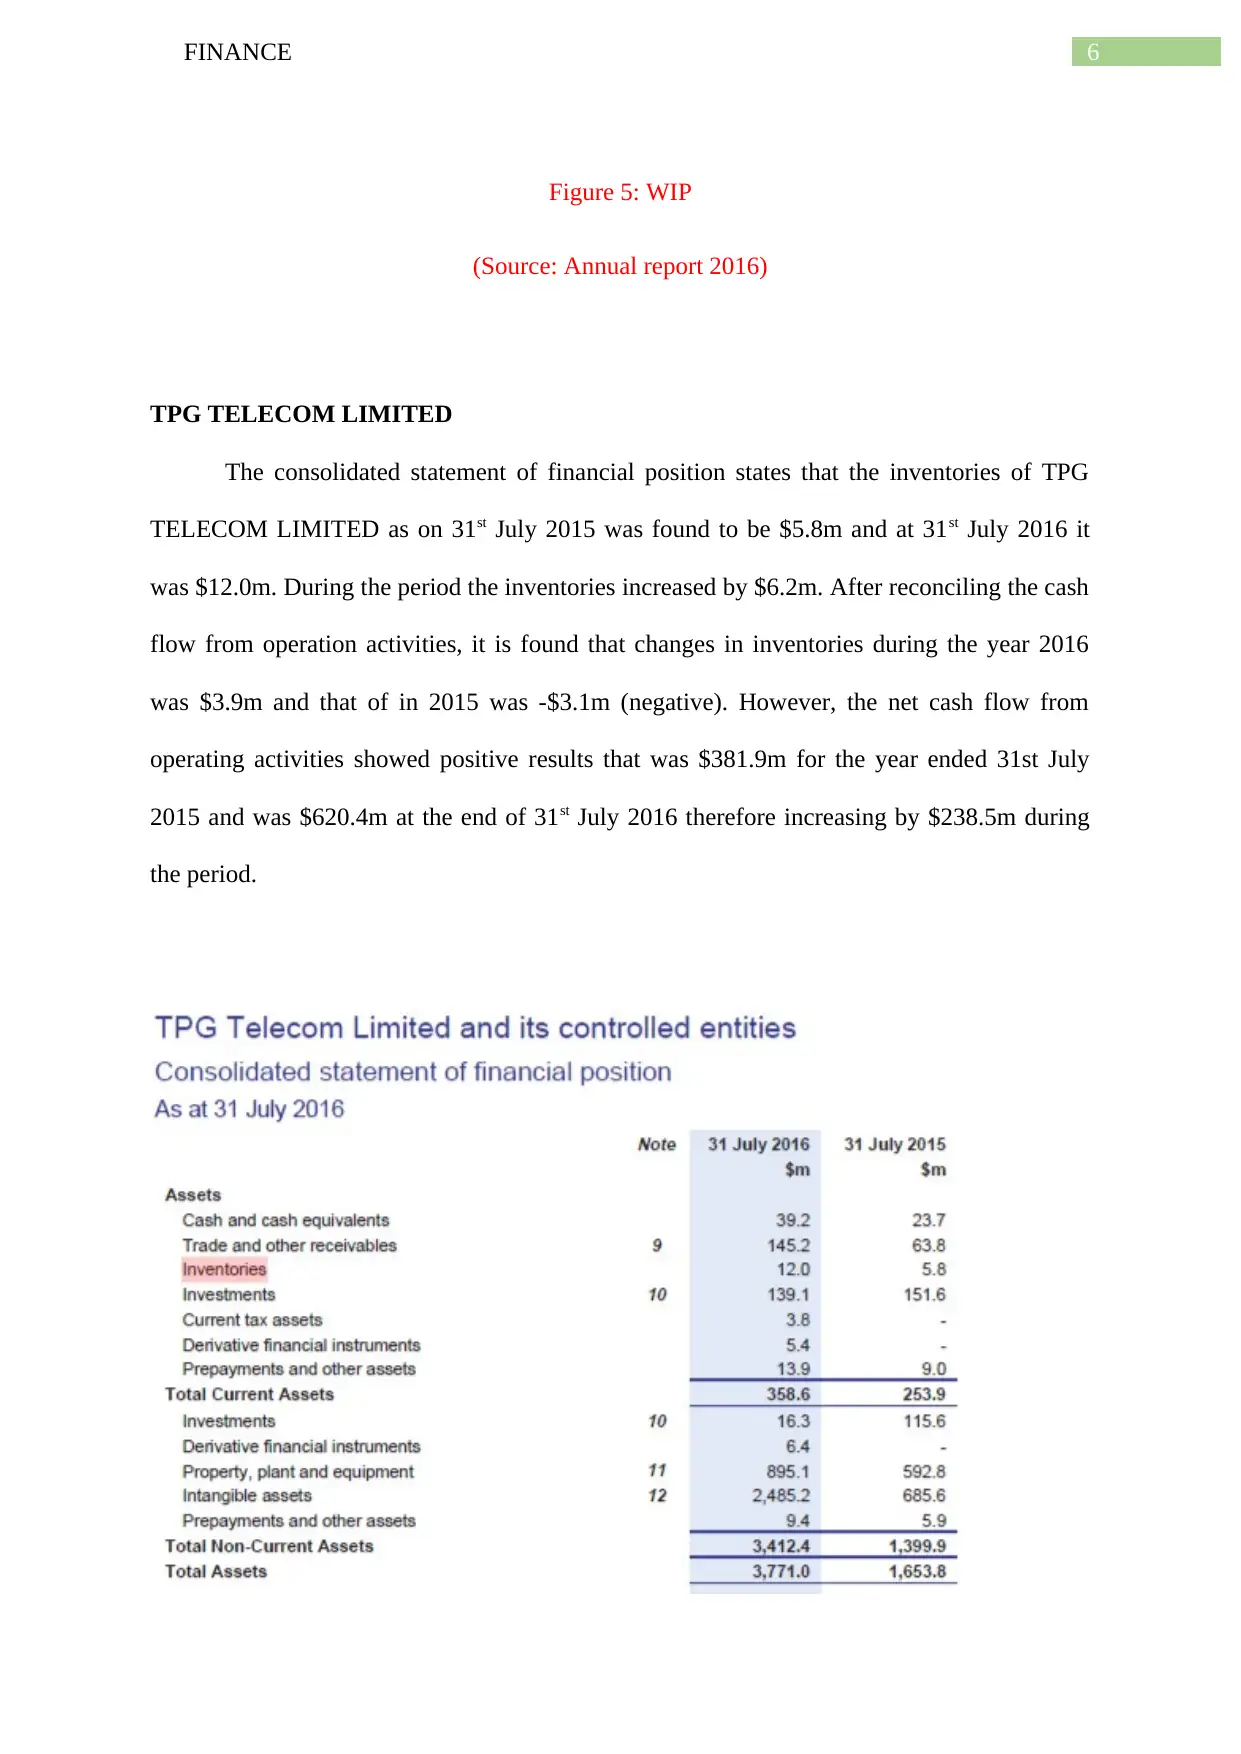
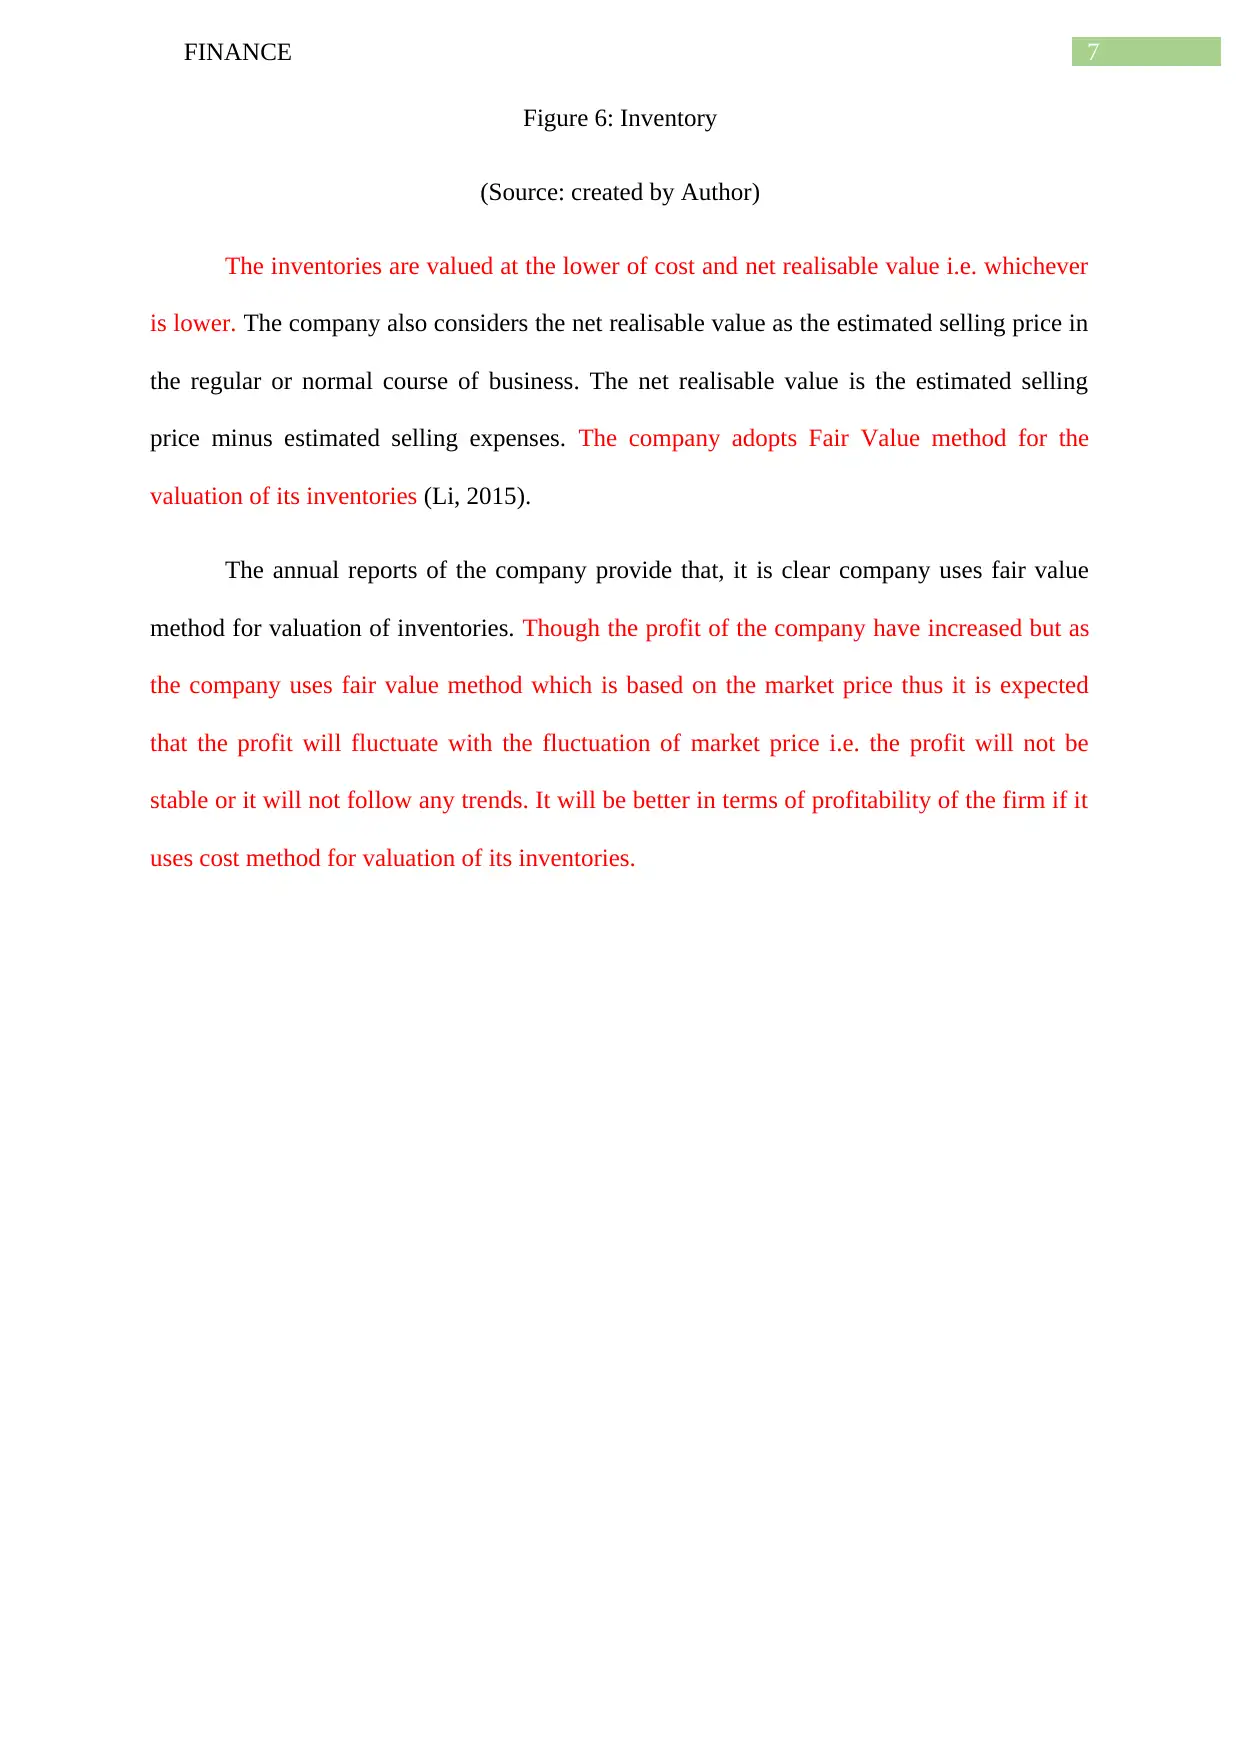
This finance report provides a comparative analysis of the depreciation policies, inventory valuation methods, and intangible assets of Telstra Corporation Limited and TPG Telecom Limited. The report examines the depreciation methods used by both companies, focusing on the straight-line method, and analyzes the impact of depreciation and amortization charges on their financial performance. It then delves into the inventory valuation methods employed, specifically the weighted average cost method used by Telstra and the fair value method used by TPG, assessing the implications of these methods on their respective financial positions. The report also identifies and analyzes the intangible assets listed within the statement of financial position for both companies, including goodwill, software assets, licenses, and deferred expenditure, along with the amortization expenses. Finally, the report offers recommendations, suggesting the adoption of the written-down value method for depreciation and the cost method for inventory valuation for TPG Telecom to improve profitability and stability. The analysis is based on the annual reports of both companies for the years 2015 and 2016.
Document Page
Running head: FINANCE
Finance
Name of the Student:
Name of the university:
Authors Note:
tabler-icon-diamond-filled.svg

Paraphrase This Document

Need a fresh take? Get an instant paraphrase of this document with our AI Paraphraser
Document Page
1FINANCE
Table of Contents
Analysis and explanation of the depreciation policy:................................................................2
Depreciation policy of Telstra Corporation limited...............................................................2
Depreciation policy of TPG Telecom limited........................................................................3
Analysis and interpretation of inventory valuation methods.....................................................4
TELSTRA CORPORATION LIMITED...............................................................................4
TPG TELECOM LIMITED...................................................................................................6
Identification and analysis of intangibles listed within the statement of financial position......7
TELSTRA CORPORATION LIMITED...............................................................................7
TPG TELECOM LIMITED...................................................................................................9
Comparison and Recommendations.........................................................................................10
Reference..................................................................................................................................12
Document Page
2FINANCE
Analysis and explanation of the depreciation policy:
The term Depreciation refers to an accounting technique of allocation of the cost of
any tangible assets based on its useful life. Most often,a company or an organisation follows
two major methods of depreciation. One is the Straight Line Method and the other is the
Written-Down-Value Method of Depreciation (Grant, 2016).
In such cases, the management must take some correct and concrete decision to
ensure profitability in the long run. Here the depreciation policy plays an important role in
ensuring long run profitability of the company (Collier, 2015). The management must choose
the correct and most efficient method of depreciation so that the valuations of assets are
carried out most efficiently and correctly.
Depreciation policy of Telstra Corporation limited
The Annual Report of Telstra Corporation Limited provides that the company uses
Straight Line Method for charging depreciation to its assets. As per the Financial Statement
of the company, it is found that amount of depreciation and amortization charges for the year
2015 was $3,974 Million that subsequently increased to $4,155 Million in the year 2016, the
change being 4.6%. This implies that due to increase in depreciation and amortization cost,
the expense of the company had increased by $181 Million. On comparing the Depreciation
and amortization charges, in the year 2015 depreciation of plant and equipment and property
was $2915 Million that increased to $2957 Million in 2016. Similarly, in the year 2015
Amortization charges of intangible assets were $1059 Million that also increased to $1198
Million in 2016 (Kim, 2016).
Document Page
3FINANCE
Figure 1: Depreciation
(Source: Annual report 2016, Page 90)
As a result, we found that there is a decrease in profit from continuing operations. The
profit was $4114 Million in 2015 and decreased to $3832 Million in 2016. In spite of that, it
is observed from the financial performances that the net profit for the year 2015 was $4,231
Million that increased to $5,780 Million in the year 2016.
Figure 2: Profit
(Source: Annual Report 2016)
Depreciation policy of TPG Telecom limited
The Annual report of TPG Telecom Ltd. we came to know that the company also
follows Straight Line Method for charging depreciation. The financial results states that in the
year 2016 the amount of depreciation charged was $102.4 Million and in 2016 it was $136.6
Million. Thus, there was an increase of $34.5 Million in depreciation expenses for the year
2016.
As per the financial statement of the company, we found that Profit after tax for the
year 2015 was $224.1m that increased to $384.6m in 2016. Moreover, from the statement of
Comparative Income and Retained Profits we observed that the profit for the year attributable
tabler-icon-diamond-filled.svg

Paraphrase This Document

Need a fresh take? Get an instant paraphrase of this document with our AI Paraphraser
Document Page
4FINANCE
to the owners were $385.7m and $235.4m for the year 2016 and 2015 respectively and
retained Earnings at the end of the year were $710.0m and $432.7m for the year 2016 and
2015 respectively. Hence, from the above analysis we found that though the depreciation
expenses were increased but still the company was able to make fair amount of profit from
every angle.
Figure 3: depreciation
(Source: Annual Report 2016)
Analysis and interpretation of inventory valuation methods
TELSTRA CORPORATION LIMITED
On analysing the Annual Reports of Telstra Ltd. It has been found that the company
for its majority of the inventories, it uses the weighted average cost method for valuation of
inventories. The Statement of financial Position of the company shows that the amount of
inventories for the year 2015 was $491m that increased to $557m in the year 2016. There was
an increase of $66m during the period in terms of inventories.
Figure 4: Inventories
Document Page
5FINANCE
(Source: created by Author)
In the inventories, it has been found that there are two parts. One is the Current
Inventories/ Construction work in progress and the other is the Non-Current Inventories. The
current inventories includes Contract cost, progress billings, Raw materials, Finished goods
amount to $491m for the year 2015 and $557m for the year 2016. On the other hand the non-
current inventories that is the finished goods recorded at net realisable value amounted to
$32m in the year 2015 and $29m in the year 2016.
Thus, it can be seen that there is a decrease in Non-current Inventories of the company
by $3m during the period. Therefore, the total of Current and Non-Current inventories of the
firm stands at $523m for the year 2015 and $586m in the year 2016, the total of inventories
being increased by $63m during the period.
From the above analysis, it is seen that the company adopts weighted average method
for valuation of its inventories and as a result of that the profit is increased as the inventories
are increased and vice versa. This is because when inventories are raised the sales are also
increased and hence the income from operations and net profit are increased.
Document Page
6FINANCE
Figure 5: WIP
(Source: Annual report 2016)
TPG TELECOM LIMITED
The consolidated statement of financial position states that the inventories of TPG
TELECOM LIMITED as on 31st July 2015 was found to be $5.8m and at 31st July 2016 it
was $12.0m. During the period the inventories increased by $6.2m. After reconciling the cash
flow from operation activities, it is found that changes in inventories during the year 2016
was $3.9m and that of in 2015 was -$3.1m (negative). However, the net cash flow from
operating activities showed positive results that was $381.9m for the year ended 31st July
2015 and was $620.4m at the end of 31st July 2016 therefore increasing by $238.5m during
the period.
tabler-icon-diamond-filled.svg

Paraphrase This Document

Need a fresh take? Get an instant paraphrase of this document with our AI Paraphraser
Document Page
7FINANCE
Figure 6: Inventory
(Source: created by Author)
The inventories are valued at the lower of cost and net realisable value i.e. whichever
is lower. The company also considers the net realisable value as the estimated selling price in
the regular or normal course of business. The net realisable value is the estimated selling
price minus estimated selling expenses. The company adopts Fair Value method for the
valuation of its inventories (Li, 2015).
The annual reports of the company provide that, it is clear company uses fair value
method for valuation of inventories. Though the profit of the company have increased but as
the company uses fair value method which is based on the market price thus it is expected
that the profit will fluctuate with the fluctuation of market price i.e. the profit will not be
stable or it will not follow any trends. It will be better in terms of profitability of the firm if it
uses cost method for valuation of its inventories.
Document Page
8FINANCE
Identification and analysis of intangibles listed within the statement of financial position
TELSTRA CORPORATION LIMITED
The financial position statement of the company states that total intangibles of the
company for the year 2015 was $9,332m and as on 30th June 2016 was $9,229m. Hence, there
is a decrease for assets of the company during the period by $103m. The amortizations of
intangible assets were $1,198m and $1,059m for the year ended 30th June 2016 and 30th June
2015 respectively.
Figure 7: Intangible Assets
(Source: Annual Report 2016)
In the details in the annual report it can be seen that amongst the Intangible assets, the
amount of goodwill at the end of 2015 as per the net book value was $1,652m, Software
Document Page
9FINANCE
Assets were $4,465m, Licence were $2,042m, Deferred expenditure were $955m and other
intangibles were $218m. Similarly these details for the year ended 2016 for goodwill was
$1,346m, for Software Assets were $4,660m, for Licence were $1,869m, for deferred
expenditure $1,143 and for other intangibles were $211m.
Apart from this during the financial year 2016, the transactions that impacted goodwill
balances are:
Goodwill amounting to $64m was recognised for acquisition of controlled entities and
businesses.
The company also recognised impairment loss against Goodwill for the Ooyala
Holding Group CGU amounting to $246m.
Further $137m of Goodwill of the company was disposed of.
TPG TELECOM LIMITED
The Balance Sheet of TPG Telecom Ltd. is showing the balances of Intangible assets
for the year ended 2016 and 2015 are $2,485.2m and $685.6m respectively. Getting into the
detailsit came to the knowledge that there is an increase of $1,799.6m in intangible assets
during the period which comprises of Goodwill of amount $1,364.9m for the acquisition of
iiNet, for acquiring iiNet customer base amounting to $316.8m, $185.0m for other intangible
assets. Payment that were made during the year for International Capacity IRU and Spectrum
were $20.2m and $15.3m respectively. Besides this other intangible assets amounted to
$12.5m. During the year, 2016 net amortization expenses amounted to $115.1m that was
$71.8m more than that of previous year.
tabler-icon-diamond-filled.svg

Paraphrase This Document

Need a fresh take? Get an instant paraphrase of this document with our AI Paraphraser
Document Page
10FINANCE
Figure
8:
Intangible Assets
(Source: Annual report 2016)
Comparison and Recommendations
BASIS Telstra Corporation Ltd. TPG Telecom Ltd. Recommendations
Depreciation Policy Follows Straight Line Method
for charging Depreciation.
The amount of depreciation for
the year 2015 was $3,974m
and it increased to $4,155m in
the year 2016.
Follows Straight Line
Method for charging
Depreciation. The
amount of depreciation
for the year 2015 was
$102.4m and it increased
to $136.9m in the year
2016.
It is recommended to
follow the Written
Down Value method for
charging depreciation as
it is suitable for
companies having large
number of fixed assets
and it is also accepted by
Document Page
11FINANCE
Income Tax Act.
Inventories Valuation Inventories are valued on
Weighted Average method.
Inventories are valued
on Fair Value method.
It is recommended for
TPG Telecom Ltd. to
adopt cost method over
fair value method of
inventory valuation to
avoid the fluctuations
for profit.
Intangible Assets. The amount of intangible
assets in the year 2015 was
$9,332m and it reduced to
$9,229m in the year 2016.
Intangible assets
amounted to $685.6m in
2015 that had increased
to $2,485.2m at the end
of the year 2016.
The reporting of the
intangible assets does
not have many
discrepancies. However,
it is recommended that
the companies should
follow the requirements
of AASB 136.
chevron_up_icon
1 out of 12
circle_padding
hide_on_mobile
zoom_out_icon
[object Object]