Managerial Finance Report: Financial Ratio Analysis and Appraisal
VerifiedAdded on 2022/12/30
|17
|3768
|67
Report
AI Summary
This report delves into managerial finance, evaluating the financial performance of companies using ratio analysis and investment appraisal techniques. The first part of the report focuses on comparing Tesco and Sainsbury's, calculating and interpreting various financial ratios such as current ratio, quick ratio, net profit margin, gross profit margin, gearing ratio, price/earning ratio, earning per share, return on capital employed, average inventories turnover, and dividend payout ratio to assess their financial health and investment potential. The report also offers recommendations for improving the performance of a poorly performing business and discusses the limitations of financial ratios. The second part of the report applies capital investment appraisal techniques, specifically the payback period method, to evaluate two mutually exclusive projects (A and B), aiding in capital budgeting decisions. The report also discusses the limitations of investment appraisal techniques for long-term decision-making.

Managerial Finance
Paraphrase This Document
Need a fresh take? Get an instant paraphrase of this document with our AI Paraphraser
Table of Contents
INTRODUCTION...............................................................................................................................3
MAIN BODY......................................................................................................................................3
PORTFOLIO 1....................................................................................................................................3
Calculation of ratios........................................................................................................................3
Analysis of performance and financial position.............................................................................7
Recommendation on how poorly performing business can be improved.....................................8
Limitations of financial ratios in interpreting a company's performance.......................................8
PORTFOLIO 2....................................................................................................................................9
Capital Investment Appraisal.........................................................................................................9
Limitation of investment appraisal technique for long run decision making...............................13
CONCLUSION.................................................................................................................................14
REFERENCES..................................................................................................................................15
INTRODUCTION
Managerial finance refers to the conduction of financial activities in the course of managing
a company. The managers always strives hard for maximising profits and minimising costs. They
are required to take many financial decision like investment in assets and acquiring finance for
running a business. This report is about how managers and even investors try to evaluate financial
performance of the company. So that the managers can take future decision on where to invest, or
which opportunity is better in terms of profitability (Arkan, 2016 ). Investors can also evaluate the
company's performance to decide upon where to invest and how much to be invested. The report is
based on how financial supervisor will decide, on the basis of various ratios calculated. This will
help them in selecting between Tesco and Sainsbury's for investment purpose. The second part of
the report is about how finance manager evaluate two projects, that is A and B, with the help of
their future cash flows. For this different capital budgeting technique has been used.
MAIN BODY
PORTFOLIO 1
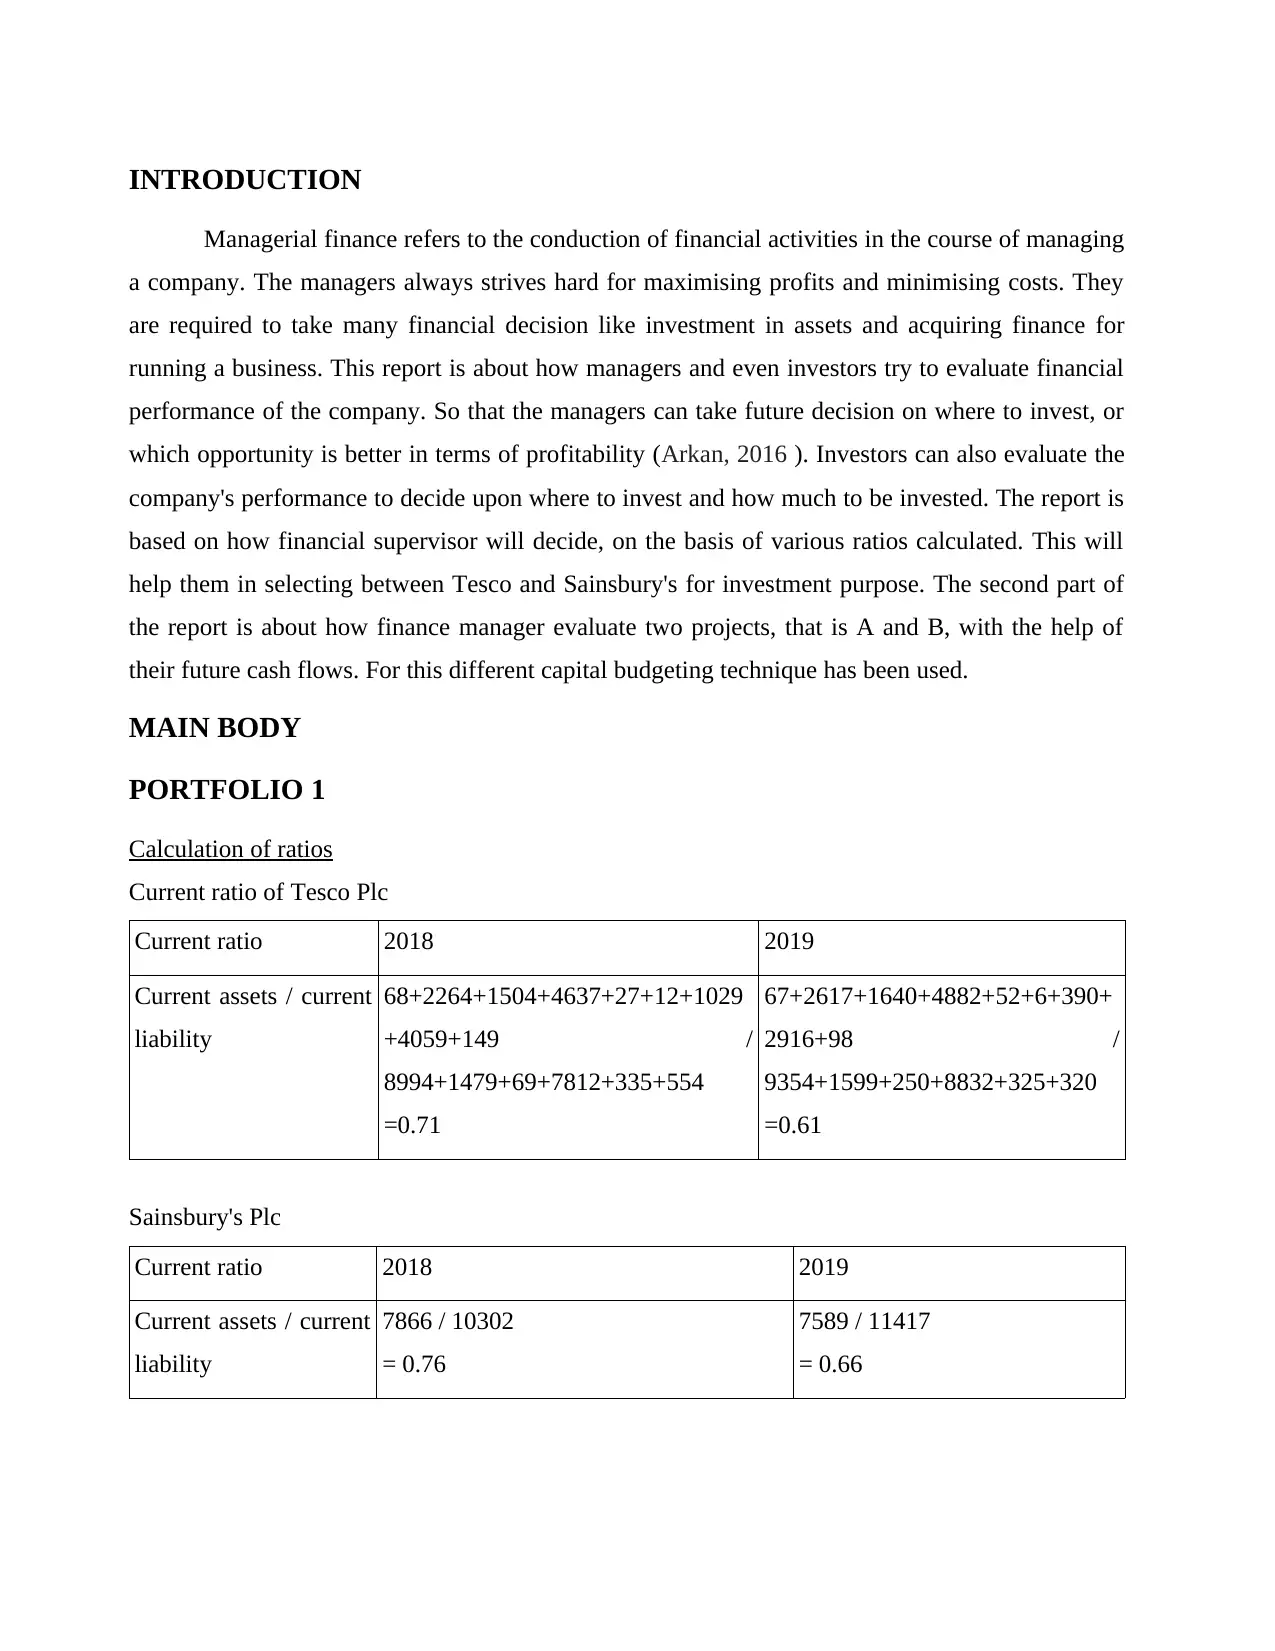
Calculation of ratios
Current ratio of Tesco Plc
Current ratio 2018 2019
Current assets / current
liability
68+2264+1504+4637+27+12+1029
+4059+149 /
8994+1479+69+7812+335+554
=0.71
67+2617+1640+4882+52+6+390+
2916+98 /
9354+1599+250+8832+325+320
=0.61
Sainsbury's Plc
Current ratio 2018 2019
Current assets / current
liability
7866 / 10302
= 0.76
7589 / 11417
= 0.66
Managerial finance refers to the conduction of financial activities in the course of managing
a company. The managers always strives hard for maximising profits and minimising costs. They
are required to take many financial decision like investment in assets and acquiring finance for
running a business. This report is about how managers and even investors try to evaluate financial
performance of the company. So that the managers can take future decision on where to invest, or
which opportunity is better in terms of profitability (Arkan, 2016 ). Investors can also evaluate the
company's performance to decide upon where to invest and how much to be invested. The report is
based on how financial supervisor will decide, on the basis of various ratios calculated. This will
help them in selecting between Tesco and Sainsbury's for investment purpose. The second part of
the report is about how finance manager evaluate two projects, that is A and B, with the help of
their future cash flows. For this different capital budgeting technique has been used.
MAIN BODY
PORTFOLIO 1
Calculation of ratios
Current ratio of Tesco Plc
Current ratio 2018 2019
Current assets / current
liability
68+2264+1504+4637+27+12+1029
+4059+149 /
8994+1479+69+7812+335+554
=0.71
67+2617+1640+4882+52+6+390+
2916+98 /
9354+1599+250+8832+325+320
=0.61
Sainsbury's Plc
Current ratio 2018 2019
Current assets / current
liability
7866 / 10302
= 0.76
7589 / 11417
= 0.66
⊘ This is a preview!⊘
Do you want full access?
Subscribe today to unlock all pages.
Trusted by 1+ million students worldwide
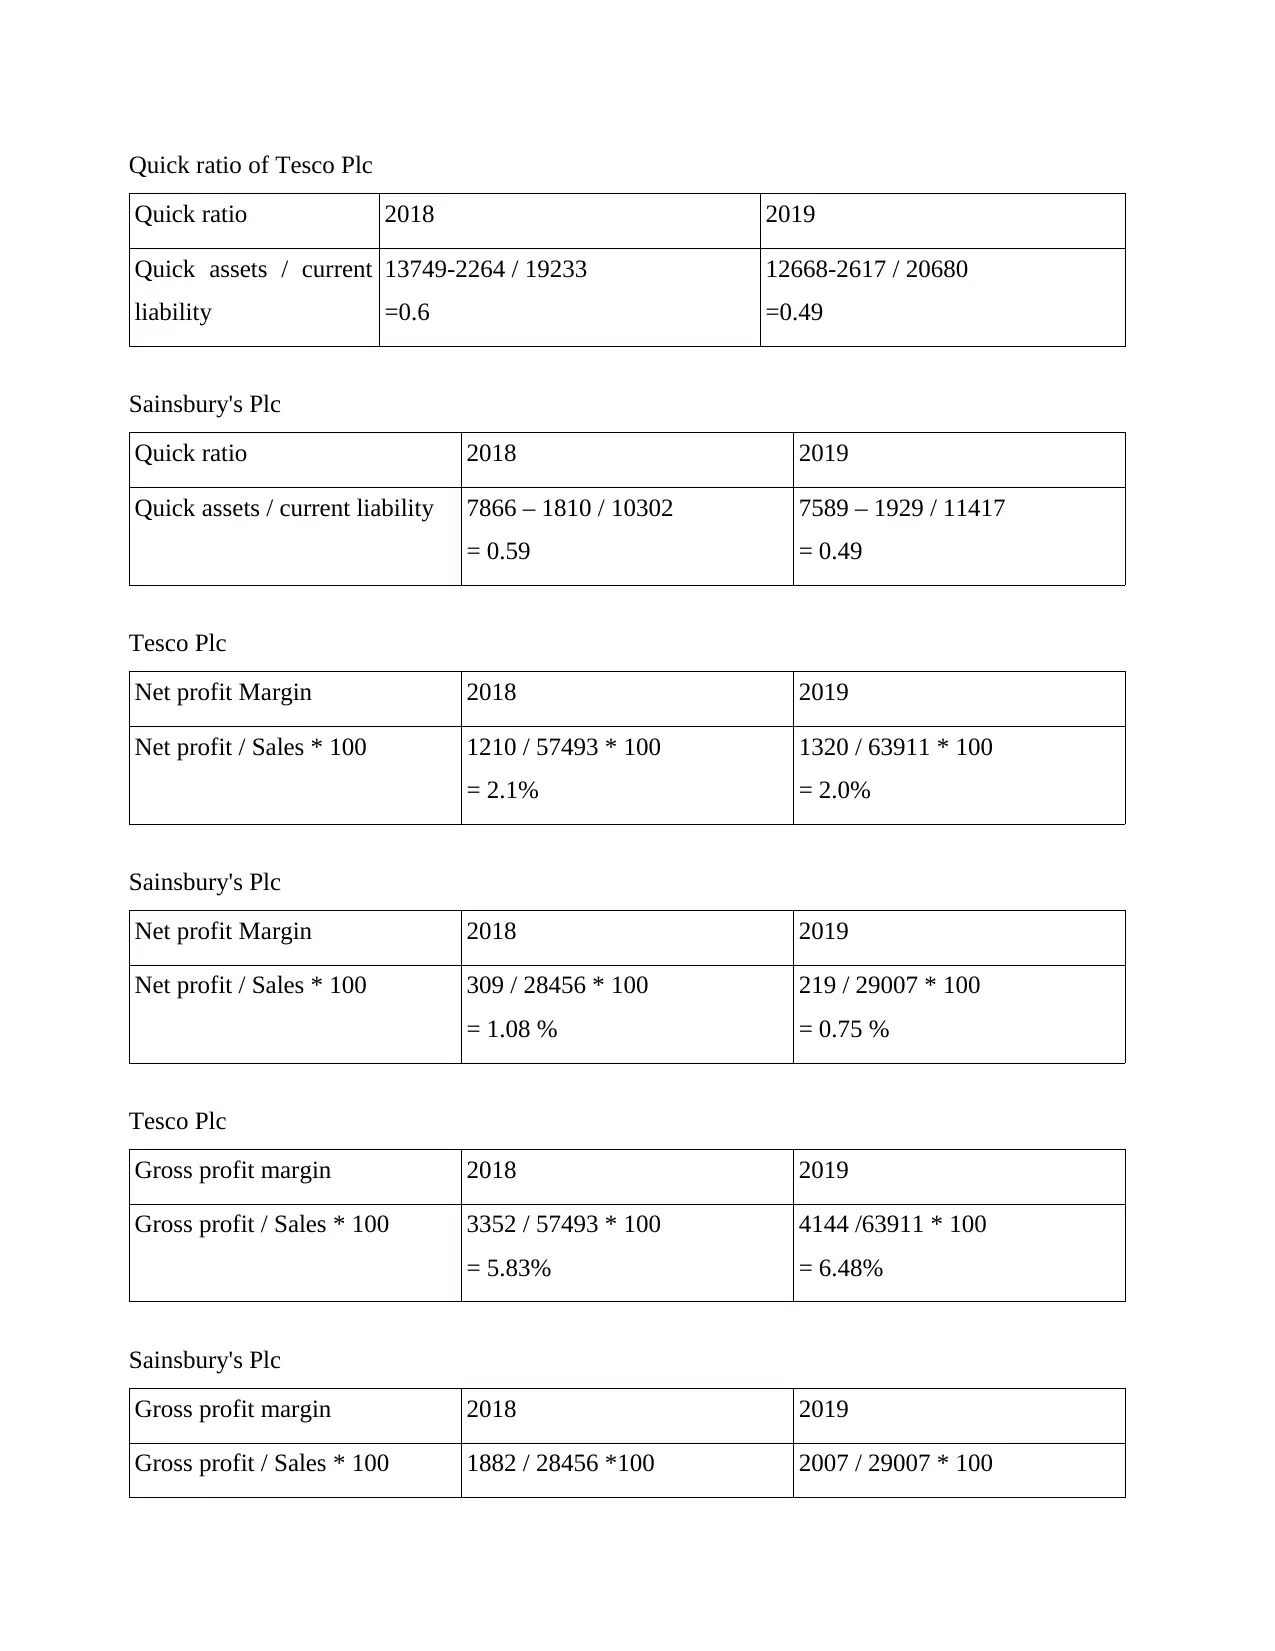
Quick ratio of Tesco Plc
Quick ratio 2018 2019
Quick assets / current
liability
13749-2264 / 19233
=0.6
12668-2617 / 20680
=0.49
Sainsbury's Plc
Quick ratio 2018 2019
Quick assets / current liability 7866 – 1810 / 10302
= 0.59
7589 – 1929 / 11417
= 0.49
Tesco Plc
Net profit Margin 2018 2019
Net profit / Sales * 100 1210 / 57493 * 100
= 2.1%
1320 / 63911 * 100
= 2.0%
Sainsbury's Plc
Net profit Margin 2018 2019
Net profit / Sales * 100 309 / 28456 * 100
= 1.08 %
219 / 29007 * 100
= 0.75 %
Tesco Plc
Gross profit margin 2018 2019
Gross profit / Sales * 100 3352 / 57493 * 100
= 5.83%
4144 /63911 * 100
= 6.48%
Sainsbury's Plc
Gross profit margin 2018 2019
Gross profit / Sales * 100 1882 / 28456 *100 2007 / 29007 * 100
Quick ratio 2018 2019
Quick assets / current
liability
13749-2264 / 19233
=0.6
12668-2617 / 20680
=0.49
Sainsbury's Plc
Quick ratio 2018 2019
Quick assets / current liability 7866 – 1810 / 10302
= 0.59
7589 – 1929 / 11417
= 0.49
Tesco Plc
Net profit Margin 2018 2019
Net profit / Sales * 100 1210 / 57493 * 100
= 2.1%
1320 / 63911 * 100
= 2.0%
Sainsbury's Plc
Net profit Margin 2018 2019
Net profit / Sales * 100 309 / 28456 * 100
= 1.08 %
219 / 29007 * 100
= 0.75 %
Tesco Plc
Gross profit margin 2018 2019
Gross profit / Sales * 100 3352 / 57493 * 100
= 5.83%
4144 /63911 * 100
= 6.48%
Sainsbury's Plc
Gross profit margin 2018 2019
Gross profit / Sales * 100 1882 / 28456 *100 2007 / 29007 * 100
Paraphrase This Document
Need a fresh take? Get an instant paraphrase of this document with our AI Paraphraser
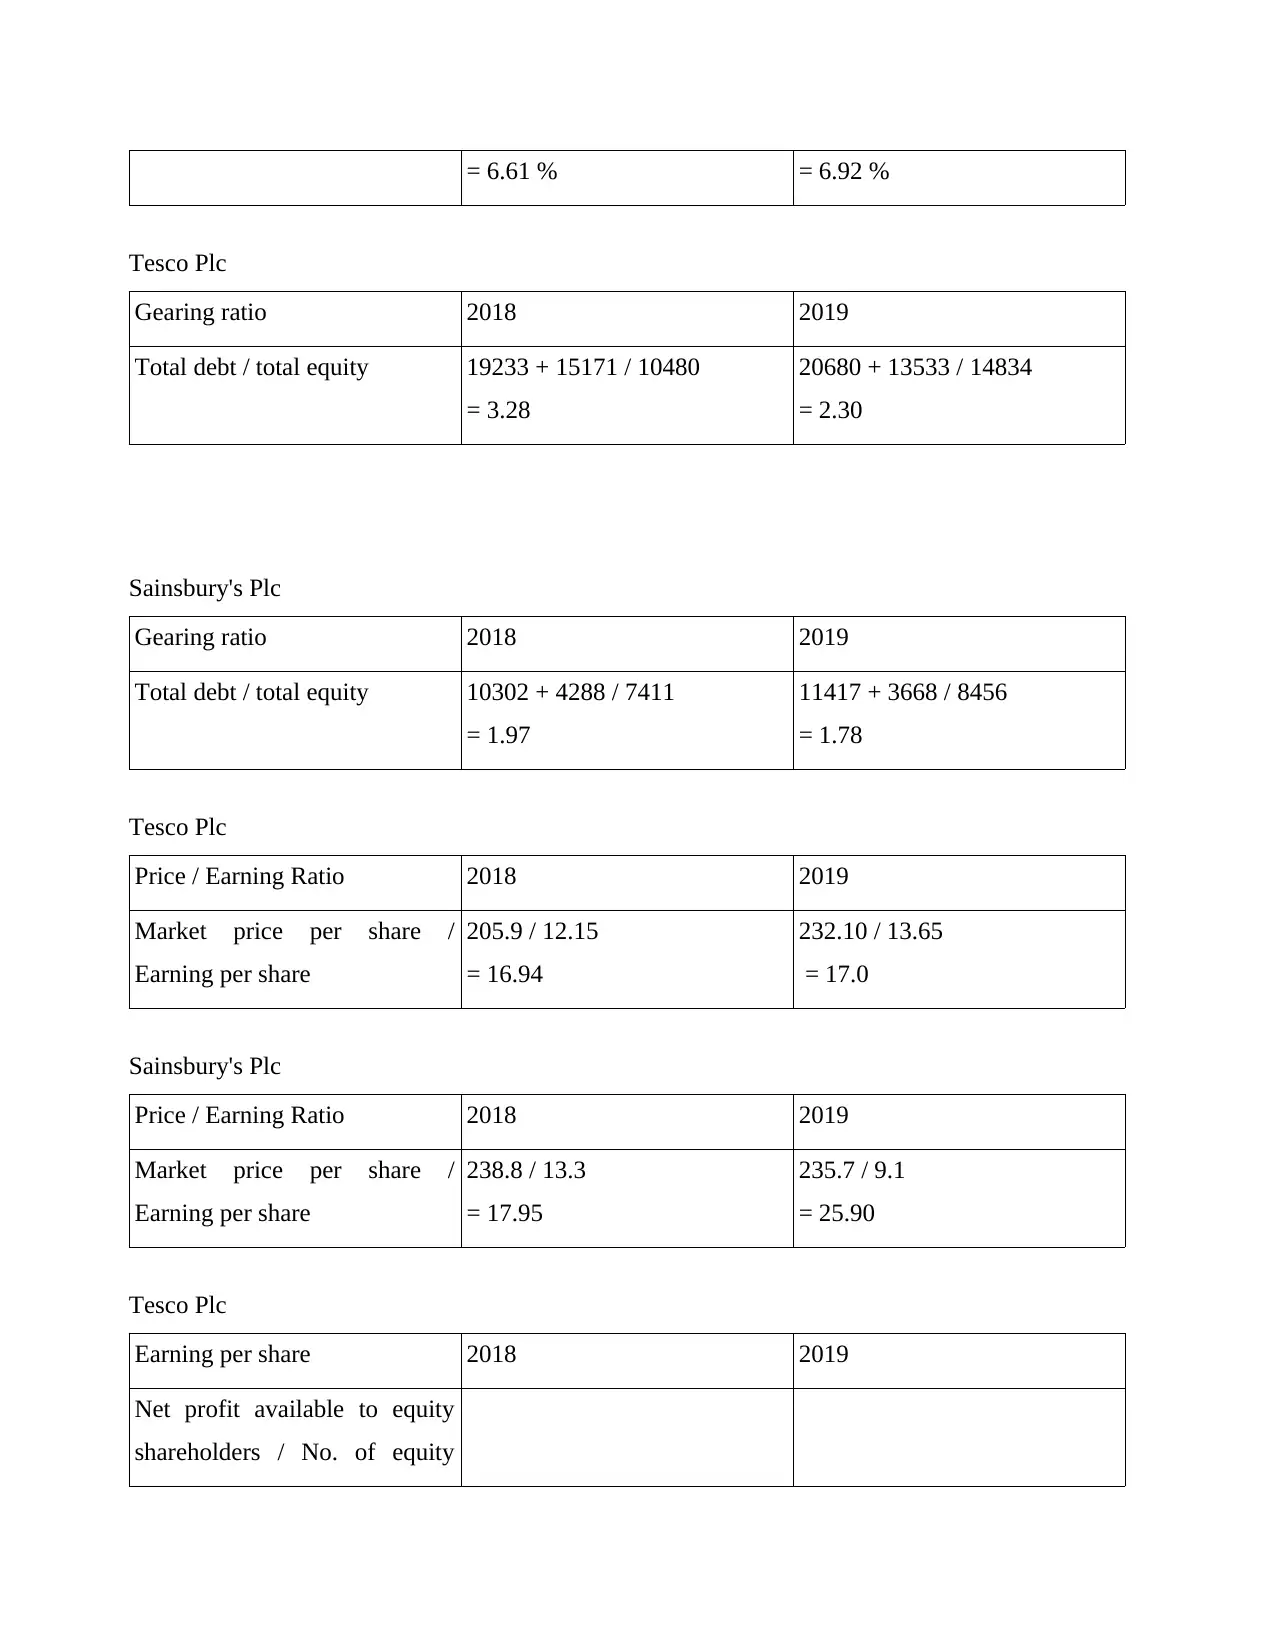
= 6.61 % = 6.92 %
Tesco Plc
Gearing ratio 2018 2019
Total debt / total equity 19233 + 15171 / 10480
= 3.28
20680 + 13533 / 14834
= 2.30
Sainsbury's Plc
Gearing ratio 2018 2019
Total debt / total equity 10302 + 4288 / 7411
= 1.97
11417 + 3668 / 8456
= 1.78
Tesco Plc
Price / Earning Ratio 2018 2019
Market price per share /
Earning per share
205.9 / 12.15
= 16.94
232.10 / 13.65
= 17.0
Sainsbury's Plc
Price / Earning Ratio 2018 2019
Market price per share /
Earning per share
238.8 / 13.3
= 17.95
235.7 / 9.1
= 25.90
Tesco Plc
Earning per share 2018 2019
Net profit available to equity
shareholders / No. of equity
Tesco Plc
Gearing ratio 2018 2019
Total debt / total equity 19233 + 15171 / 10480
= 3.28
20680 + 13533 / 14834
= 2.30
Sainsbury's Plc
Gearing ratio 2018 2019
Total debt / total equity 10302 + 4288 / 7411
= 1.97
11417 + 3668 / 8456
= 1.78
Tesco Plc
Price / Earning Ratio 2018 2019
Market price per share /
Earning per share
205.9 / 12.15
= 16.94
232.10 / 13.65
= 17.0
Sainsbury's Plc
Price / Earning Ratio 2018 2019
Market price per share /
Earning per share
238.8 / 13.3
= 17.95
235.7 / 9.1
= 25.90
Tesco Plc
Earning per share 2018 2019
Net profit available to equity
shareholders / No. of equity
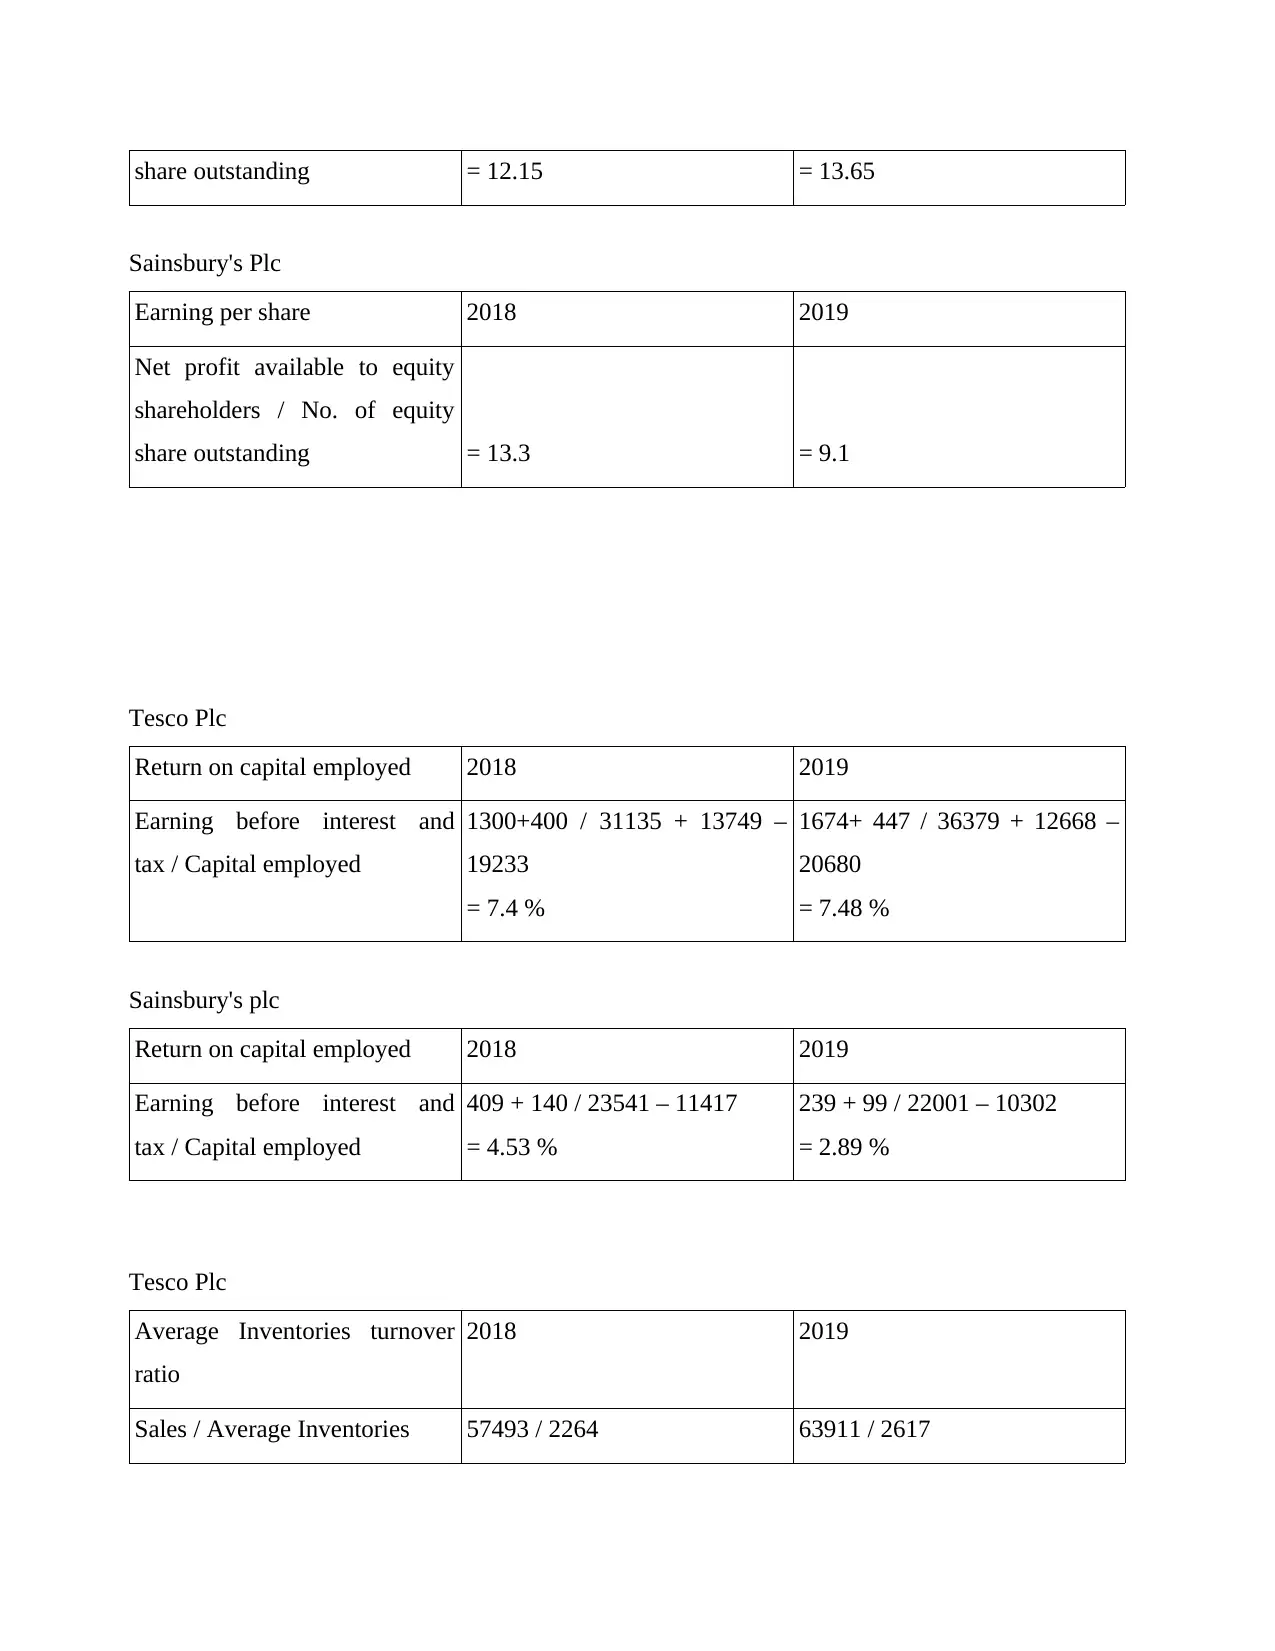
share outstanding = 12.15 = 13.65
Sainsbury's Plc
Earning per share 2018 2019
Net profit available to equity
shareholders / No. of equity
share outstanding = 13.3 = 9.1
Tesco Plc
Return on capital employed 2018 2019
Earning before interest and
tax / Capital employed
1300+400 / 31135 + 13749 –
19233
= 7.4 %
1674+ 447 / 36379 + 12668 –
20680
= 7.48 %
Sainsbury's plc
Return on capital employed 2018 2019
Earning before interest and
tax / Capital employed
409 + 140 / 23541 – 11417
= 4.53 %
239 + 99 / 22001 – 10302
= 2.89 %
Tesco Plc
Average Inventories turnover
ratio
2018 2019
Sales / Average Inventories 57493 / 2264 63911 / 2617
⊘ This is a preview!⊘
Do you want full access?
Subscribe today to unlock all pages.
Trusted by 1+ million students worldwide
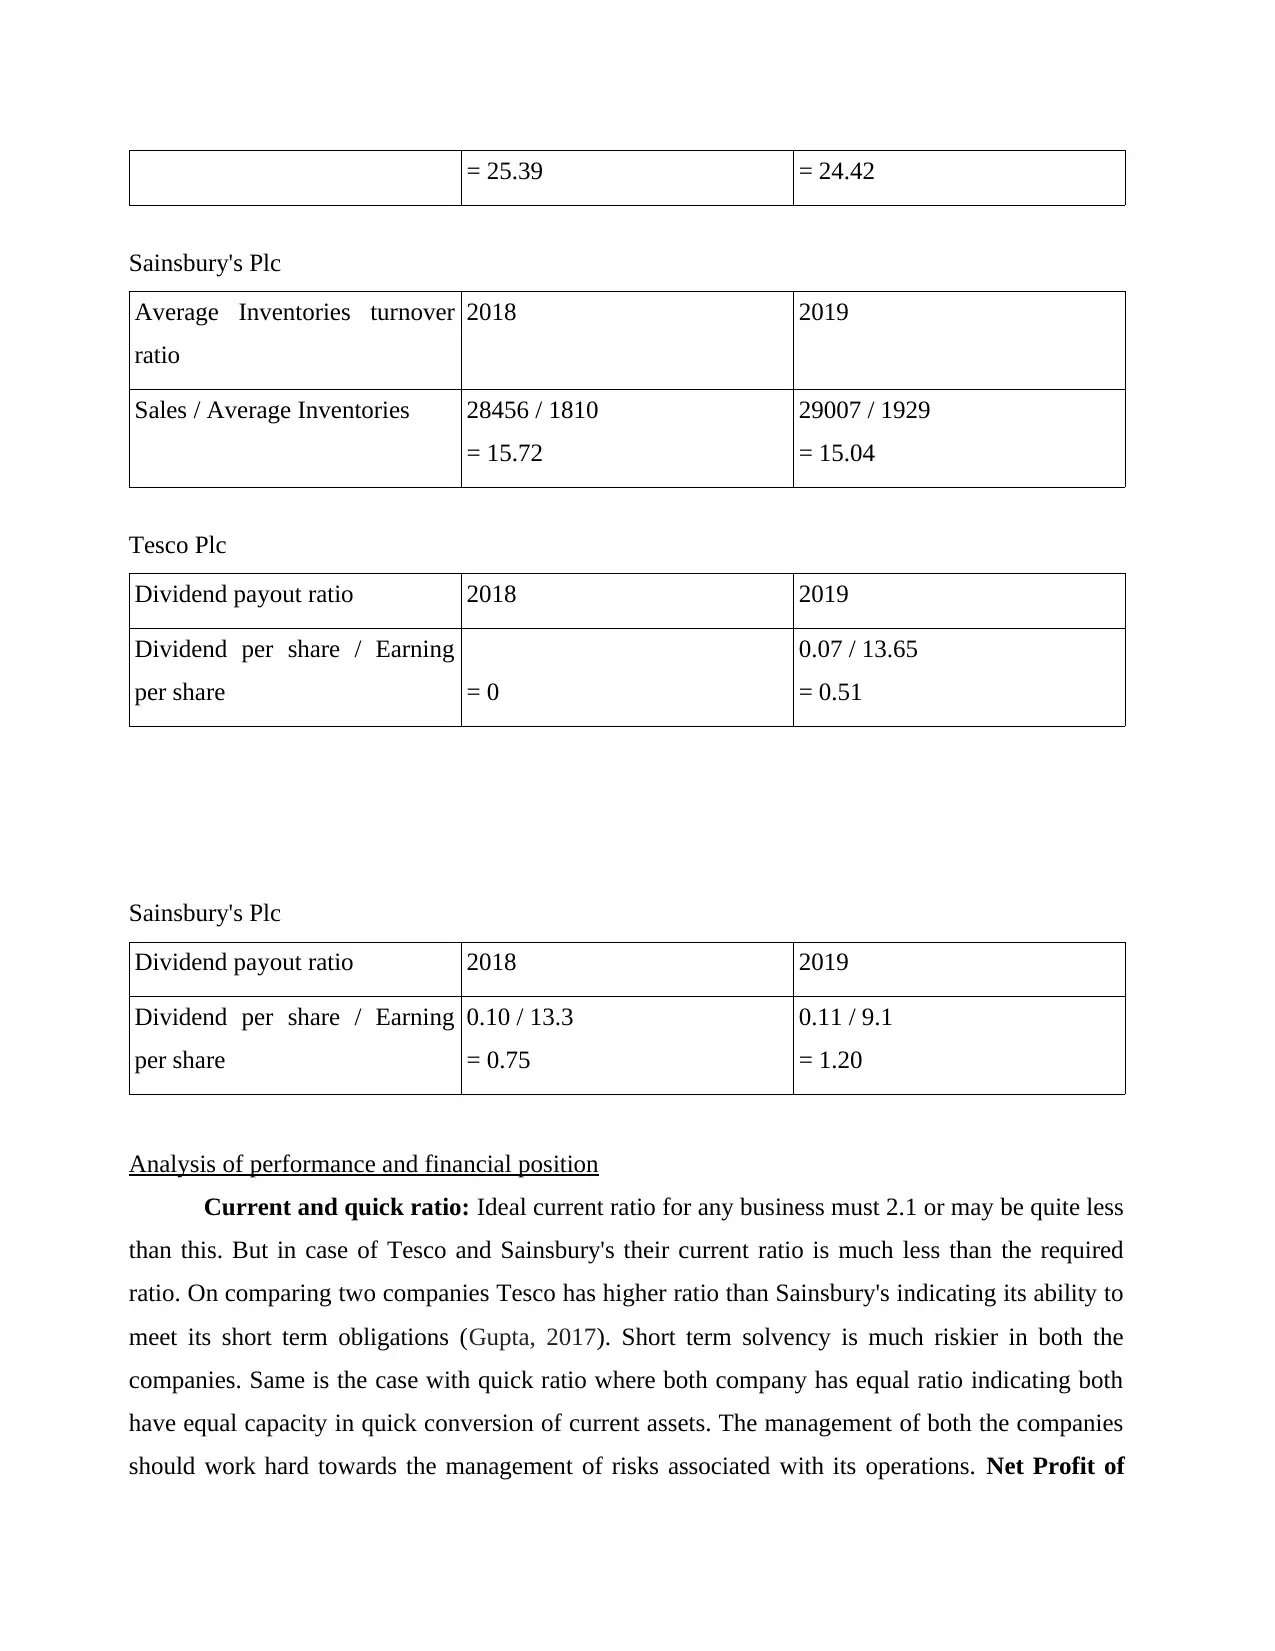
= 25.39 = 24.42
Sainsbury's Plc
Average Inventories turnover
ratio
2018 2019
Sales / Average Inventories 28456 / 1810
= 15.72
29007 / 1929
= 15.04
Tesco Plc
Dividend payout ratio 2018 2019
Dividend per share / Earning
per share = 0
0.07 / 13.65
= 0.51
Sainsbury's Plc
Dividend payout ratio 2018 2019
Dividend per share / Earning
per share
0.10 / 13.3
= 0.75
0.11 / 9.1
= 1.20
Analysis of performance and financial position
Current and quick ratio: Ideal current ratio for any business must 2.1 or may be quite less
than this. But in case of Tesco and Sainsbury's their current ratio is much less than the required
ratio. On comparing two companies Tesco has higher ratio than Sainsbury's indicating its ability to
meet its short term obligations (Gupta, 2017). Short term solvency is much riskier in both the
companies. Same is the case with quick ratio where both company has equal ratio indicating both
have equal capacity in quick conversion of current assets. The management of both the companies
should work hard towards the management of risks associated with its operations. Net Profit of
Sainsbury's Plc
Average Inventories turnover
ratio
2018 2019
Sales / Average Inventories 28456 / 1810
= 15.72
29007 / 1929
= 15.04
Tesco Plc
Dividend payout ratio 2018 2019
Dividend per share / Earning
per share = 0
0.07 / 13.65
= 0.51
Sainsbury's Plc
Dividend payout ratio 2018 2019
Dividend per share / Earning
per share
0.10 / 13.3
= 0.75
0.11 / 9.1
= 1.20
Analysis of performance and financial position
Current and quick ratio: Ideal current ratio for any business must 2.1 or may be quite less
than this. But in case of Tesco and Sainsbury's their current ratio is much less than the required
ratio. On comparing two companies Tesco has higher ratio than Sainsbury's indicating its ability to
meet its short term obligations (Gupta, 2017). Short term solvency is much riskier in both the
companies. Same is the case with quick ratio where both company has equal ratio indicating both
have equal capacity in quick conversion of current assets. The management of both the companies
should work hard towards the management of risks associated with its operations. Net Profit of
Paraphrase This Document
Need a fresh take? Get an instant paraphrase of this document with our AI Paraphraser
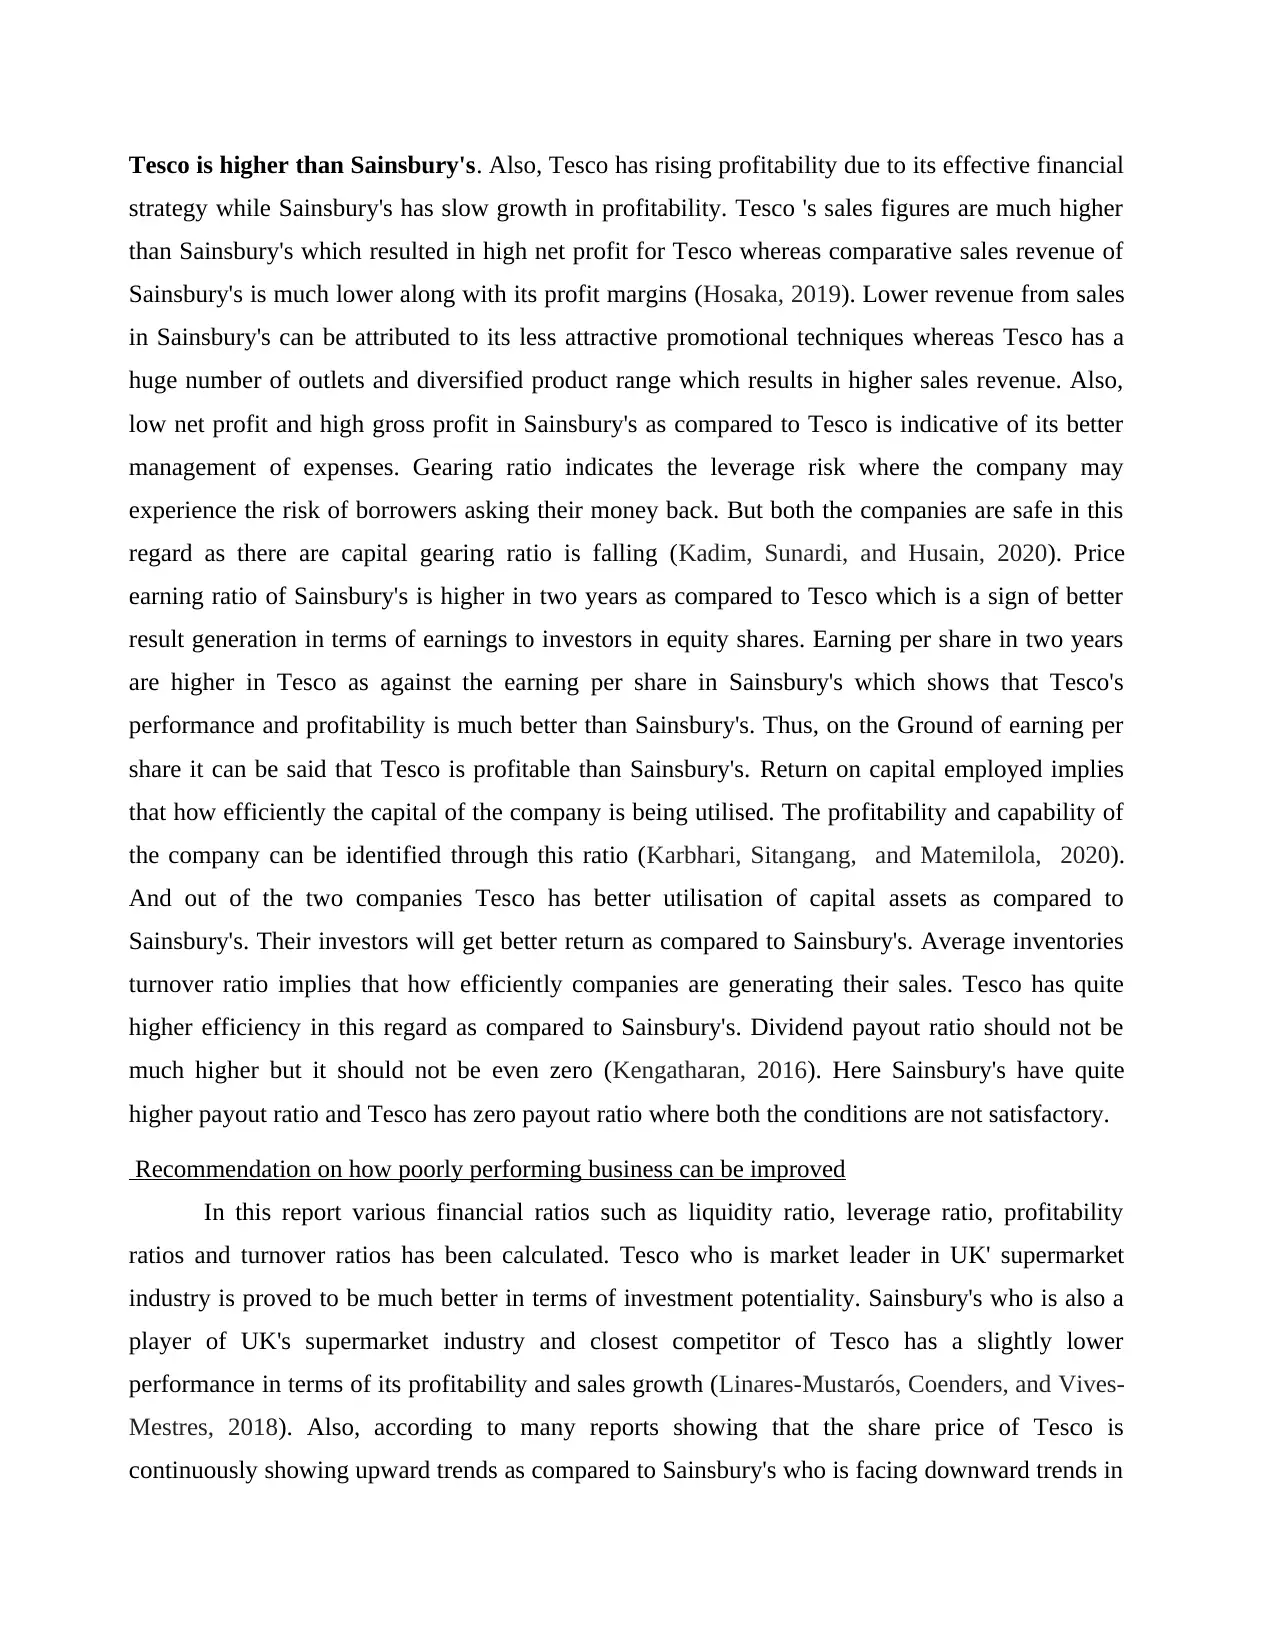
Tesco is higher than Sainsbury's. Also, Tesco has rising profitability due to its effective financial
strategy while Sainsbury's has slow growth in profitability. Tesco 's sales figures are much higher
than Sainsbury's which resulted in high net profit for Tesco whereas comparative sales revenue of
Sainsbury's is much lower along with its profit margins (Hosaka, 2019). Lower revenue from sales
in Sainsbury's can be attributed to its less attractive promotional techniques whereas Tesco has a
huge number of outlets and diversified product range which results in higher sales revenue. Also,
low net profit and high gross profit in Sainsbury's as compared to Tesco is indicative of its better
management of expenses. Gearing ratio indicates the leverage risk where the company may
experience the risk of borrowers asking their money back. But both the companies are safe in this
regard as there are capital gearing ratio is falling (Kadim, Sunardi, and Husain, 2020). Price
earning ratio of Sainsbury's is higher in two years as compared to Tesco which is a sign of better
result generation in terms of earnings to investors in equity shares. Earning per share in two years
are higher in Tesco as against the earning per share in Sainsbury's which shows that Tesco's
performance and profitability is much better than Sainsbury's. Thus, on the Ground of earning per
share it can be said that Tesco is profitable than Sainsbury's. Return on capital employed implies
that how efficiently the capital of the company is being utilised. The profitability and capability of
the company can be identified through this ratio (Karbhari, Sitangang, and Matemilola, 2020).
And out of the two companies Tesco has better utilisation of capital assets as compared to
Sainsbury's. Their investors will get better return as compared to Sainsbury's. Average inventories
turnover ratio implies that how efficiently companies are generating their sales. Tesco has quite
higher efficiency in this regard as compared to Sainsbury's. Dividend payout ratio should not be
much higher but it should not be even zero (Kengatharan, 2016). Here Sainsbury's have quite
higher payout ratio and Tesco has zero payout ratio where both the conditions are not satisfactory.
Recommendation on how poorly performing business can be improved
In this report various financial ratios such as liquidity ratio, leverage ratio, profitability
ratios and turnover ratios has been calculated. Tesco who is market leader in UK' supermarket
industry is proved to be much better in terms of investment potentiality. Sainsbury's who is also a
player of UK's supermarket industry and closest competitor of Tesco has a slightly lower
performance in terms of its profitability and sales growth (Linares-Mustarós, Coenders, and Vives-
Mestres, 2018). Also, according to many reports showing that the share price of Tesco is
continuously showing upward trends as compared to Sainsbury's who is facing downward trends in
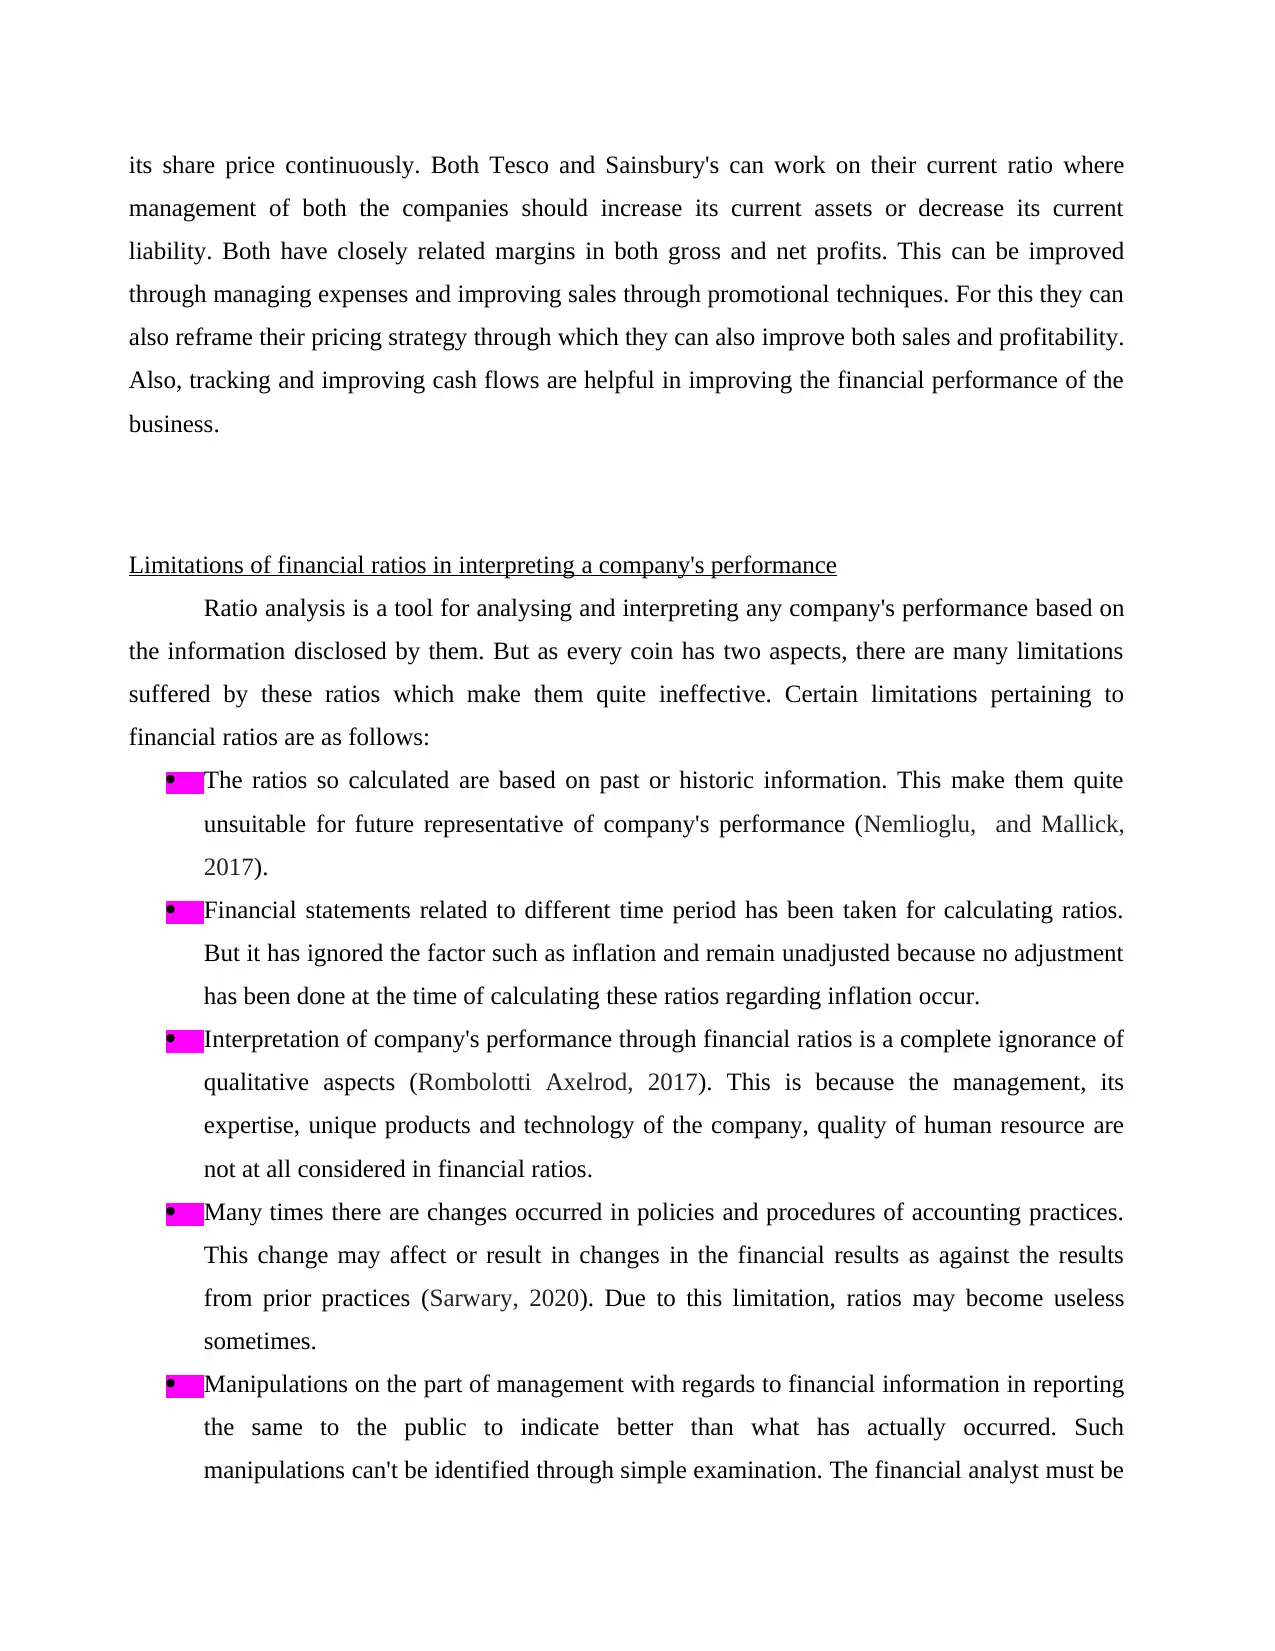
its share price continuously. Both Tesco and Sainsbury's can work on their current ratio where
management of both the companies should increase its current assets or decrease its current
liability. Both have closely related margins in both gross and net profits. This can be improved
through managing expenses and improving sales through promotional techniques. For this they can
also reframe their pricing strategy through which they can also improve both sales and profitability.
Also, tracking and improving cash flows are helpful in improving the financial performance of the
business.
Limitations of financial ratios in interpreting a company's performance
Ratio analysis is a tool for analysing and interpreting any company's performance based on
the information disclosed by them. But as every coin has two aspects, there are many limitations
suffered by these ratios which make them quite ineffective. Certain limitations pertaining to
financial ratios are as follows:
The ratios so calculated are based on past or historic information. This make them quite
unsuitable for future representative of company's performance (Nemlioglu, and Mallick,
2017).
Financial statements related to different time period has been taken for calculating ratios.
But it has ignored the factor such as inflation and remain unadjusted because no adjustment
has been done at the time of calculating these ratios regarding inflation occur.
Interpretation of company's performance through financial ratios is a complete ignorance of
qualitative aspects (Rombolotti Axelrod, 2017). This is because the management, its
expertise, unique products and technology of the company, quality of human resource are
not at all considered in financial ratios.
Many times there are changes occurred in policies and procedures of accounting practices.
This change may affect or result in changes in the financial results as against the results
from prior practices (Sarwary, 2020). Due to this limitation, ratios may become useless
sometimes.
Manipulations on the part of management with regards to financial information in reporting
the same to the public to indicate better than what has actually occurred. Such
manipulations can't be identified through simple examination. The financial analyst must be
⊘ This is a preview!⊘
Do you want full access?
Subscribe today to unlock all pages.
Trusted by 1+ million students worldwide
enough vigilant about such manipulations in the financial reports. And if the same is not
possible then the ratios calculated on the basis of these ratios can't be able show the actual
company's performance.
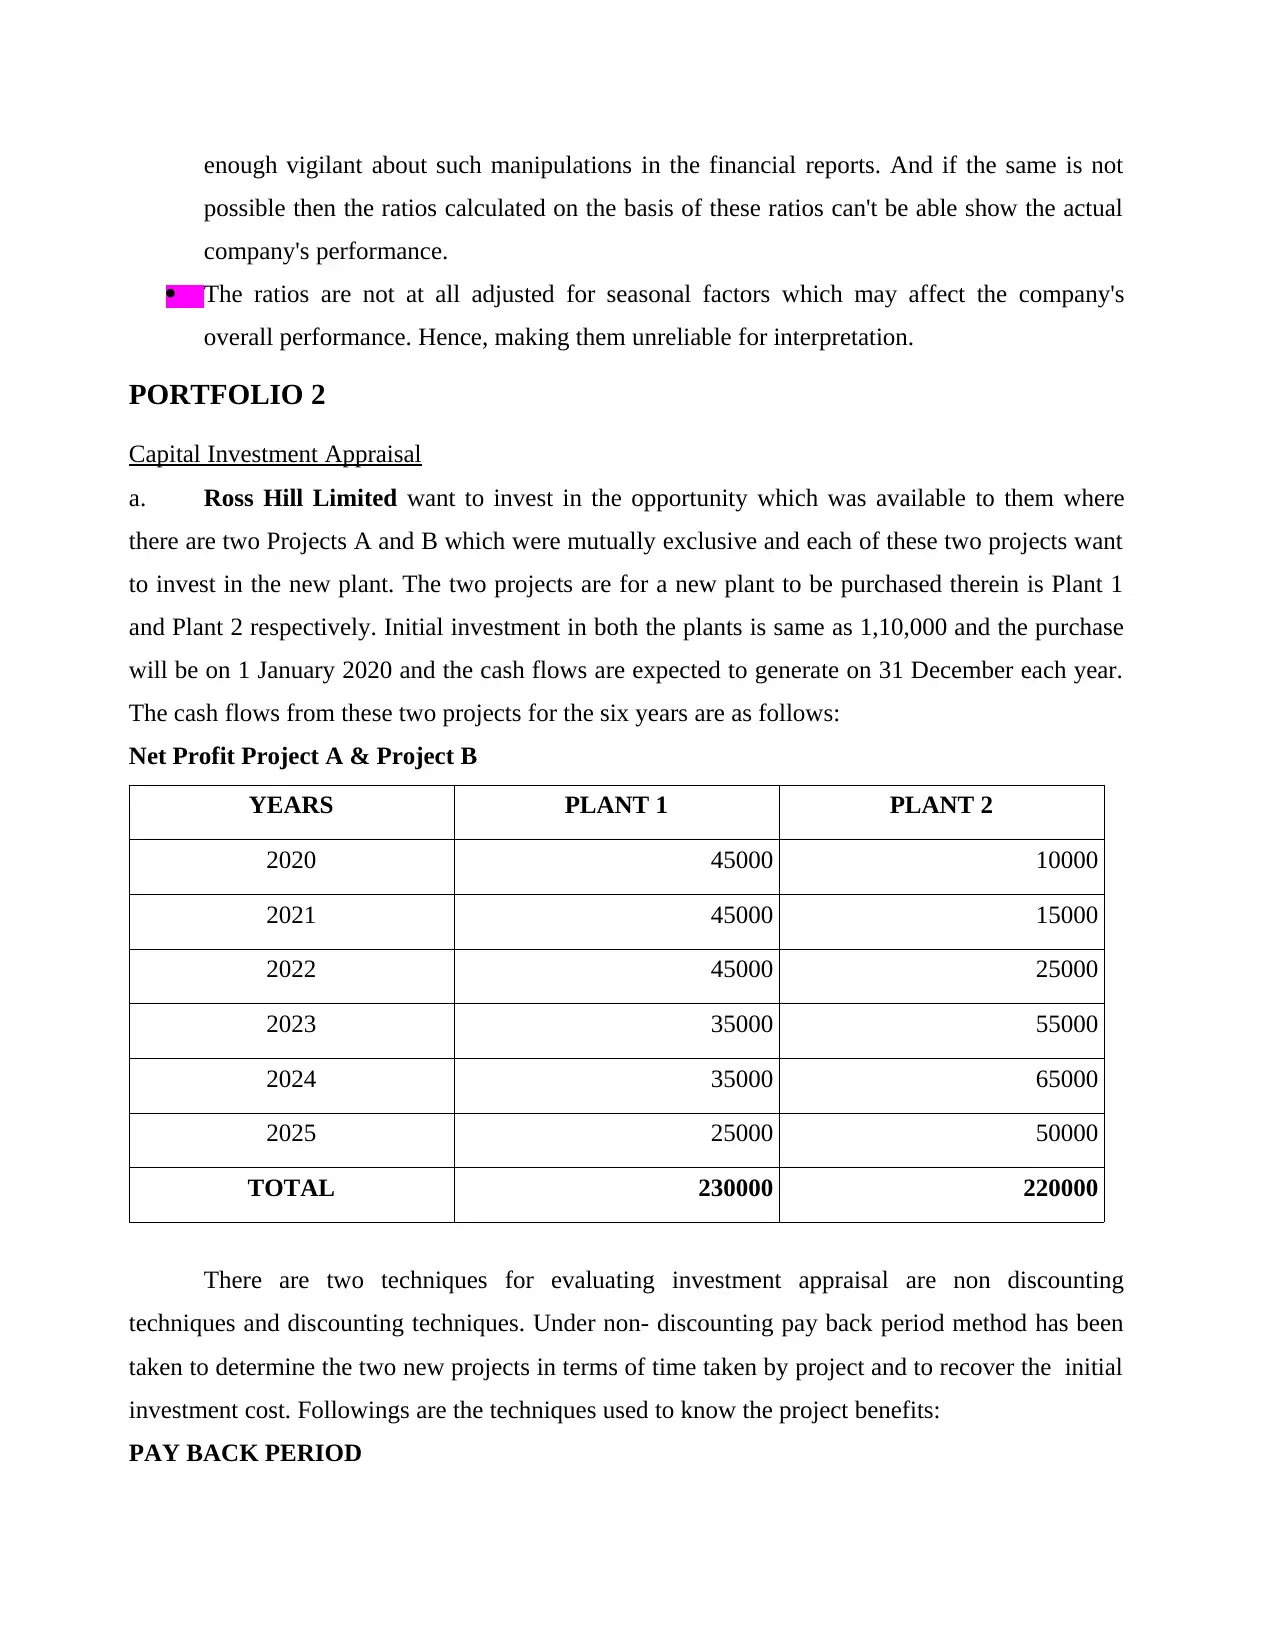
The ratios are not at all adjusted for seasonal factors which may affect the company's
overall performance. Hence, making them unreliable for interpretation.
PORTFOLIO 2
Capital Investment Appraisal
a. Ross Hill Limited want to invest in the opportunity which was available to them where
there are two Projects A and B which were mutually exclusive and each of these two projects want
to invest in the new plant. The two projects are for a new plant to be purchased therein is Plant 1
and Plant 2 respectively. Initial investment in both the plants is same as 1,10,000 and the purchase
will be on 1 January 2020 and the cash flows are expected to generate on 31 December each year.
The cash flows from these two projects for the six years are as follows:
Net Profit Project A & Project B
YEARS PLANT 1 PLANT 2
2020 45000 10000
2021 45000 15000
2022 45000 25000
2023 35000 55000
2024 35000 65000
2025 25000 50000
TOTAL 230000 220000
There are two techniques for evaluating investment appraisal are non discounting
techniques and discounting techniques. Under non- discounting pay back period method has been
taken to determine the two new projects in terms of time taken by project and to recover the initial
investment cost. Followings are the techniques used to know the project benefits:
PAY BACK PERIOD
possible then the ratios calculated on the basis of these ratios can't be able show the actual
company's performance.
The ratios are not at all adjusted for seasonal factors which may affect the company's
overall performance. Hence, making them unreliable for interpretation.
PORTFOLIO 2
Capital Investment Appraisal
a. Ross Hill Limited want to invest in the opportunity which was available to them where
there are two Projects A and B which were mutually exclusive and each of these two projects want
to invest in the new plant. The two projects are for a new plant to be purchased therein is Plant 1
and Plant 2 respectively. Initial investment in both the plants is same as 1,10,000 and the purchase
will be on 1 January 2020 and the cash flows are expected to generate on 31 December each year.
The cash flows from these two projects for the six years are as follows:
Net Profit Project A & Project B
YEARS PLANT 1 PLANT 2
2020 45000 10000
2021 45000 15000
2022 45000 25000
2023 35000 55000
2024 35000 65000
2025 25000 50000
TOTAL 230000 220000
There are two techniques for evaluating investment appraisal are non discounting
techniques and discounting techniques. Under non- discounting pay back period method has been
taken to determine the two new projects in terms of time taken by project and to recover the initial
investment cost. Followings are the techniques used to know the project benefits:
PAY BACK PERIOD
Paraphrase This Document
Need a fresh take? Get an instant paraphrase of this document with our AI Paraphraser
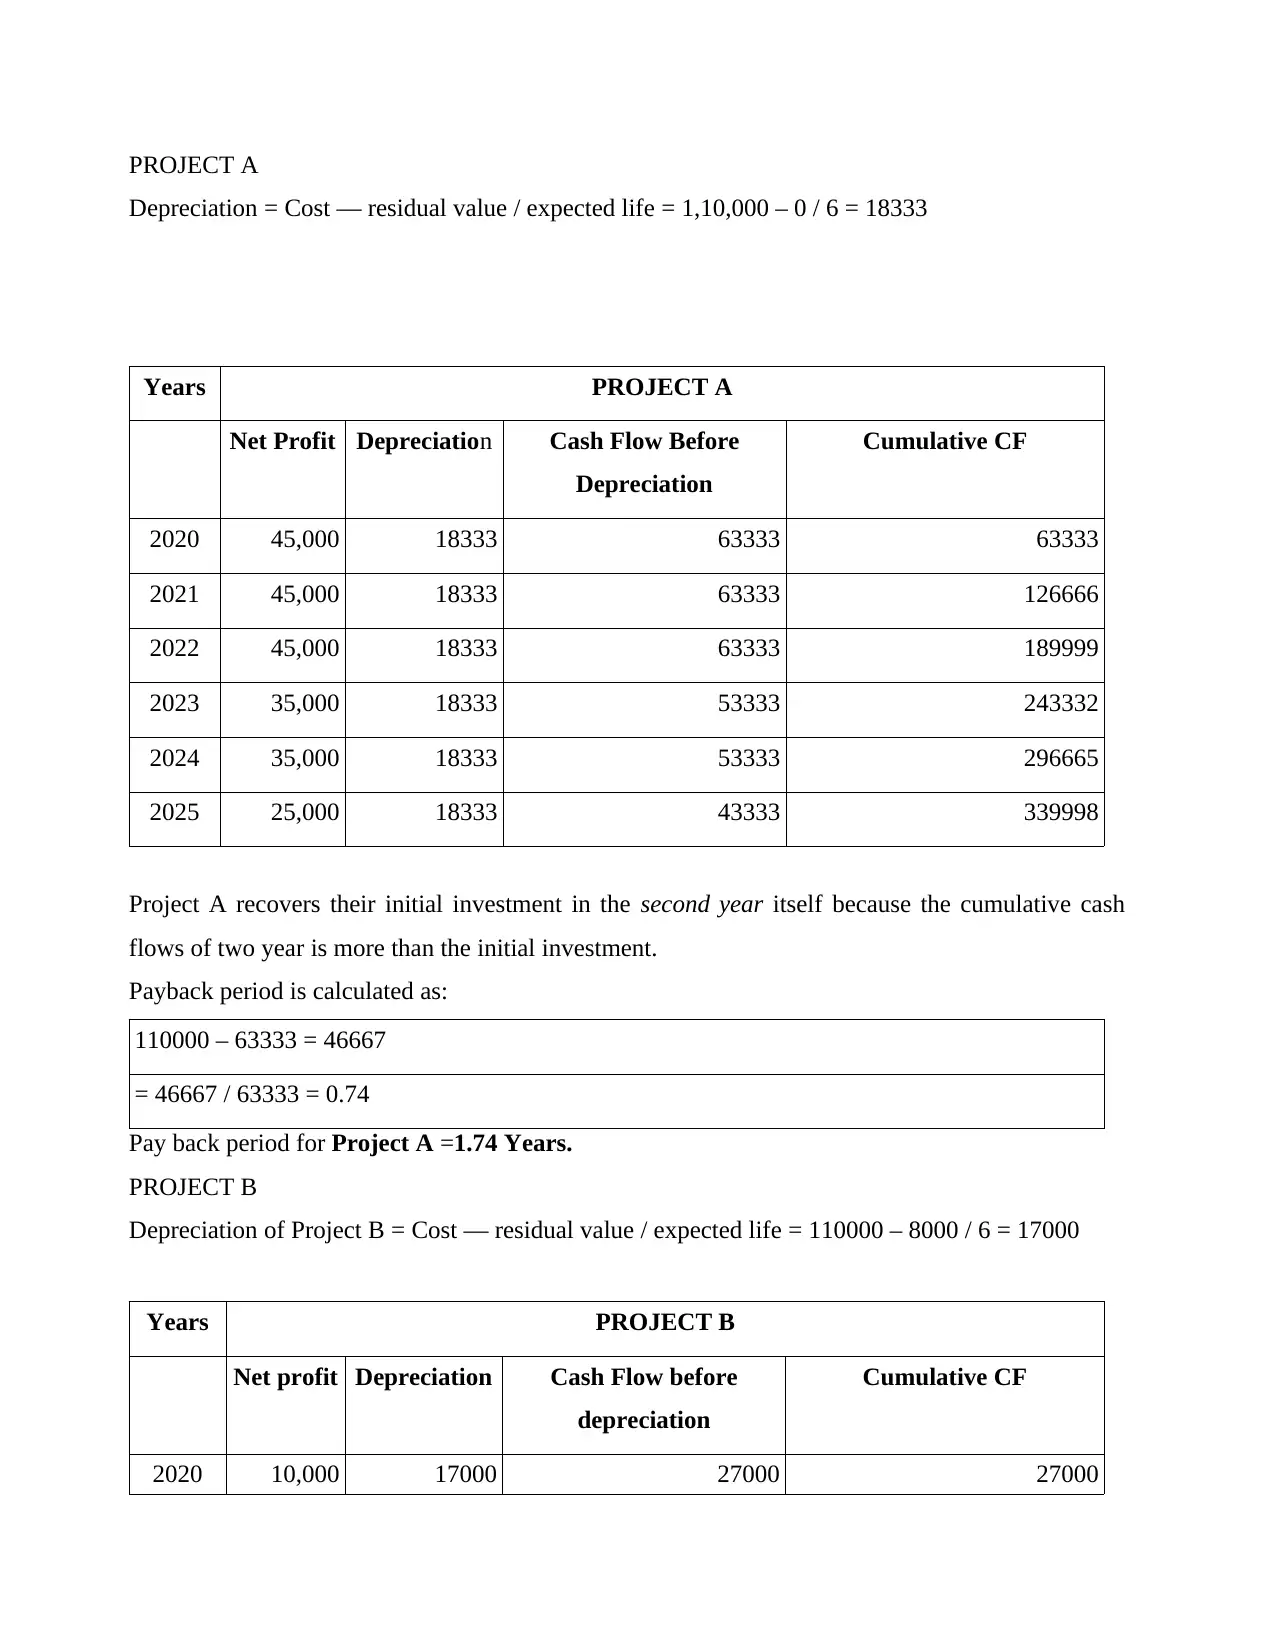
PROJECT A
Depreciation = Cost — residual value / expected life = 1,10,000 – 0 / 6 = 18333
Years PROJECT A
Net Profit Depreciation Cash Flow Before
Depreciation
Cumulative CF
2020 45,000 18333 63333 63333
2021 45,000 18333 63333 126666
2022 45,000 18333 63333 189999
2023 35,000 18333 53333 243332
2024 35,000 18333 53333 296665
2025 25,000 18333 43333 339998
Project A recovers their initial investment in the second year itself because the cumulative cash
flows of two year is more than the initial investment.
Payback period is calculated as:
110000 – 63333 = 46667
= 46667 / 63333 = 0.74
Pay back period for Project A =1.74 Years.
PROJECT B
Depreciation of Project B = Cost — residual value / expected life = 110000 – 8000 / 6 = 17000
Years PROJECT B
Net profit Depreciation Cash Flow before
depreciation
Cumulative CF
2020 10,000 17000 27000 27000
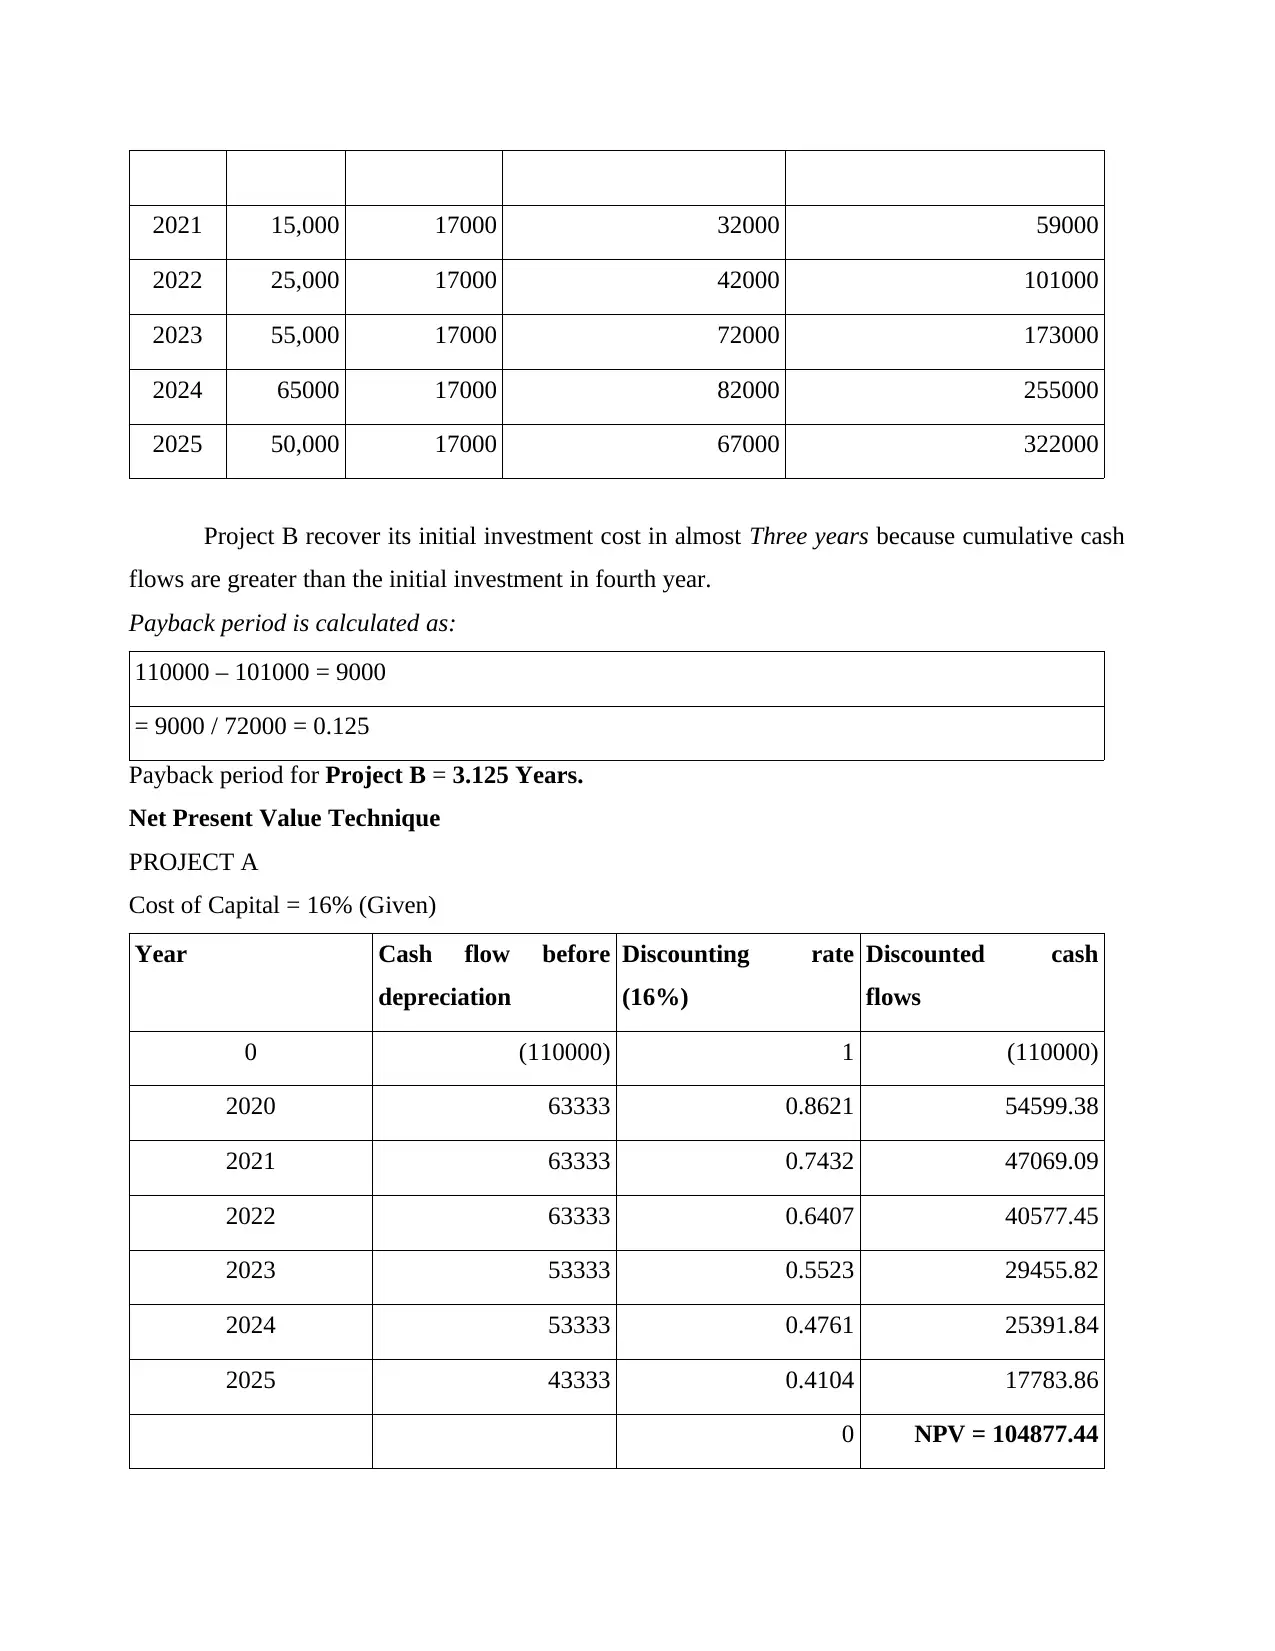
2021 15,000 17000 32000 59000
2022 25,000 17000 42000 101000
2023 55,000 17000 72000 173000
2024 65000 17000 82000 255000
2025 50,000 17000 67000 322000
Project B recover its initial investment cost in almost Three years because cumulative cash
flows are greater than the initial investment in fourth year.
Payback period is calculated as:
110000 – 101000 = 9000
= 9000 / 72000 = 0.125
Payback period for Project B = 3.125 Years.
Net Present Value Technique
PROJECT A
Cost of Capital = 16% (Given)
Year Cash flow before
depreciation
Discounting rate
(16%)
Discounted cash
flows
0 (110000) 1 (110000)
2020 63333 0.8621 54599.38
2021 63333 0.7432 47069.09
2022 63333 0.6407 40577.45
2023 53333 0.5523 29455.82
2024 53333 0.4761 25391.84
2025 43333 0.4104 17783.86
0 NPV = 104877.44
⊘ This is a preview!⊘
Do you want full access?
Subscribe today to unlock all pages.
Trusted by 1+ million students worldwide
1 out of 17
Related Documents


Your All-in-One AI-Powered Toolkit for Academic Success.
+13062052269
info@desklib.com
Available 24*7 on WhatsApp / Email
![[object Object]](/_next/static/media/star-bottom.7253800d.svg)
Unlock your academic potential
Copyright © 2020–2026 A2Z Services. All Rights Reserved. Developed and managed by ZUCOL.