Tesco and Sainsbury: Finance Report on Ratio Analysis and Investment
VerifiedAdded on 2022/12/30
|19
|3991
|77
Report
AI Summary
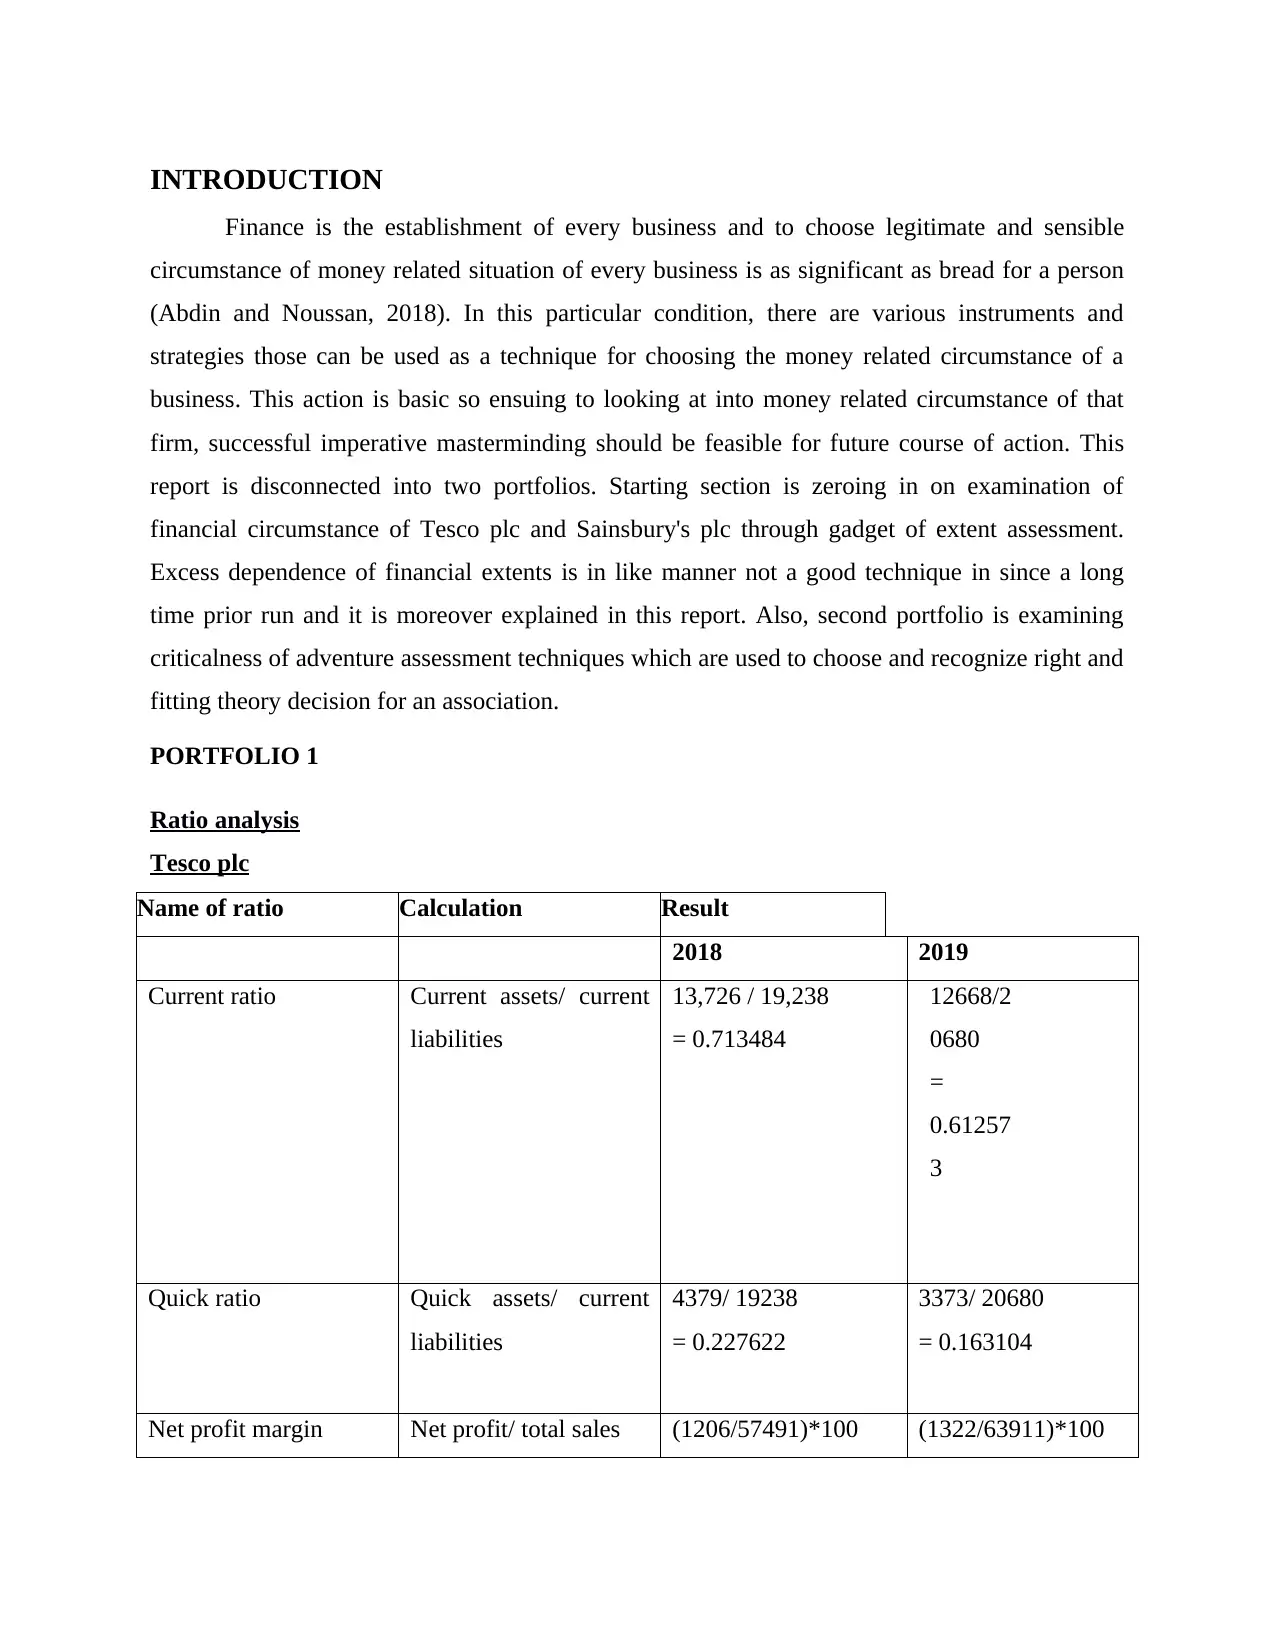
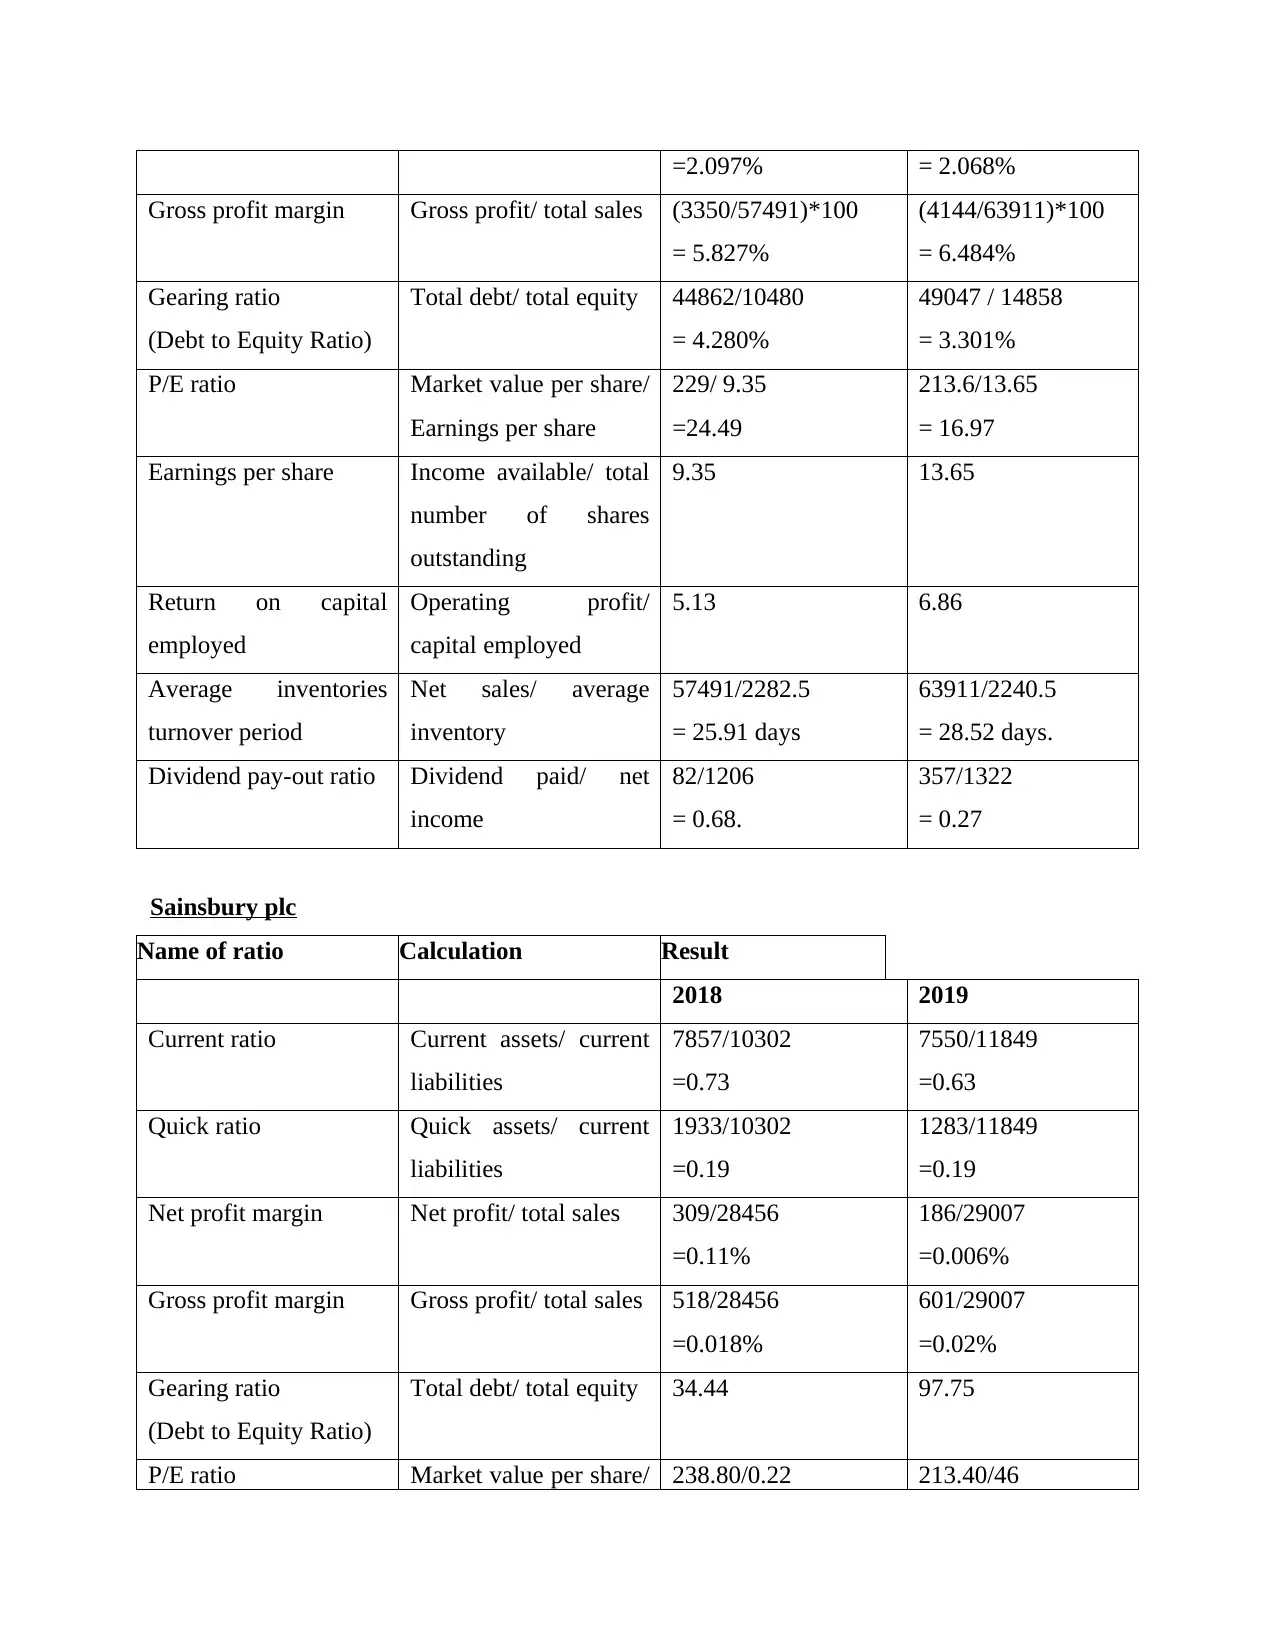
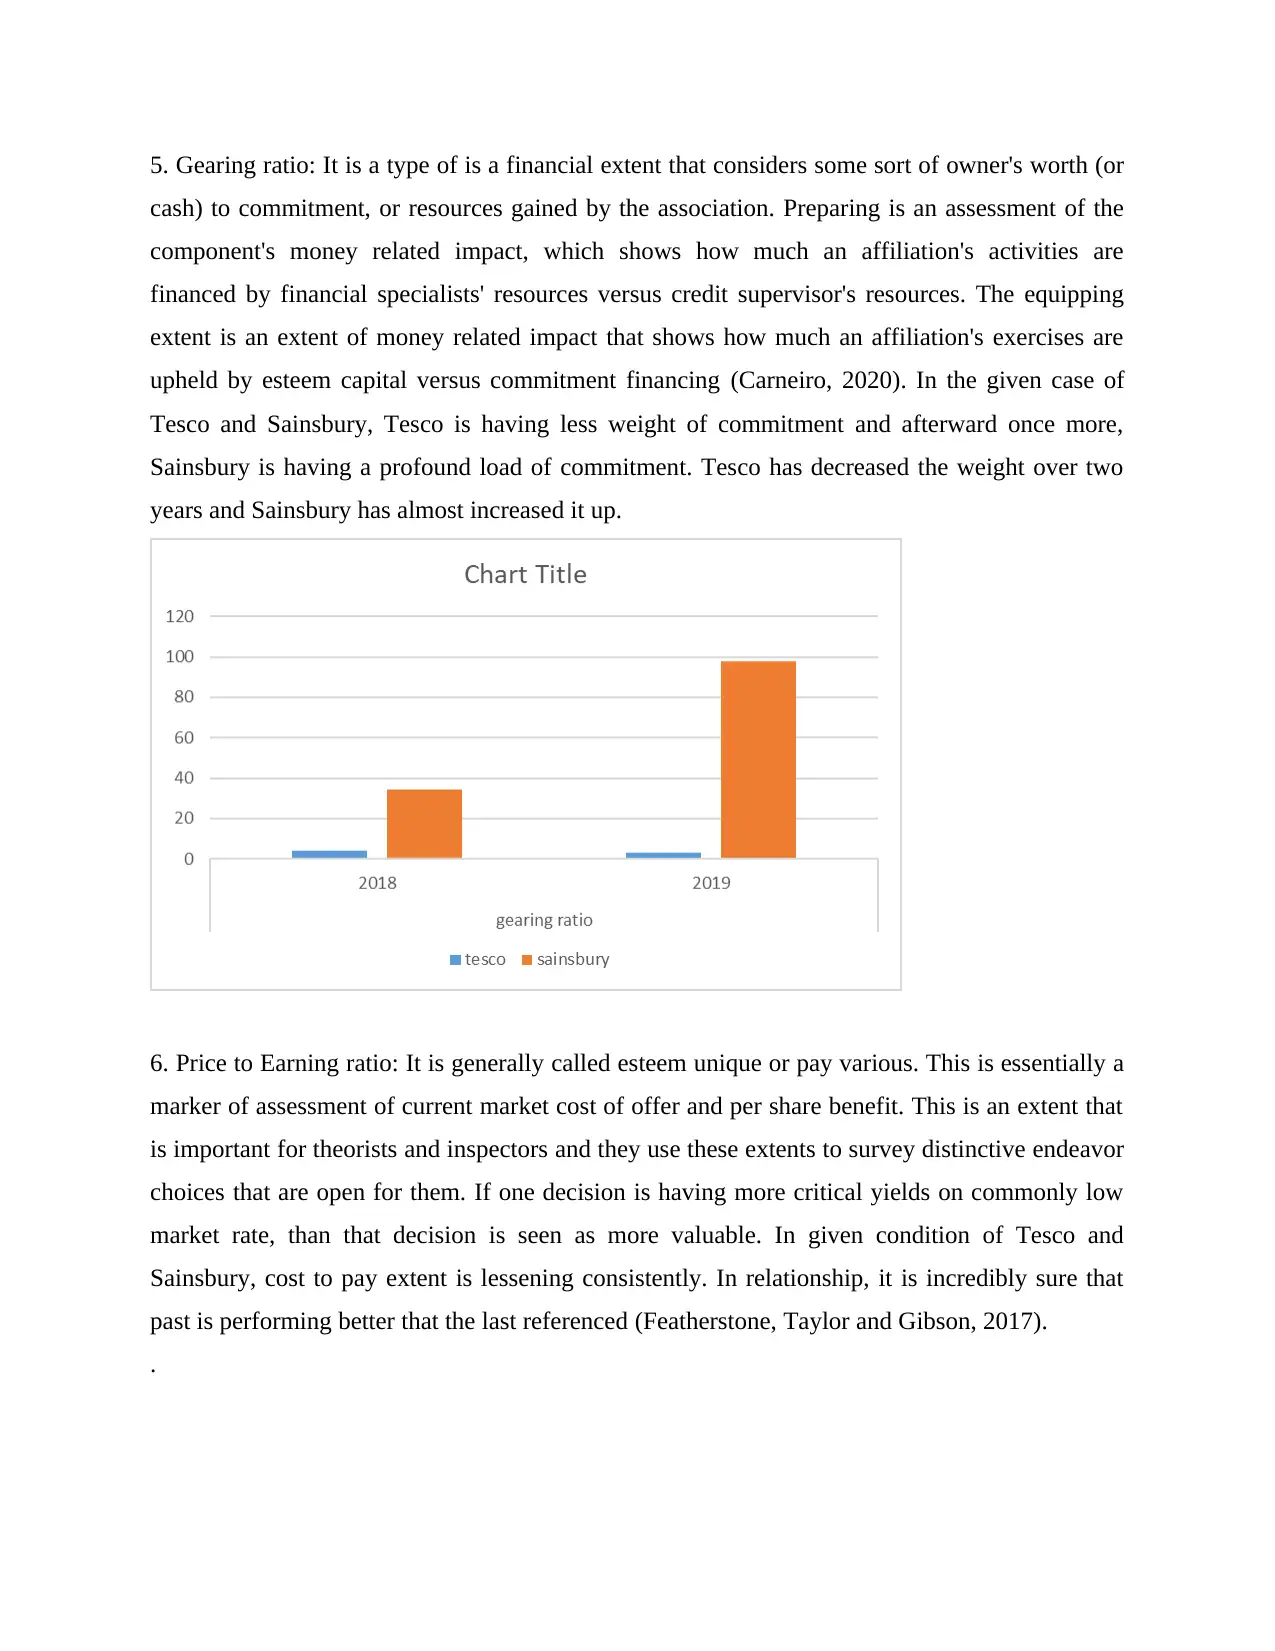
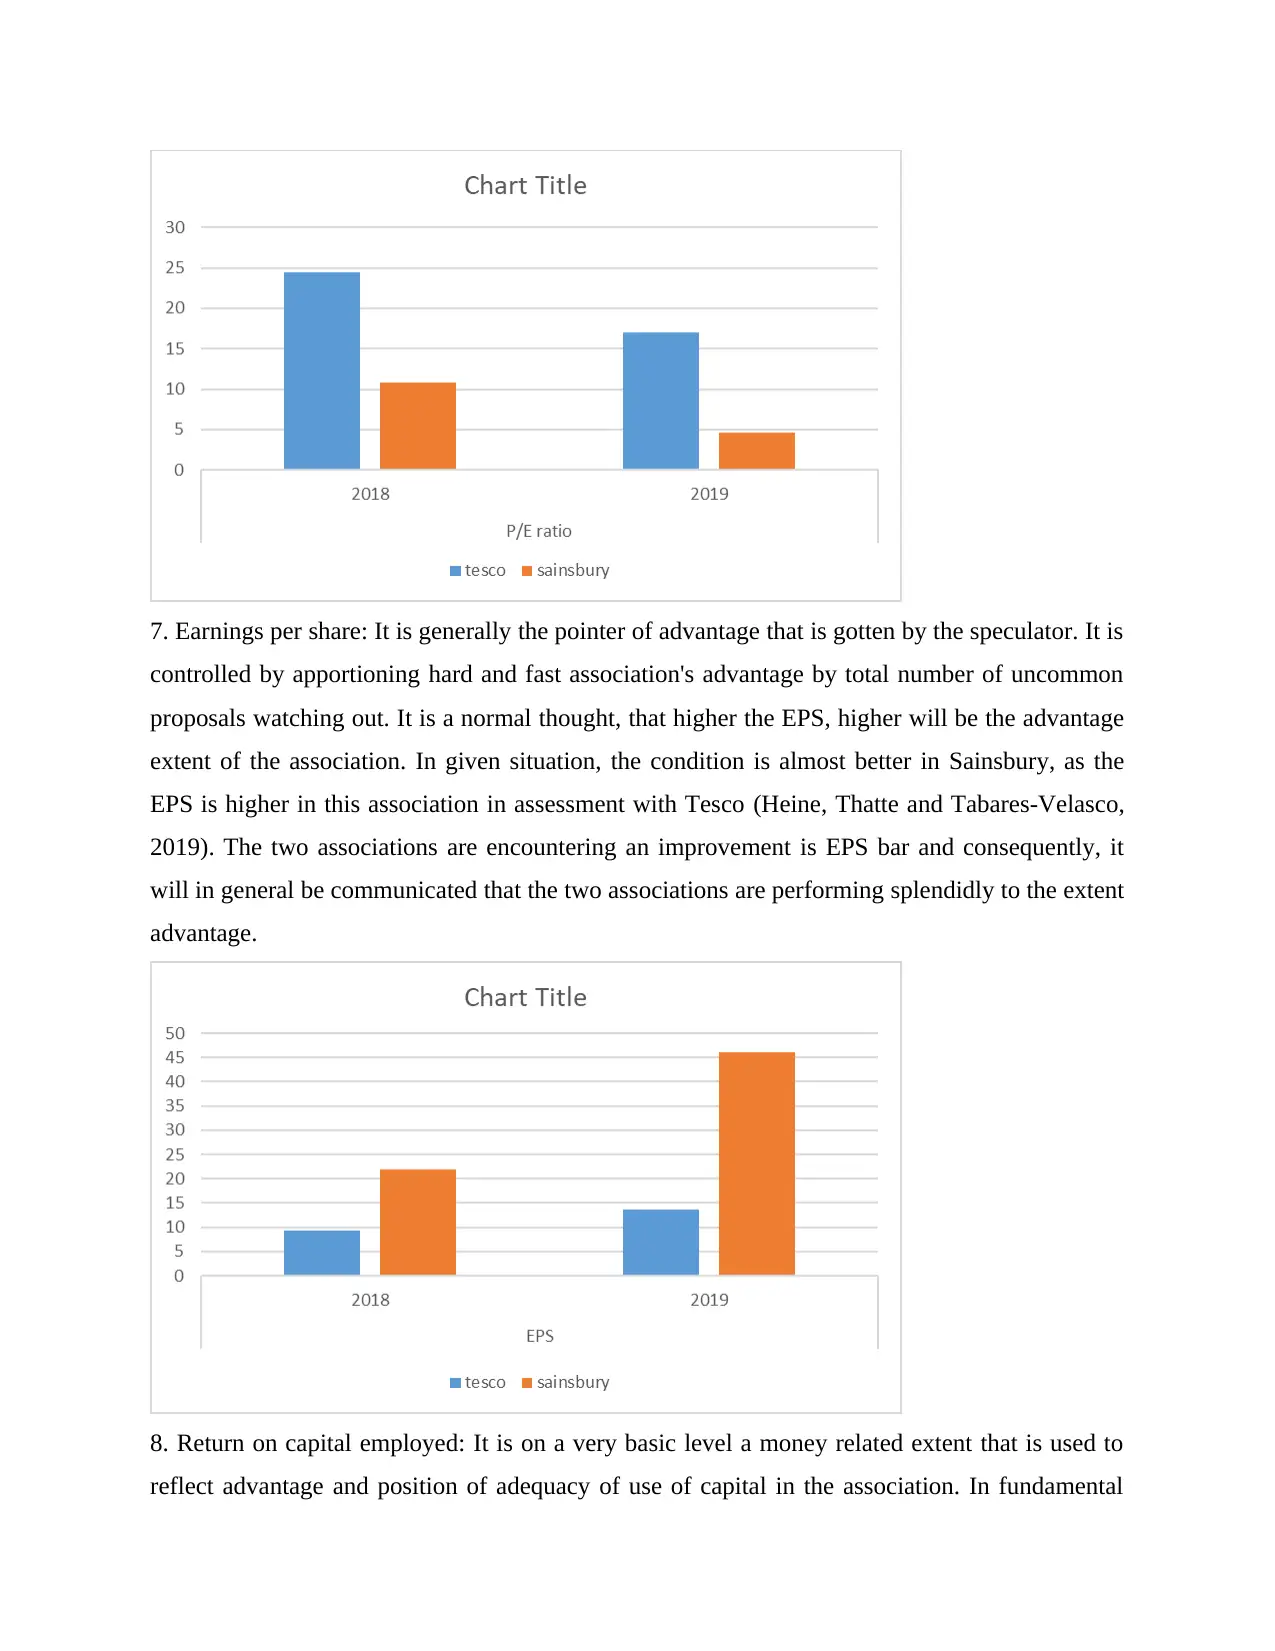
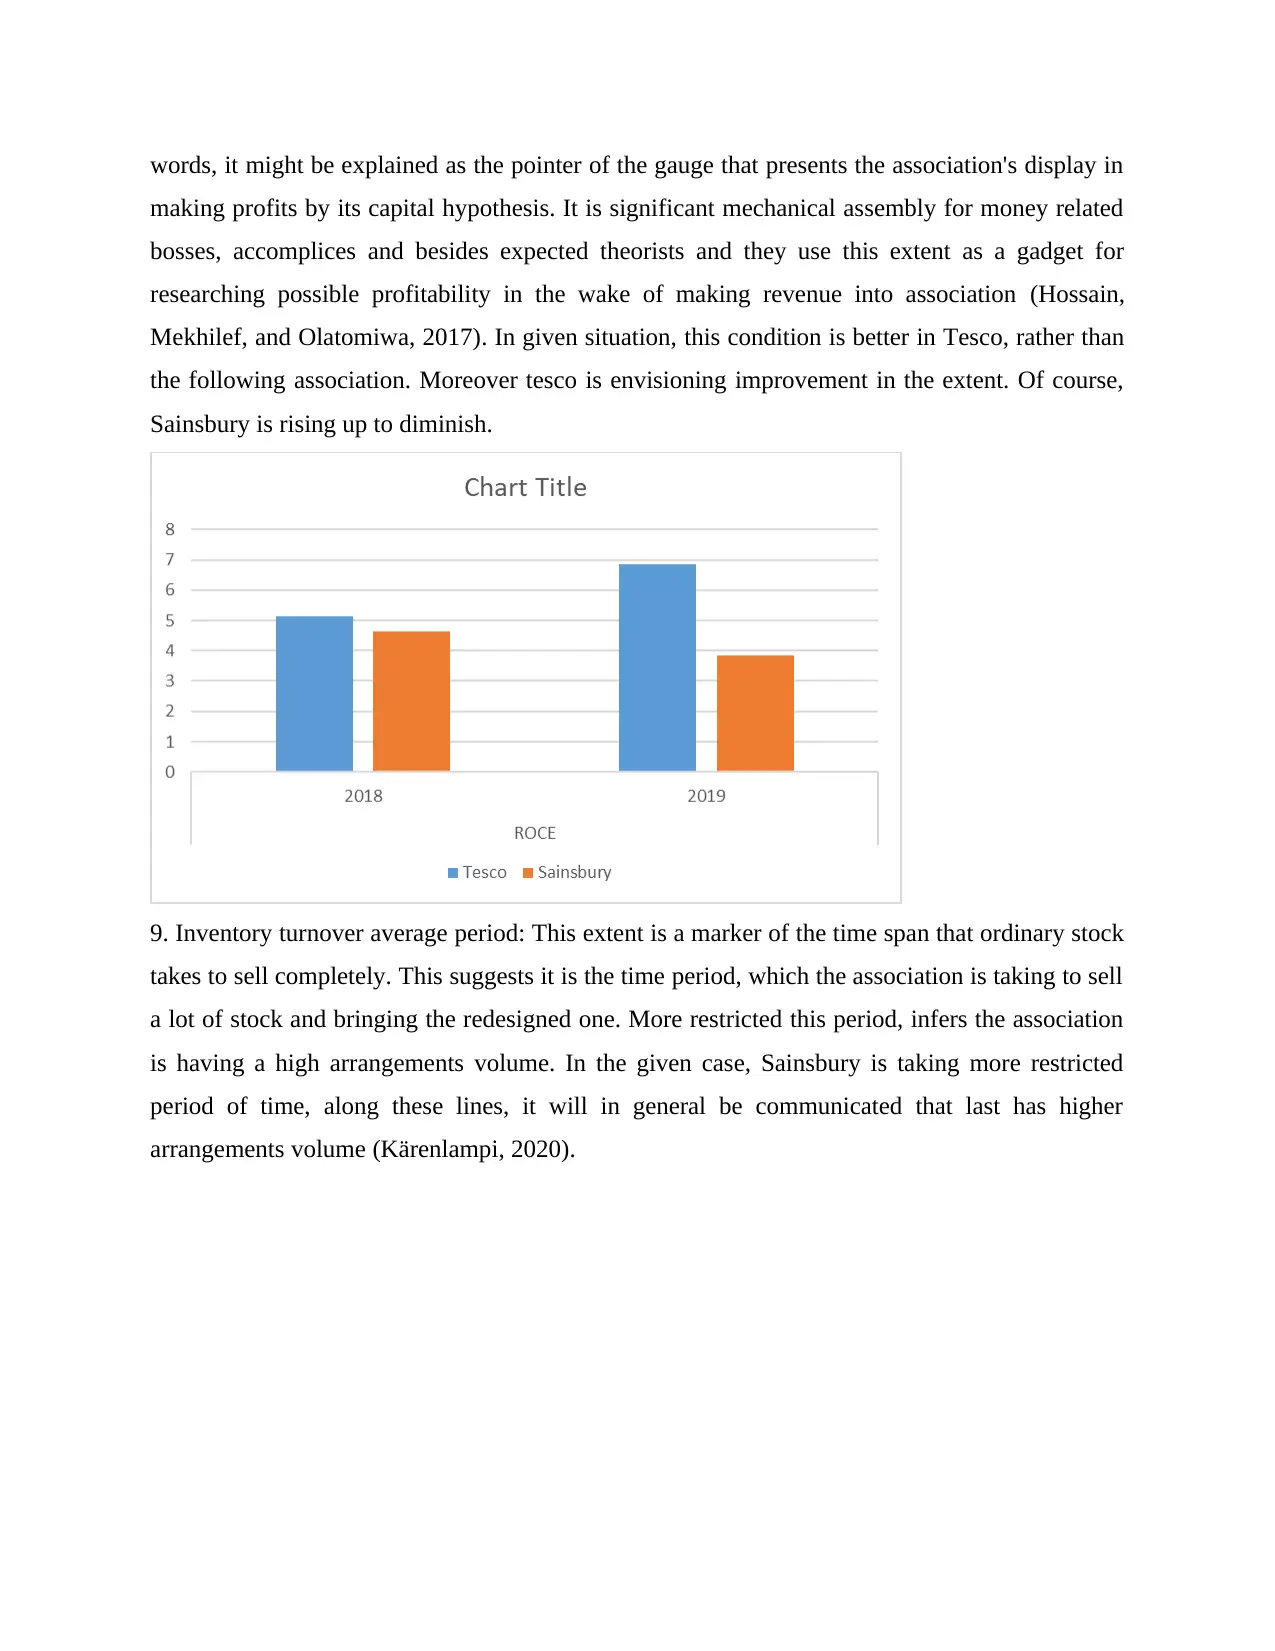
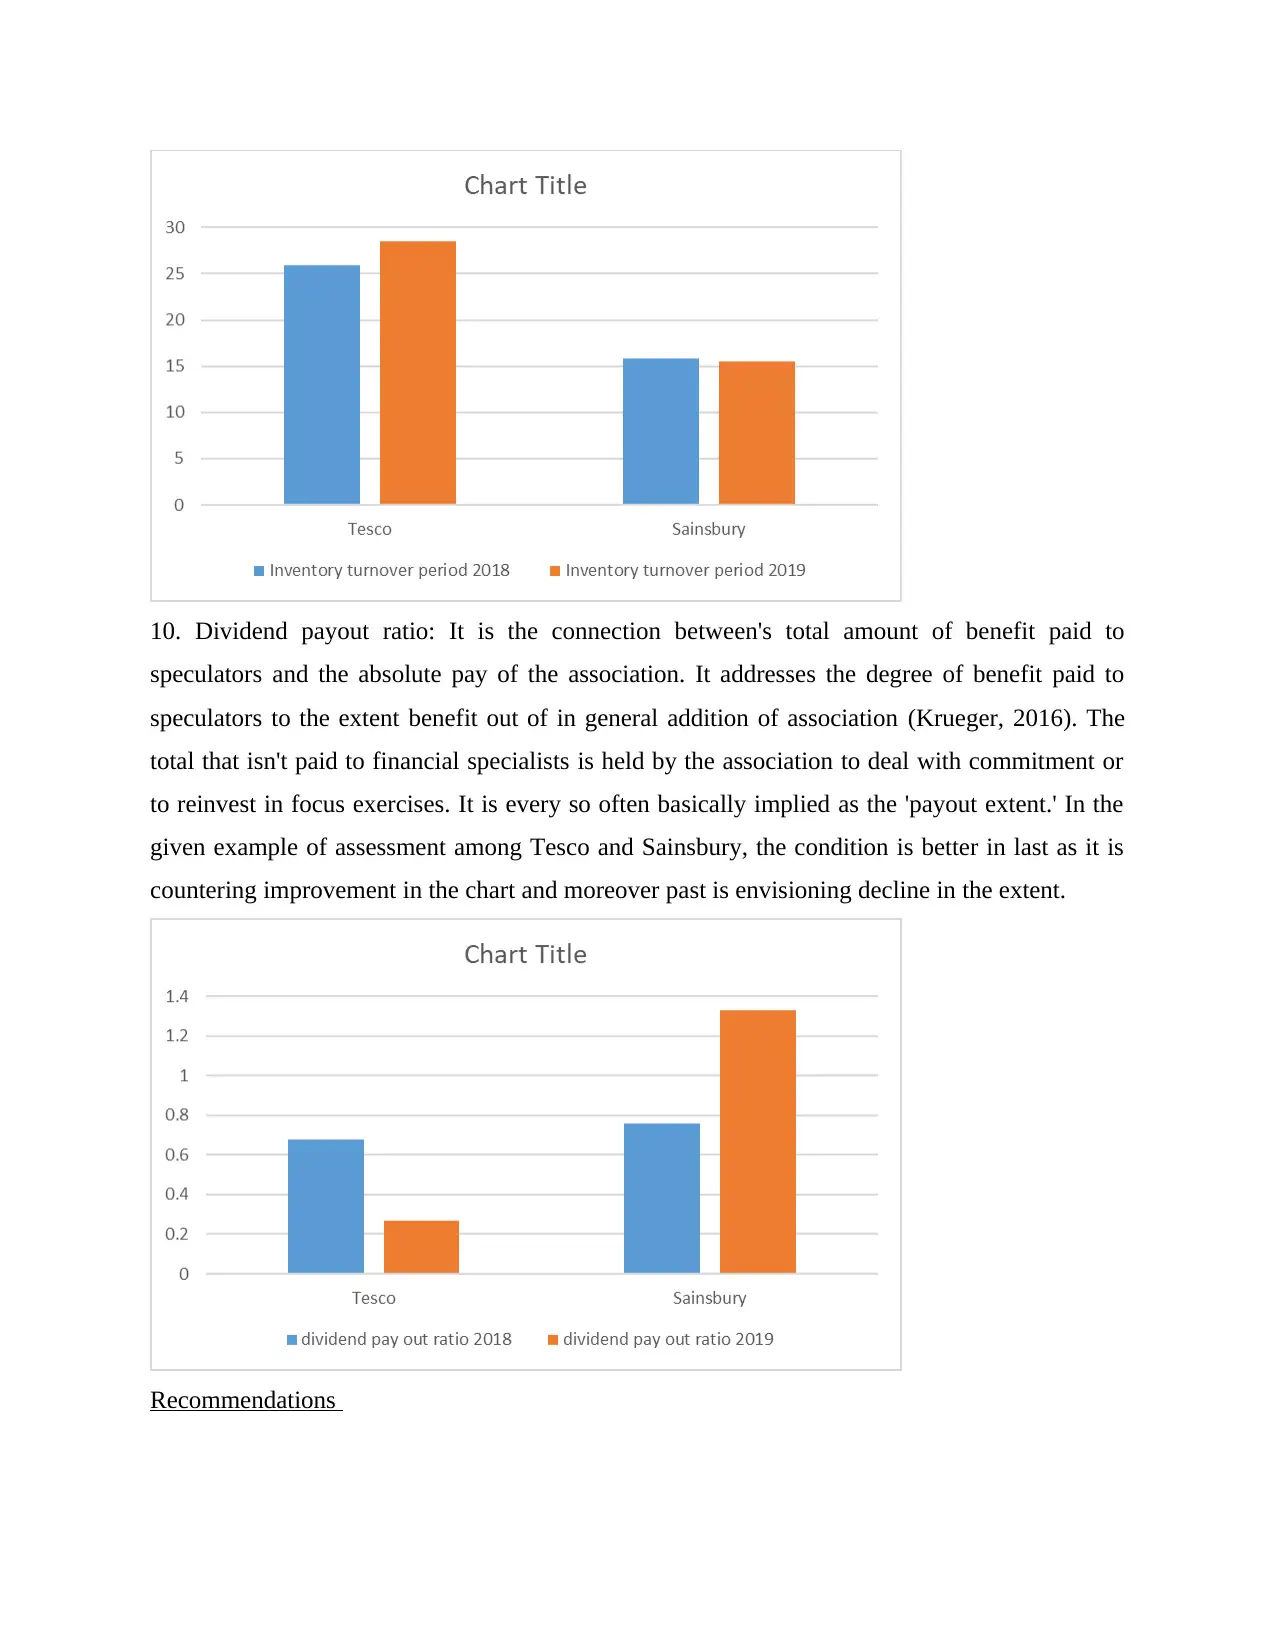
This report provides a comprehensive analysis of the financial performance of Tesco plc and Sainsbury's plc, focusing on ratio analysis and investment appraisal techniques. Portfolio 1 delves into the financial situations of both companies using ratio analysis, including current ratio, quick ratio, net profit margin, gross profit margin, gearing ratio, P/E ratio, earnings per share, return on capital employed, inventory turnover period, and dividend payout ratio. The analysis compares the performance of Tesco and Sainsbury's across these metrics, offering interpretations and recommendations for improvement. Portfolio 2 examines the significance of investment appraisal techniques in making informed financial decisions. The report highlights the limitations of relying solely on investment appraisal techniques for long-term decision-making. The report concludes with recommendations for improving financial performance and liquidity, emphasizing the importance of monitoring stock levels, reducing working expenses, and assessing market demand.

Finance
Paraphrase This Document
Need a fresh take? Get an instant paraphrase of this document with our AI Paraphraser

INTRODUCTION...........................................................................................................................3
PORTFOLIO 1................................................................................................................................3
PORTFOLIO 2................................................................................................................................3
Investment Appraisal Techniques................................................................................................3
Limitation of using Investment Appraisal Techniques in long term decision making................4
REFERENCES................................................................................................................................7

INTRODUCTION
Finance is the establishment of every business and to choose legitimate and sensible
circumstance of money related situation of every business is as significant as bread for a person
(Abdin and Noussan, 2018). In this particular condition, there are various instruments and
strategies those can be used as a technique for choosing the money related circumstance of a
business. This action is basic so ensuing to looking at into money related circumstance of that
firm, successful imperative masterminding should be feasible for future course of action. This
report is disconnected into two portfolios. Starting section is zeroing in on examination of
financial circumstance of Tesco plc and Sainsbury's plc through gadget of extent assessment.
Excess dependence of financial extents is in like manner not a good technique in since a long
time prior run and it is moreover explained in this report. Also, second portfolio is examining
criticalness of adventure assessment techniques which are used to choose and recognize right and
fitting theory decision for an association.
PORTFOLIO 1
Ratio analysis
Tesco plc
Name of ratio Calculation Result
2018 2019
Current ratio Current assets/ current
liabilities
13,726 / 19,238
= 0.713484
12668/2
0680
=
0.61257
3
Quick ratio Quick assets/ current
liabilities
4379/ 19238
= 0.227622
3373/ 20680
= 0.163104
Net profit margin Net profit/ total sales (1206/57491)*100 (1322/63911)*100
⊘ This is a preview!⊘
Do you want full access?
Subscribe today to unlock all pages.

Trusted by 1+ million students worldwide

=2.097% = 2.068%
Gross profit margin Gross profit/ total sales (3350/57491)*100
= 5.827%
(4144/63911)*100
= 6.484%
Gearing ratio
(Debt to Equity Ratio)
Total debt/ total equity 44862/10480
= 4.280%
49047 / 14858
= 3.301%
P/E ratio Market value per share/
Earnings per share
229/ 9.35
=24.49
213.6/13.65
= 16.97
Earnings per share Income available/ total
number of shares
outstanding
9.35 13.65
Return on capital
employed
Operating profit/
capital employed
5.13 6.86
Average inventories
turnover period
Net sales/ average
inventory
57491/2282.5
= 25.91 days
63911/2240.5
= 28.52 days.
Dividend pay-out ratio Dividend paid/ net
income
82/1206
= 0.68.
357/1322
= 0.27
Sainsbury plc
Name of ratio Calculation Result
2018 2019
Current ratio Current assets/ current
liabilities
7857/10302
=0.73
7550/11849
=0.63
Quick ratio Quick assets/ current
liabilities
1933/10302
=0.19
1283/11849
=0.19
Net profit margin Net profit/ total sales 309/28456
=0.11%
186/29007
=0.006%
Gross profit margin Gross profit/ total sales 518/28456
=0.018%
601/29007
=0.02%
Gearing ratio
(Debt to Equity Ratio)
Total debt/ total equity 34.44 97.75
P/E ratio Market value per share/ 238.80/0.22 213.40/46
Paraphrase This Document
Need a fresh take? Get an instant paraphrase of this document with our AI Paraphraser

Earnings per share =10.85
=4.64
Earnings per share Income available/ total
number of shares
outstanding
22 46
Return on capital
employed
Operating profit/
capital employed
4.65 3.84
Average inventories
turnover period
Net sales/ average
inventory
28456/1792.5
=15.87 days.
29007/1869.5
=15.51 days.
Dividend pay-out ratio Dividend paid/ net
income
235/309
=0.76
247/186
=1.33
Interpretation
1. Current ratio: This is a proportion, in which the relation between current assets and current
liabilities is determined. This is a representation of liquid position of a business (Ambrose and
Buch, 2016). This is the measure of capacity of company to pay off their current assets its
current liabilities. This is the ability of management of a firm to clear accounts of current
liabilities using the funds received in account of current assets. Current liabilities are those who
have to be cleared down in coming one year. This paying off process is done from the funds
which are to be received in same time period of one year. In accordance of various theories and
methodologies, the ideal mark for this ratio is 2:1. In the given situation of two real companies,
Tesco and Sainsbury, the investigation into liquidity position is done for over two years and
Tesco has the ratio of 0.71 and 0.61 in the year of 2018 and 2019, respectively. On the other
hand, Sainsbury has the current ratio of 0.73 and 0.63, respectively in same time period of two
years. The situation of liquidity position is almost similar in both companies. It can be elucidated
from this situation, that both the companies are performing almost on the same level and utilizing
their working capital in similar pattern. Ratio is not as per the ideal mark and according to
results, it is low and current assets are not enough to pay out current liabilities.

2. Quick ratio: It is the relation between the quick assets and current liabilities. It is the true
presentation of true liquid postion of the company (Anish and Majhi, 2016). This proportion is
taking only pure liquid assets (often known as liquid assets) into consideration. In simple words,
it can be described as that position in which the company stands and has the capacity of paying
off the current liabilities from only the receipts of funds in the category of quick assets. Quick
assets includes only cash and cash equivalents. According to common theories and models, it is a
known fact that 1:1 is the ideal benchmark for the ratio. In the given case of Tesco and
Sainsbury, their ideal ratios are not up to the mark. The situation is better in Tesco as compared
to the other company. Though, both the companies are performing very low as compared to the
ideal benchmark.
⊘ This is a preview!⊘
Do you want full access?
Subscribe today to unlock all pages.

Trusted by 1+ million students worldwide

3. Net profit margin: It is actually the representation of company’s profitability measure. This
ratio is measuring the company’s performance in terms of value of profit generated in the
specific time period. The amount of revenue is compared to that of totral sales. The profit is
calculated through deducting the amunt of expenses from that of total amount of sales. This is
very known fact that higher the amount of profit, higher will be the profitability and financial
feasibility of a company. The amount of profit and this profit margin ratio is depending upon
number of various factors and they are indirect expenses, taxation, internal accounting policies,
such as depreciation and other expenses as well (Ascher, Li and You, 2020). In the present
situation of investigation procedure of financial performance of companies, Tesco and
Sainsbury, profitability measure is not visualising any significant increase ober the time period of
two years those have been considered for analysis. Instead, it is to be noted down that
profitability index is coming down. If comparison is done for performance of both the
companies, than it is to be stated that Tescpo is a better performer.
Paraphrase This Document
Need a fresh take? Get an instant paraphrase of this document with our AI Paraphraser

4. Gross profit margin: It is the introduction of gross productivity of the firm. Around the day's
end, it will when all is said in done be clarified as the pointer of execution of affiliation going
before causing naughty costs (Basher and Raboy, 2018). As the name proposes, it tends to net
benefit of the affiliation and its root execution. The standard factor that impacts this degree of
benefit is deals volume and direct costs in the firm. In given illustration of guaranteed
affiliations, execution of the two affiliations is declining, in any case in association it will as a
rule be conveyed that Tesco is acting in a way that is better than Sainsbury.

5. Gearing ratio: It is a type of is a financial extent that considers some sort of owner's worth (or
cash) to commitment, or resources gained by the association. Preparing is an assessment of the
component's money related impact, which shows how much an affiliation's activities are
financed by financial specialists' resources versus credit supervisor's resources. The equipping
extent is an extent of money related impact that shows how much an affiliation's exercises are
upheld by esteem capital versus commitment financing (Carneiro, 2020). In the given case of
Tesco and Sainsbury, Tesco is having less weight of commitment and afterward once more,
Sainsbury is having a profound load of commitment. Tesco has decreased the weight over two
years and Sainsbury has almost increased it up.
6. Price to Earning ratio: It is generally called esteem unique or pay various. This is essentially a
marker of assessment of current market cost of offer and per share benefit. This is an extent that
is important for theorists and inspectors and they use these extents to survey distinctive endeavor
choices that are open for them. If one decision is having more critical yields on commonly low
market rate, than that decision is seen as more valuable. In given condition of Tesco and
Sainsbury, cost to pay extent is lessening consistently. In relationship, it is incredibly sure that
past is performing better that the last referenced (Featherstone, Taylor and Gibson, 2017).
.
⊘ This is a preview!⊘
Do you want full access?
Subscribe today to unlock all pages.

Trusted by 1+ million students worldwide

7. Earnings per share: It is generally the pointer of advantage that is gotten by the speculator. It is
controlled by apportioning hard and fast association's advantage by total number of uncommon
proposals watching out. It is a normal thought, that higher the EPS, higher will be the advantage
extent of the association. In given situation, the condition is almost better in Sainsbury, as the
EPS is higher in this association in assessment with Tesco (Heine, Thatte and Tabares-Velasco,
2019). The two associations are encountering an improvement is EPS bar and consequently, it
will in general be communicated that the two associations are performing splendidly to the extent
advantage.
8. Return on capital employed: It is on a very basic level a money related extent that is used to
reflect advantage and position of adequacy of use of capital in the association. In fundamental
Paraphrase This Document
Need a fresh take? Get an instant paraphrase of this document with our AI Paraphraser

words, it might be explained as the pointer of the gauge that presents the association's display in
making profits by its capital hypothesis. It is significant mechanical assembly for money related
bosses, accomplices and besides expected theorists and they use this extent as a gadget for
researching possible profitability in the wake of making revenue into association (Hossain,
Mekhilef, and Olatomiwa, 2017). In given situation, this condition is better in Tesco, rather than
the following association. Moreover tesco is envisioning improvement in the extent. Of course,
Sainsbury is rising up to diminish.
9. Inventory turnover average period: This extent is a marker of the time span that ordinary stock
takes to sell completely. This suggests it is the time period, which the association is taking to sell
a lot of stock and bringing the redesigned one. More restricted this period, infers the association
is having a high arrangements volume. In the given case, Sainsbury is taking more restricted
period of time, along these lines, it will in general be communicated that last has higher
arrangements volume (Kärenlampi, 2020).

10. Dividend payout ratio: It is the connection between's total amount of benefit paid to
speculators and the absolute pay of the association. It addresses the degree of benefit paid to
speculators to the extent benefit out of in general addition of association (Krueger, 2016). The
total that isn't paid to financial specialists is held by the association to deal with commitment or
to reinvest in focus exercises. It is every so often basically implied as the 'payout extent.' In the
given example of assessment among Tesco and Sainsbury, the condition is better in last as it is
countering improvement in the chart and moreover past is envisioning decline in the extent.
Recommendations
⊘ This is a preview!⊘
Do you want full access?
Subscribe today to unlock all pages.

Trusted by 1+ million students worldwide
1 out of 19
Related Documents

Your All-in-One AI-Powered Toolkit for Academic Success.
+13062052269
info@desklib.com
Available 24*7 on WhatsApp / Email
Unlock your academic potential
Copyright © 2020–2025 A2Z Services. All Rights Reserved. Developed and managed by ZUCOL.