Comprehensive Finance Assignment Solution: Analysis and Calculations
VerifiedAdded on 2020/03/16
|11
|1640
|128
Homework Assignment
AI Summary
This finance assignment solution provides detailed calculations and analysis for various financial concepts. It includes the calculation of Weighted Average Cost of Capital (WACC) for different divisions, forecasting of Free Cash Flow (FCF) without expansion, and present value calculations. The solution also covers the impact of expansion on Net Present Value (NPV), value of abandonment, and economic depreciation. Furthermore, it addresses shareholders' concerns regarding Earnings per Share (EPS) and dividend per share, discusses the impact of long-term incentives and provides recommendations on dividend policies. The assignment analyzes financial statements, investment strategies, and provides insights into capital budgeting decisions.
Running Head: FINANCE
Finance
Name of the Student:
Name of the University:
Authors Note:
Finance
Name of the Student:
Name of the University:
Authors Note:
Paraphrase This Document
Need a fresh take? Get an instant paraphrase of this document with our AI Paraphraser
1FINANCE
Table of Contents
Answer 1:.........................................................................................................................................2
Answer 2:.........................................................................................................................................2
Answer 3:.........................................................................................................................................2
Answer 4:.........................................................................................................................................2
Answer 5:.........................................................................................................................................3
Answer 6:.........................................................................................................................................5
Answer 7:.........................................................................................................................................5
Answer 8:.........................................................................................................................................6
Answer 9:.........................................................................................................................................6
Answer 10:.......................................................................................................................................6
Answer 11:.......................................................................................................................................7
Answer 12:.......................................................................................................................................7
Answer 13:.......................................................................................................................................7
Answer 14:.......................................................................................................................................7
Answer 15:.......................................................................................................................................8
Answer 16:.......................................................................................................................................8
Answer 17:.......................................................................................................................................8
References:......................................................................................................................................9
2FINANCE
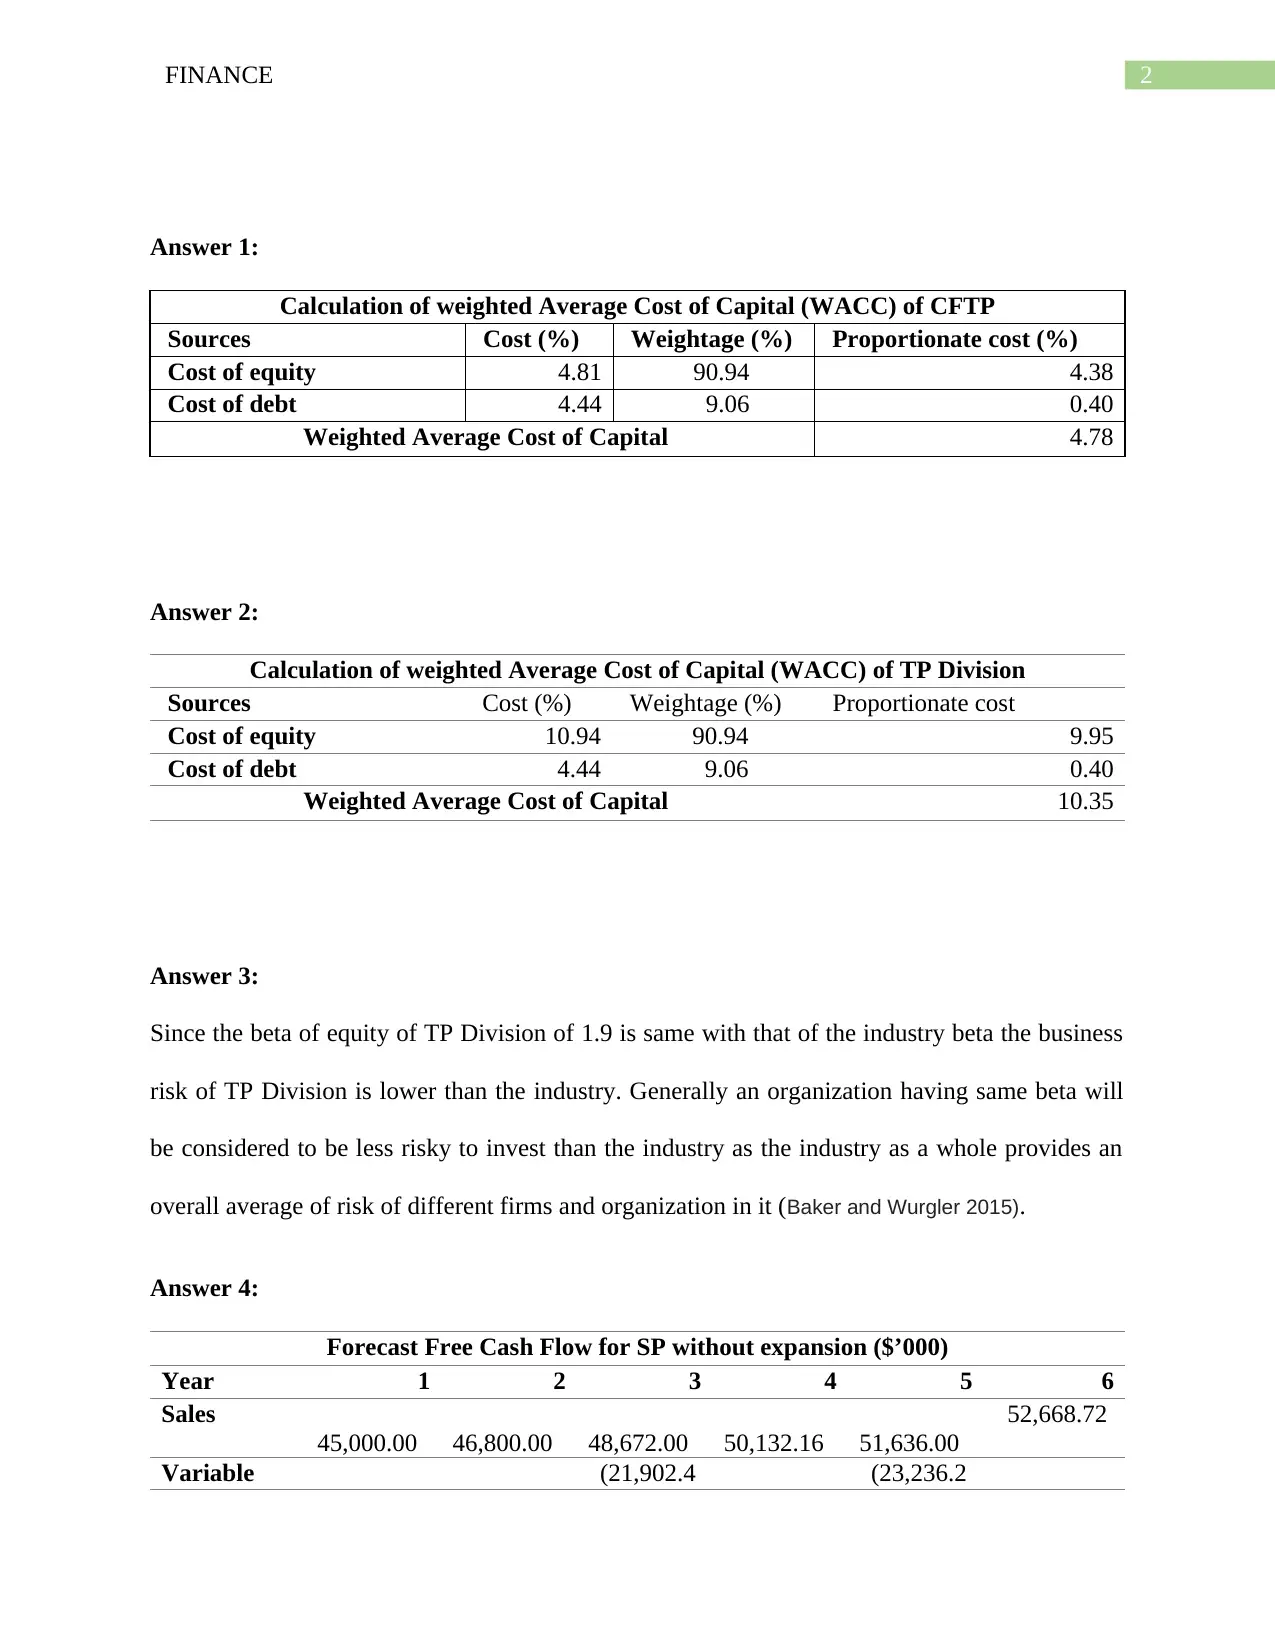
Answer 1:
Calculation of weighted Average Cost of Capital (WACC) of CFTP
Sources Cost (%) Weightage (%) Proportionate cost (%)
Cost of equity 4.81 90.94 4.38
Cost of debt 4.44 9.06 0.40
Weighted Average Cost of Capital 4.78
Answer 2:
Calculation of weighted Average Cost of Capital (WACC) of TP Division
Sources Cost (%) Weightage (%) Proportionate cost
Cost of equity 10.94 90.94 9.95
Cost of debt 4.44 9.06 0.40
Weighted Average Cost of Capital 10.35
Answer 3:
Since the beta of equity of TP Division of 1.9 is same with that of the industry beta the business
risk of TP Division is lower than the industry. Generally an organization having same beta will
be considered to be less risky to invest than the industry as the industry as a whole provides an
overall average of risk of different firms and organization in it (Baker and Wurgler 2015).
Answer 4:
Forecast Free Cash Flow for SP without expansion ($’000)
Year 1 2 3 4 5 6
Sales
45,000.00 46,800.00 48,672.00 50,132.16 51,636.00
52,668.72
Variable (21,902.4 (23,236.2
⊘ This is a preview!⊘
Do you want full access?
Subscribe today to unlock all pages.
Trusted by 1+ million students worldwide
3FINANCE
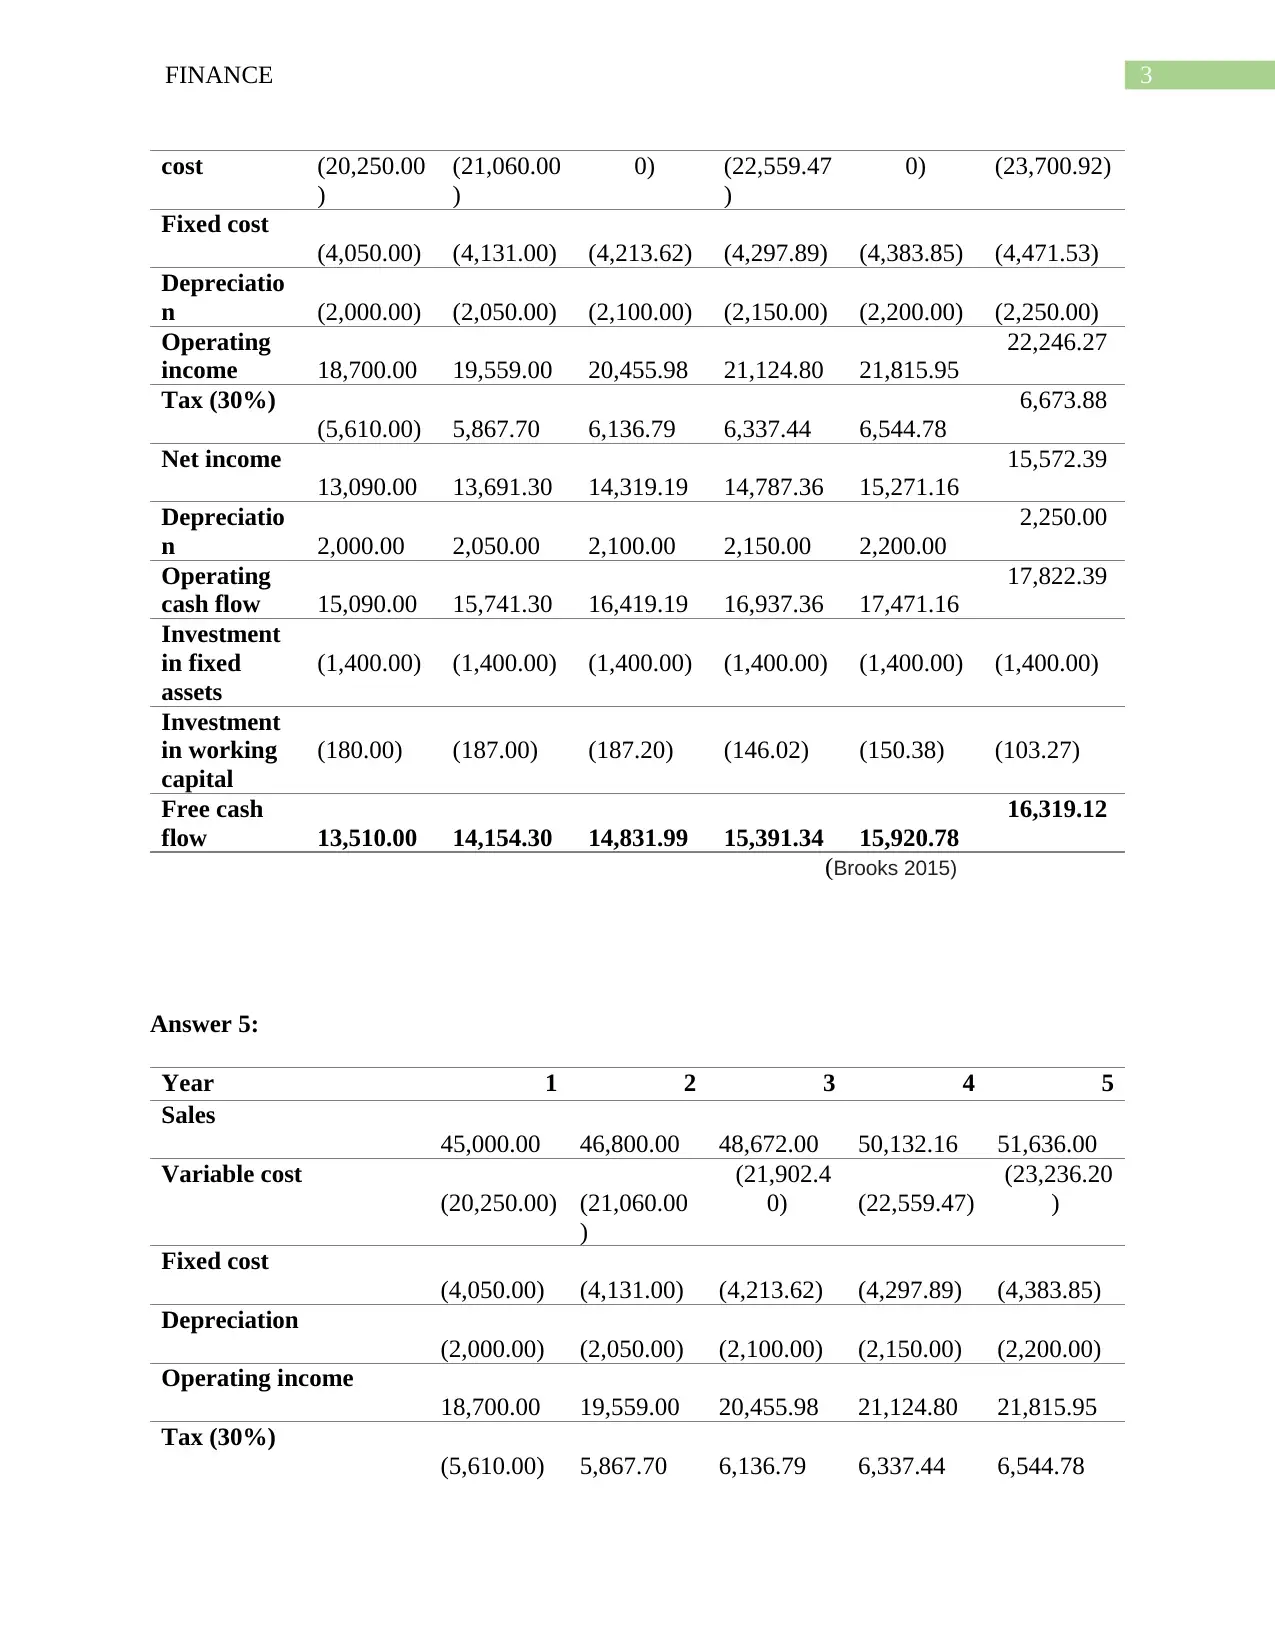
cost (20,250.00
)
(21,060.00
)
0) (22,559.47
)
0) (23,700.92)
Fixed cost
(4,050.00) (4,131.00) (4,213.62) (4,297.89) (4,383.85) (4,471.53)
Depreciatio
n (2,000.00) (2,050.00) (2,100.00) (2,150.00) (2,200.00) (2,250.00)
Operating
income 18,700.00 19,559.00 20,455.98 21,124.80 21,815.95
22,246.27
Tax (30%)
(5,610.00) 5,867.70 6,136.79 6,337.44 6,544.78
6,673.88
Net income
13,090.00 13,691.30 14,319.19 14,787.36 15,271.16
15,572.39
Depreciatio
n 2,000.00 2,050.00 2,100.00 2,150.00 2,200.00
2,250.00
Operating
cash flow 15,090.00 15,741.30 16,419.19 16,937.36 17,471.16
17,822.39
Investment
in fixed
assets
(1,400.00) (1,400.00) (1,400.00) (1,400.00) (1,400.00) (1,400.00)
Investment
in working
capital
(180.00) (187.00) (187.20) (146.02) (150.38) (103.27)
Free cash
flow 13,510.00 14,154.30 14,831.99 15,391.34 15,920.78
16,319.12
(Brooks 2015)
Answer 5:
Year 1 2 3 4 5
Sales
45,000.00 46,800.00 48,672.00 50,132.16 51,636.00
Variable cost
(20,250.00) (21,060.00
)
(21,902.4
0) (22,559.47)
(23,236.20
)
Fixed cost
(4,050.00) (4,131.00) (4,213.62) (4,297.89) (4,383.85)
Depreciation
(2,000.00) (2,050.00) (2,100.00) (2,150.00) (2,200.00)
Operating income
18,700.00 19,559.00 20,455.98 21,124.80 21,815.95
Tax (30%)
(5,610.00) 5,867.70 6,136.79 6,337.44 6,544.78
Paraphrase This Document
Need a fresh take? Get an instant paraphrase of this document with our AI Paraphraser
4FINANCE
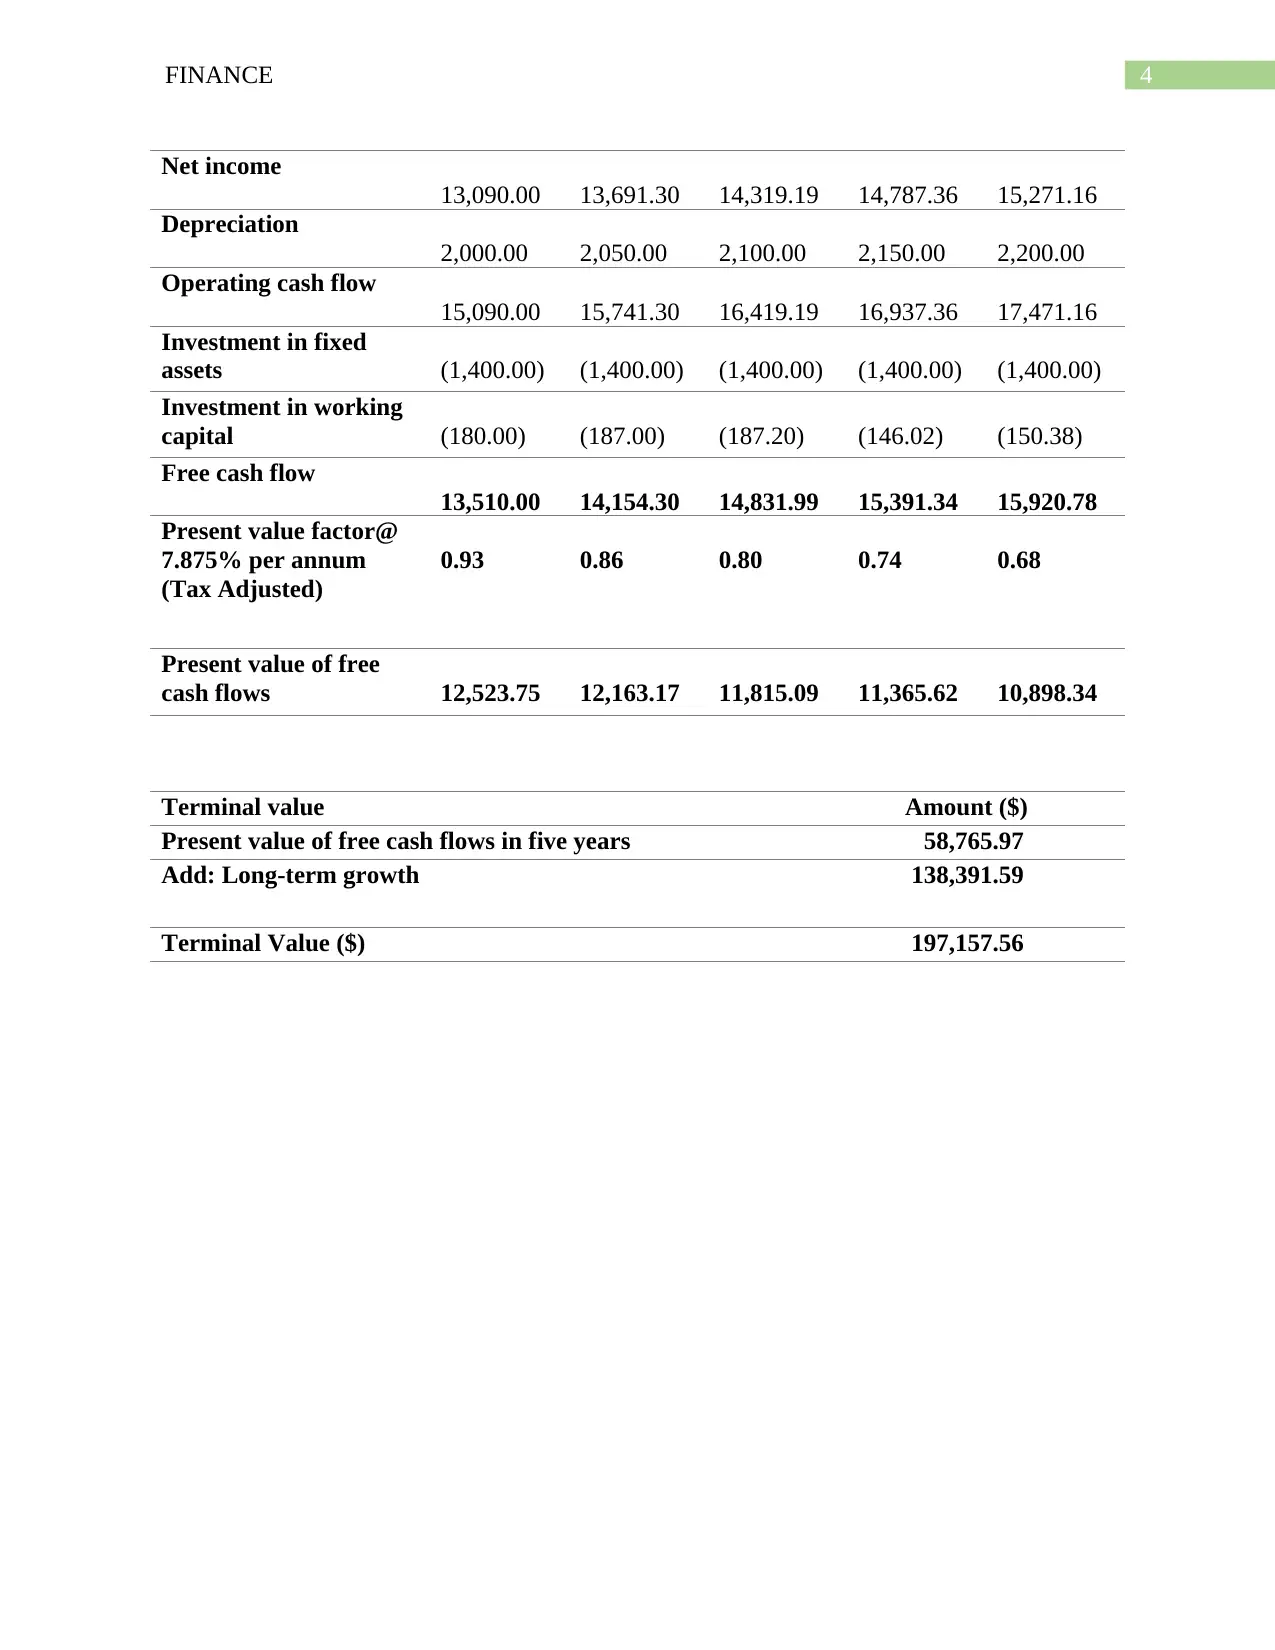
Net income
13,090.00 13,691.30 14,319.19 14,787.36 15,271.16
Depreciation
2,000.00 2,050.00 2,100.00 2,150.00 2,200.00
Operating cash flow
15,090.00 15,741.30 16,419.19 16,937.36 17,471.16
Investment in fixed
assets (1,400.00) (1,400.00) (1,400.00) (1,400.00) (1,400.00)
Investment in working
capital (180.00) (187.00) (187.20) (146.02) (150.38)
Free cash flow
13,510.00 14,154.30 14,831.99 15,391.34 15,920.78
Present value factor@
7.875% per annum
(Tax Adjusted)
0.93 0.86 0.80 0.74 0.68
Present value of free
cash flows 12,523.75 12,163.17 11,815.09 11,365.62 10,898.34
Terminal value Amount ($)
Present value of free cash flows in five years 58,765.97
Add: Long-term growth 138,391.59
Terminal Value ($) 197,157.56
5FINANCE
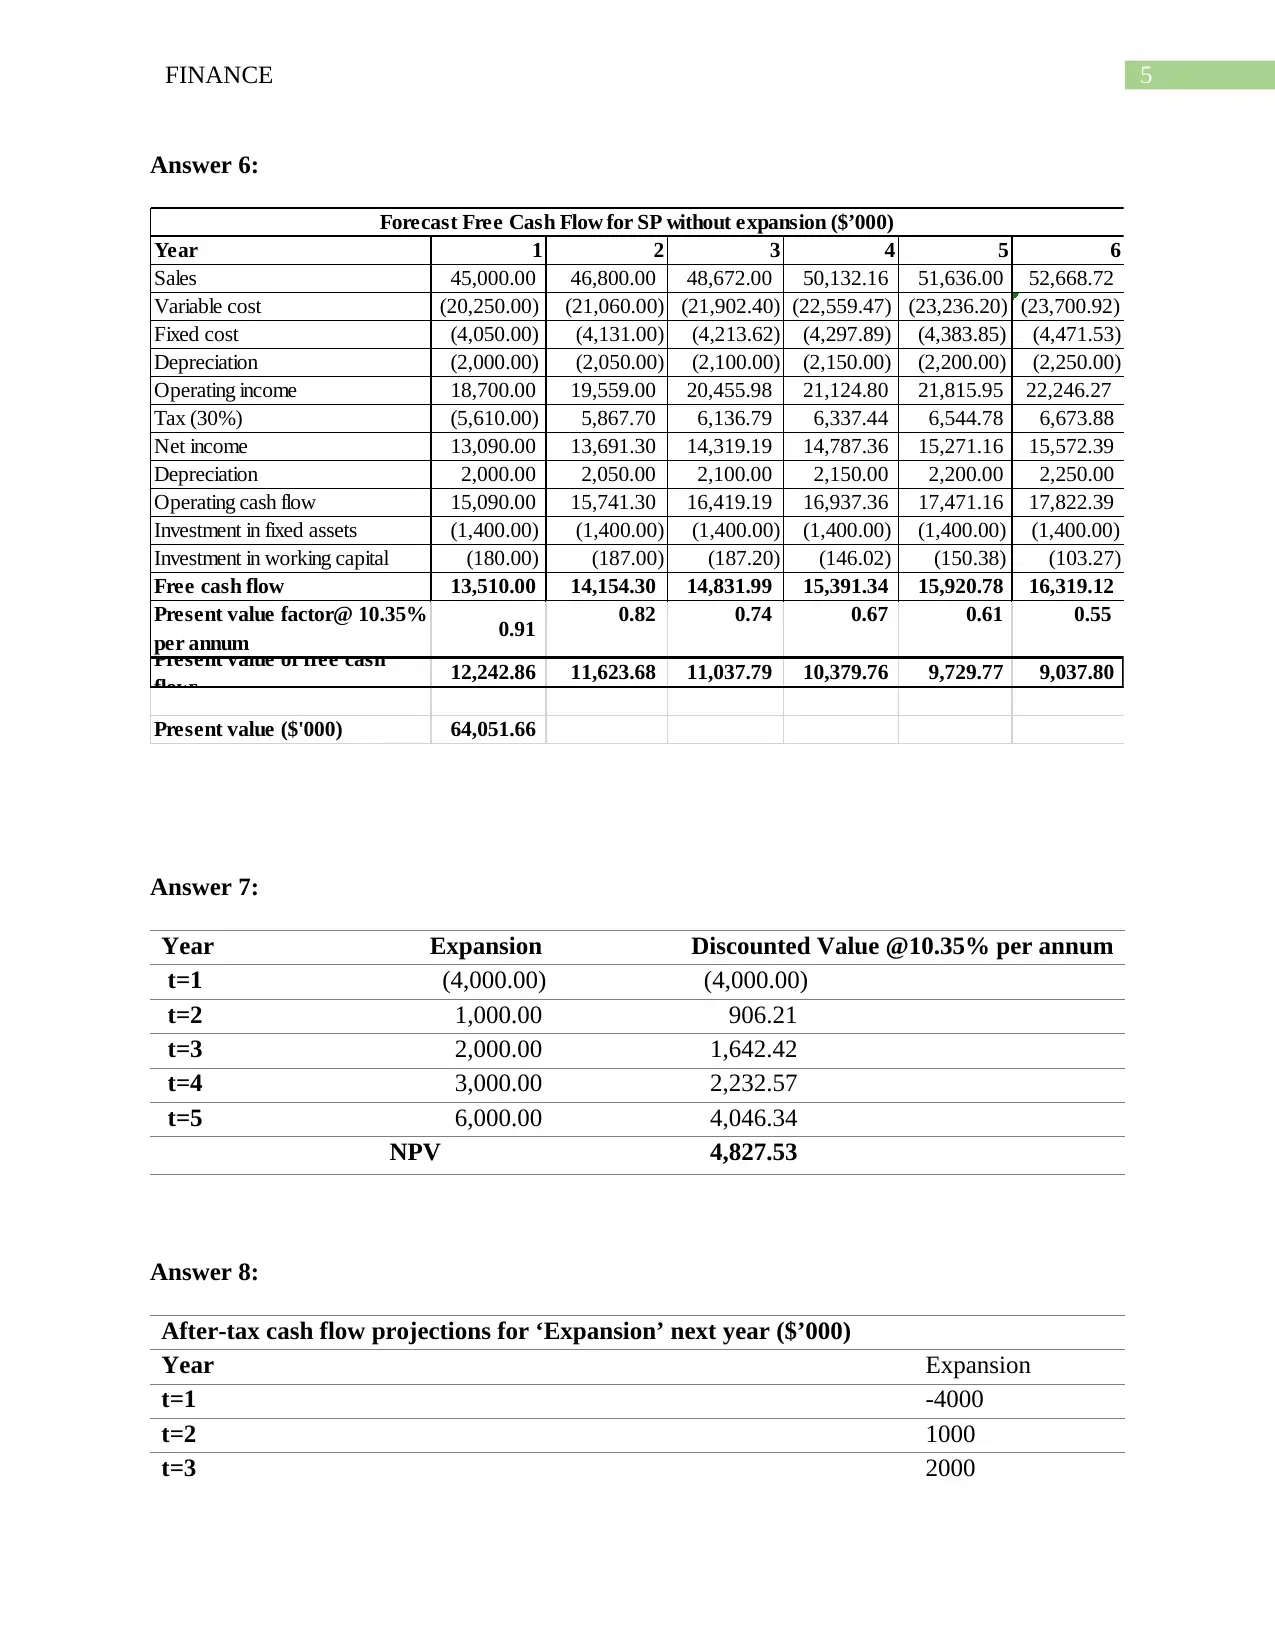
Answer 6:
Year 1 2 3 4 5 6
Sales 45,000.00 46,800.00 48,672.00 50,132.16 51,636.00 52,668.72
Variable cost (20,250.00) (21,060.00) (21,902.40) (22,559.47) (23,236.20) (23,700.92)
Fixed cost (4,050.00) (4,131.00) (4,213.62) (4,297.89) (4,383.85) (4,471.53)
Depreciation (2,000.00) (2,050.00) (2,100.00) (2,150.00) (2,200.00) (2,250.00)
Operating income 18,700.00 19,559.00 20,455.98 21,124.80 21,815.95 22,246.27
Tax (30%) (5,610.00) 5,867.70 6,136.79 6,337.44 6,544.78 6,673.88
Net income 13,090.00 13,691.30 14,319.19 14,787.36 15,271.16 15,572.39
Depreciation 2,000.00 2,050.00 2,100.00 2,150.00 2,200.00 2,250.00
Operating cash flow 15,090.00 15,741.30 16,419.19 16,937.36 17,471.16 17,822.39
Investment in fixed assets (1,400.00) (1,400.00) (1,400.00) (1,400.00) (1,400.00) (1,400.00)
Investment in working capital (180.00) (187.00) (187.20) (146.02) (150.38) (103.27)
Free cash flow 13,510.00 14,154.30 14,831.99 15,391.34 15,920.78 16,319.12
Present value factor@ 10.35%
per annum 0.91 0.82 0.74 0.67 0.61 0.55
Present value of free cash
flows 12,242.86 11,623.68 11,037.79 10,379.76 9,729.77 9,037.80
Present value ($'000) 64,051.66
Forecast Free Cash Flow for SP without expansion ($’000)
Answer 7:
Year Expansion Discounted Value @10.35% per annum
t=1 (4,000.00) (4,000.00)
t=2 1,000.00 906.21
t=3 2,000.00 1,642.42
t=4 3,000.00 2,232.57
t=5 6,000.00 4,046.34
NPV 4,827.53
Answer 8:
After-tax cash flow projections for ‘Expansion’ next year ($’000)
Year Expansion
t=1 -4000
t=2 1000
t=3 2000
⊘ This is a preview!⊘
Do you want full access?
Subscribe today to unlock all pages.
Trusted by 1+ million students worldwide
6FINANCE
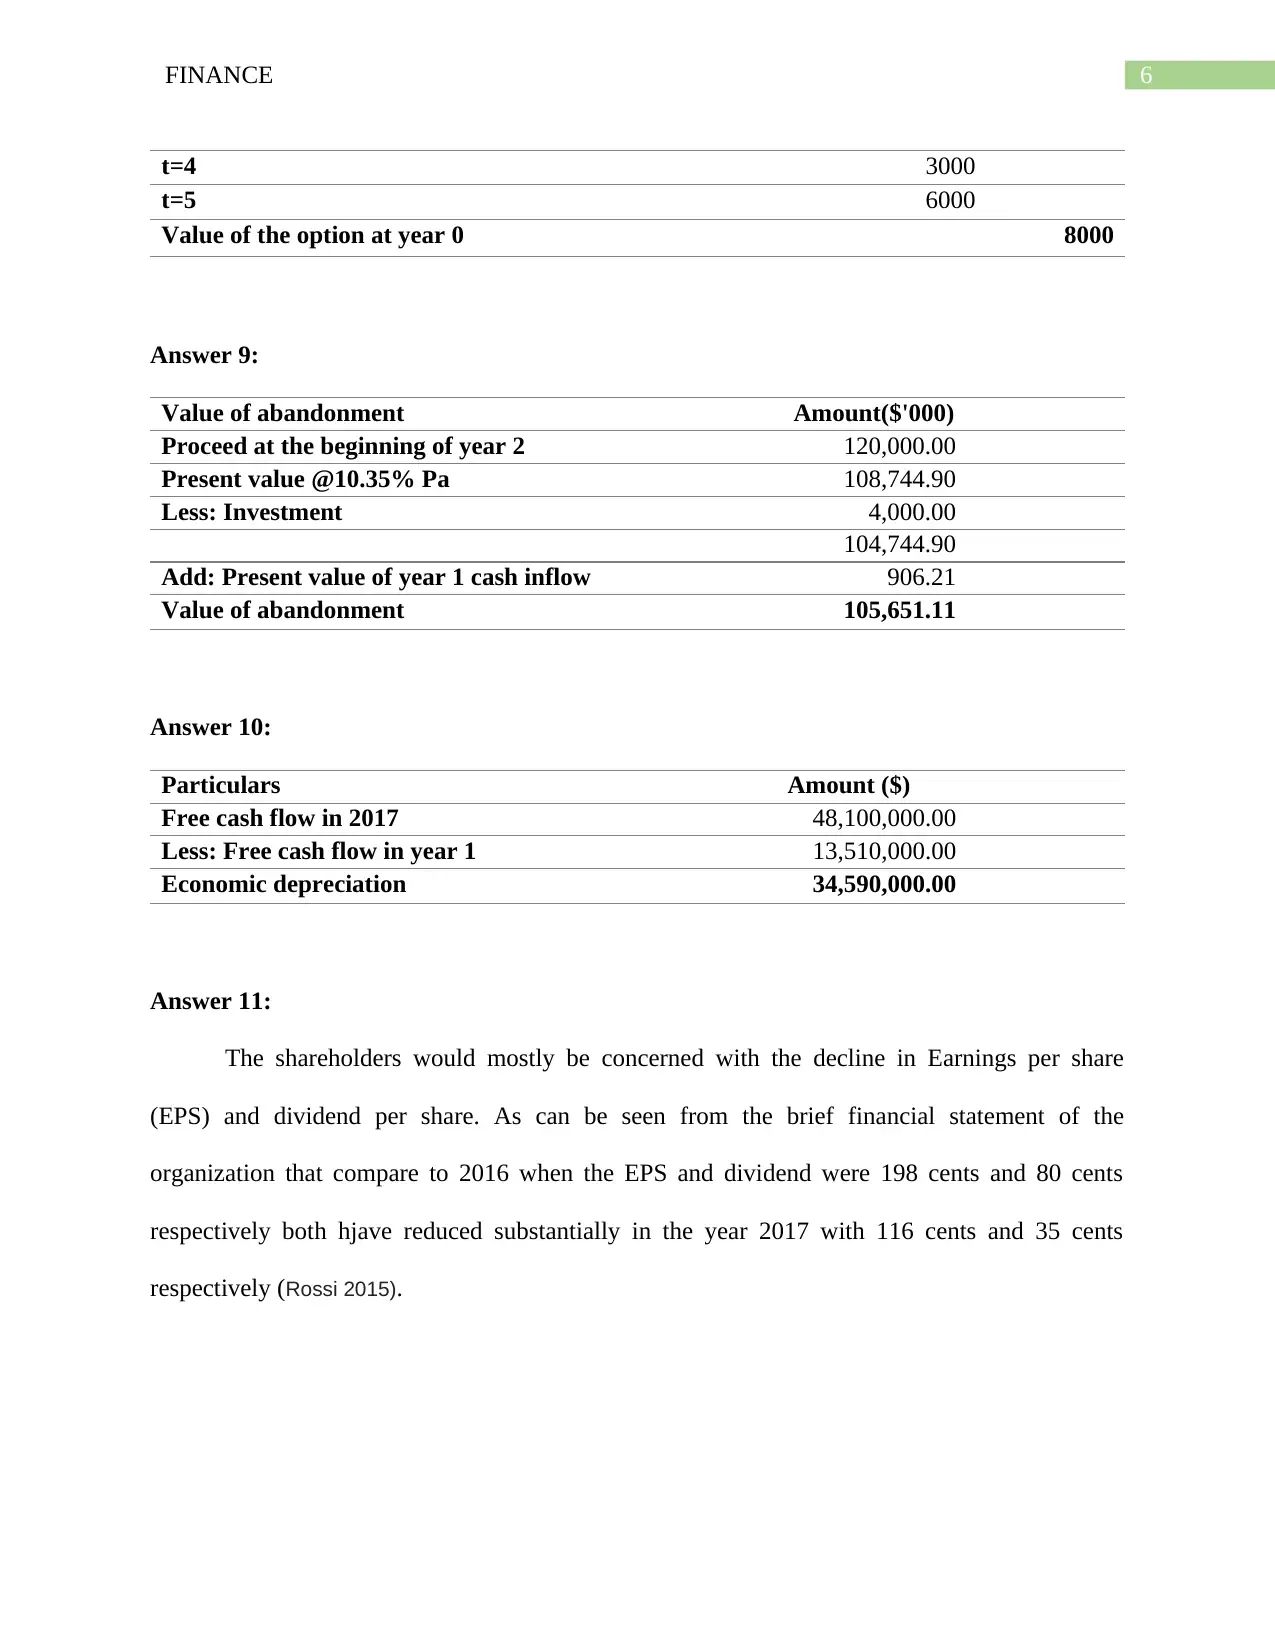
t=4 3000
t=5 6000
Value of the option at year 0 8000
Answer 9:
Value of abandonment Amount($'000)
Proceed at the beginning of year 2 120,000.00
Present value @10.35% Pa 108,744.90
Less: Investment 4,000.00
104,744.90
Add: Present value of year 1 cash inflow 906.21
Value of abandonment 105,651.11
Answer 10:
Particulars Amount ($)
Free cash flow in 2017 48,100,000.00
Less: Free cash flow in year 1 13,510,000.00
Economic depreciation 34,590,000.00
Answer 11:
The shareholders would mostly be concerned with the decline in Earnings per share
(EPS) and dividend per share. As can be seen from the brief financial statement of the
organization that compare to 2016 when the EPS and dividend were 198 cents and 80 cents
respectively both hjave reduced substantially in the year 2017 with 116 cents and 35 cents
respectively (Rossi 2015).
Paraphrase This Document
Need a fresh take? Get an instant paraphrase of this document with our AI Paraphraser
7FINANCE
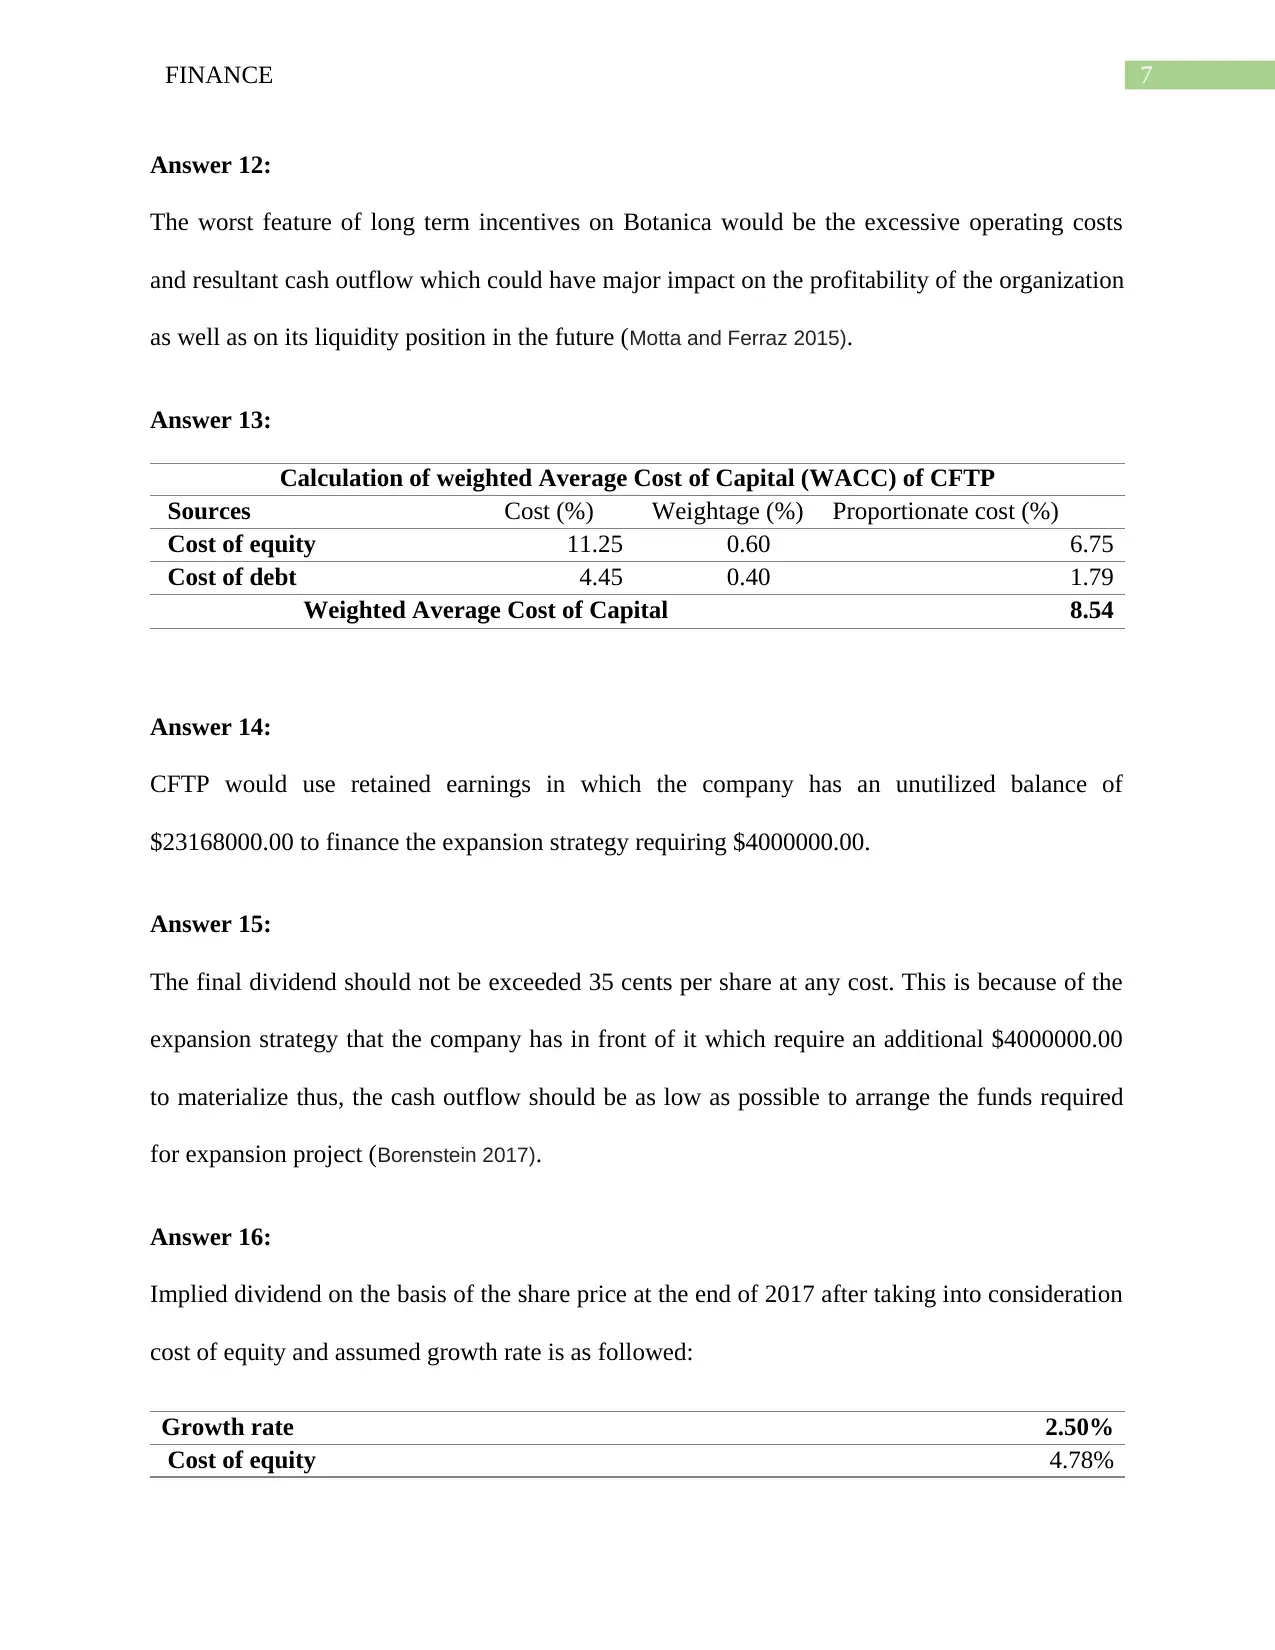
Answer 12:
The worst feature of long term incentives on Botanica would be the excessive operating costs
and resultant cash outflow which could have major impact on the profitability of the organization
as well as on its liquidity position in the future (Motta and Ferraz 2015).
Answer 13:
Calculation of weighted Average Cost of Capital (WACC) of CFTP
Sources Cost (%) Weightage (%) Proportionate cost (%)
Cost of equity 11.25 0.60 6.75
Cost of debt 4.45 0.40 1.79
Weighted Average Cost of Capital 8.54
Answer 14:
CFTP would use retained earnings in which the company has an unutilized balance of
$23168000.00 to finance the expansion strategy requiring $4000000.00.
Answer 15:
The final dividend should not be exceeded 35 cents per share at any cost. This is because of the
expansion strategy that the company has in front of it which require an additional $4000000.00
to materialize thus, the cash outflow should be as low as possible to arrange the funds required
for expansion project (Borenstein 2017).
Answer 16:
Implied dividend on the basis of the share price at the end of 2017 after taking into consideration
cost of equity and assumed growth rate is as followed:
Growth rate 2.50%
Cost of equity 4.78%
Answer 12:
The worst feature of long term incentives on Botanica would be the excessive operating costs
and resultant cash outflow which could have major impact on the profitability of the organization
as well as on its liquidity position in the future (Motta and Ferraz 2015).
Answer 13:
Calculation of weighted Average Cost of Capital (WACC) of CFTP
Sources Cost (%) Weightage (%) Proportionate cost (%)
Cost of equity 11.25 0.60 6.75
Cost of debt 4.45 0.40 1.79
Weighted Average Cost of Capital 8.54
Answer 14:
CFTP would use retained earnings in which the company has an unutilized balance of
$23168000.00 to finance the expansion strategy requiring $4000000.00.
Answer 15:
The final dividend should not be exceeded 35 cents per share at any cost. This is because of the
expansion strategy that the company has in front of it which require an additional $4000000.00
to materialize thus, the cash outflow should be as low as possible to arrange the funds required
for expansion project (Borenstein 2017).
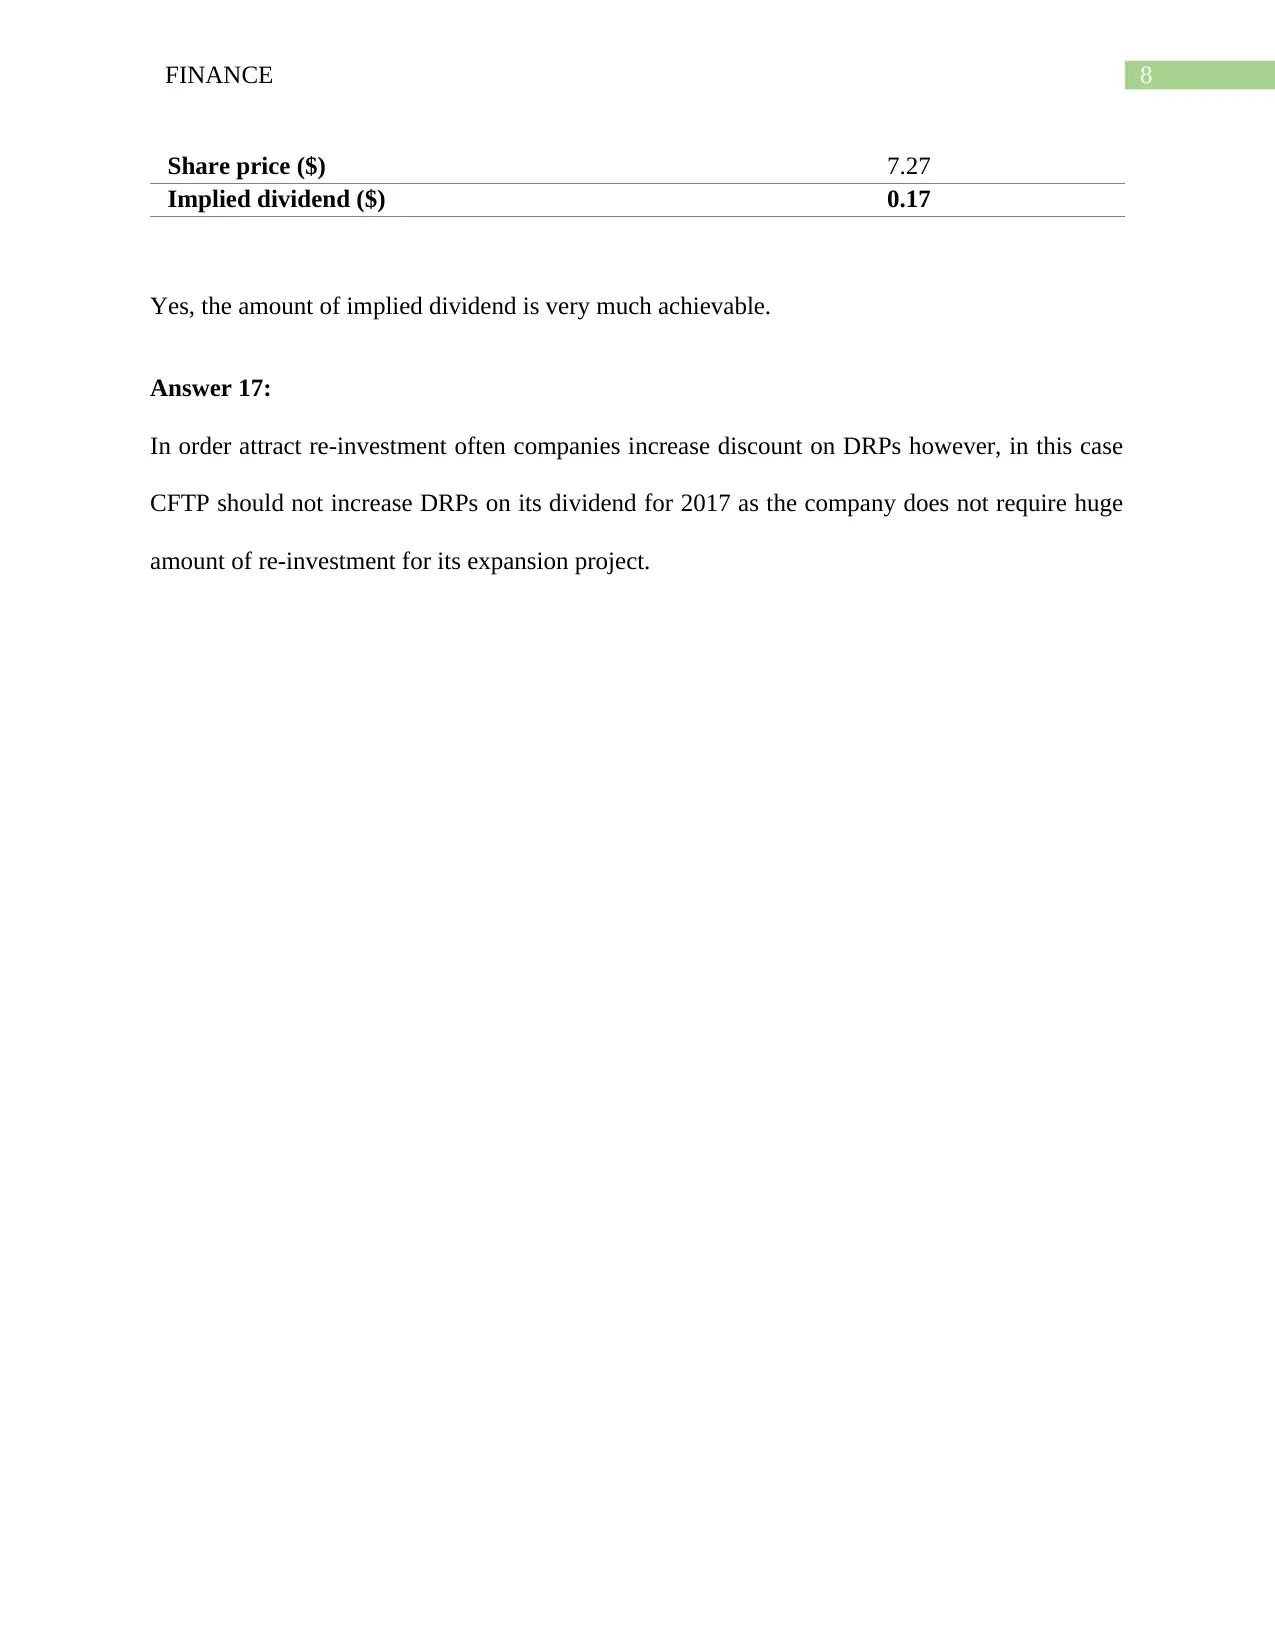
Answer 16:
Implied dividend on the basis of the share price at the end of 2017 after taking into consideration
cost of equity and assumed growth rate is as followed:
Growth rate 2.50%
Cost of equity 4.78%
8FINANCE
Share price ($) 7.27
Implied dividend ($) 0.17
Yes, the amount of implied dividend is very much achievable.
Answer 17:
In order attract re-investment often companies increase discount on DRPs however, in this case
CFTP should not increase DRPs on its dividend for 2017 as the company does not require huge
amount of re-investment for its expansion project.
⊘ This is a preview!⊘
Do you want full access?
Subscribe today to unlock all pages.
Trusted by 1+ million students worldwide
9FINANCE
References:
Frank, M.Z. and Shen, T., 2016. Investment and the weighted average cost of capital. Journal of
Financial Economics, 119(2), pp.300-315.
Bodie, Z., 2013. Investments. McGraw-Hill.
Baker, M. and Wurgler, J., 2015. Do strict capital requirements raise the cost of capital? Bank
regulation, capital structure, and the low-risk anomaly. The American Economic Review, 105(5),
pp.315-320.
Brooks, R., 2015. Financial management: core concepts. Pearson.
Brotherson, W.T., Eades, K.M., Harris, R.S. and Higgins, R.C., 2015. 'Best Practices' in
Estimating the Cost of Capital: An Update.
Franks, D.M., Davis, R., Bebbington, A.J., Ali, S.H., Kemp, D. and Scurrah, M., 2014. Conflict
translates environmental and social risk into business costs. Proceedings of the National
Academy of Sciences, 111(21), pp.7576-7581.
Hull, J.C., 2014. The evaluation of risk in business investment. Elsevier.
Huikku, J., Mouritsen, J. and Silvola, H., 2017. Relative reliability and the recognisable firm:
Calculating goodwill impairment value. Accounting, Organizations and Society, 56, pp.68-83.
vom Brocke, J. and Sonnenberg, C., 2015. Value-orientation in business process management.
In Handbook on Business Process Management 2 (pp. 101-132). Springer Berlin Heidelberg.
Larson, E.W. and Gray, C., 2013. Project Management: The Managerial Process with MS
Project. McGraw-Hill.
Paraphrase This Document
Need a fresh take? Get an instant paraphrase of this document with our AI Paraphraser
10FINANCE
Crill, R., Hanchar, J., Gooch, C. and Richard, S., 2014. Net Present Value Economic Analysis
Model for Adoption of Photoperiod Manipulation in Lactating Cow Barns.
Rossi, M., 2015. The use of capital budgeting techniques: an outlook from Italy. International
Journal of Management Practice, 8(1), pp.43-56.
Stiglitz, J.E. and Rosengard, J.K., 2015. Economics of the Public Sector: Fourth International
Student Edition. WW Norton & Company.
Borenstein, S., 2017. Private Net Benefits of Residential Solar PV: The Role of Electricity
Tariffs, Tax Incentives, and Rebates. Journal of the Association of Environmental and Resource
Economists, 4(S1), pp.S85-S122.
Anderson, V., 2014. Alternative Economic Indicators (Routledge Revivals). Routledge.
Motta, R.S.D. and Ferraz, C., 2015. Estimating timber depreciation in the Brazilian Amazon.
1 out of 11
Your All-in-One AI-Powered Toolkit for Academic Success.
+13062052269
info@desklib.com
Available 24*7 on WhatsApp / Email
![[object Object]](/_next/static/media/star-bottom.7253800d.svg)
Unlock your academic potential
Copyright © 2020–2026 A2Z Services. All Rights Reserved. Developed and managed by ZUCOL.