Finance Assignment 1: Budgeting, Break-Even, Investment Decisions
VerifiedAdded on 2023/05/28
|7
|729
|489
Homework Assignment
AI Summary
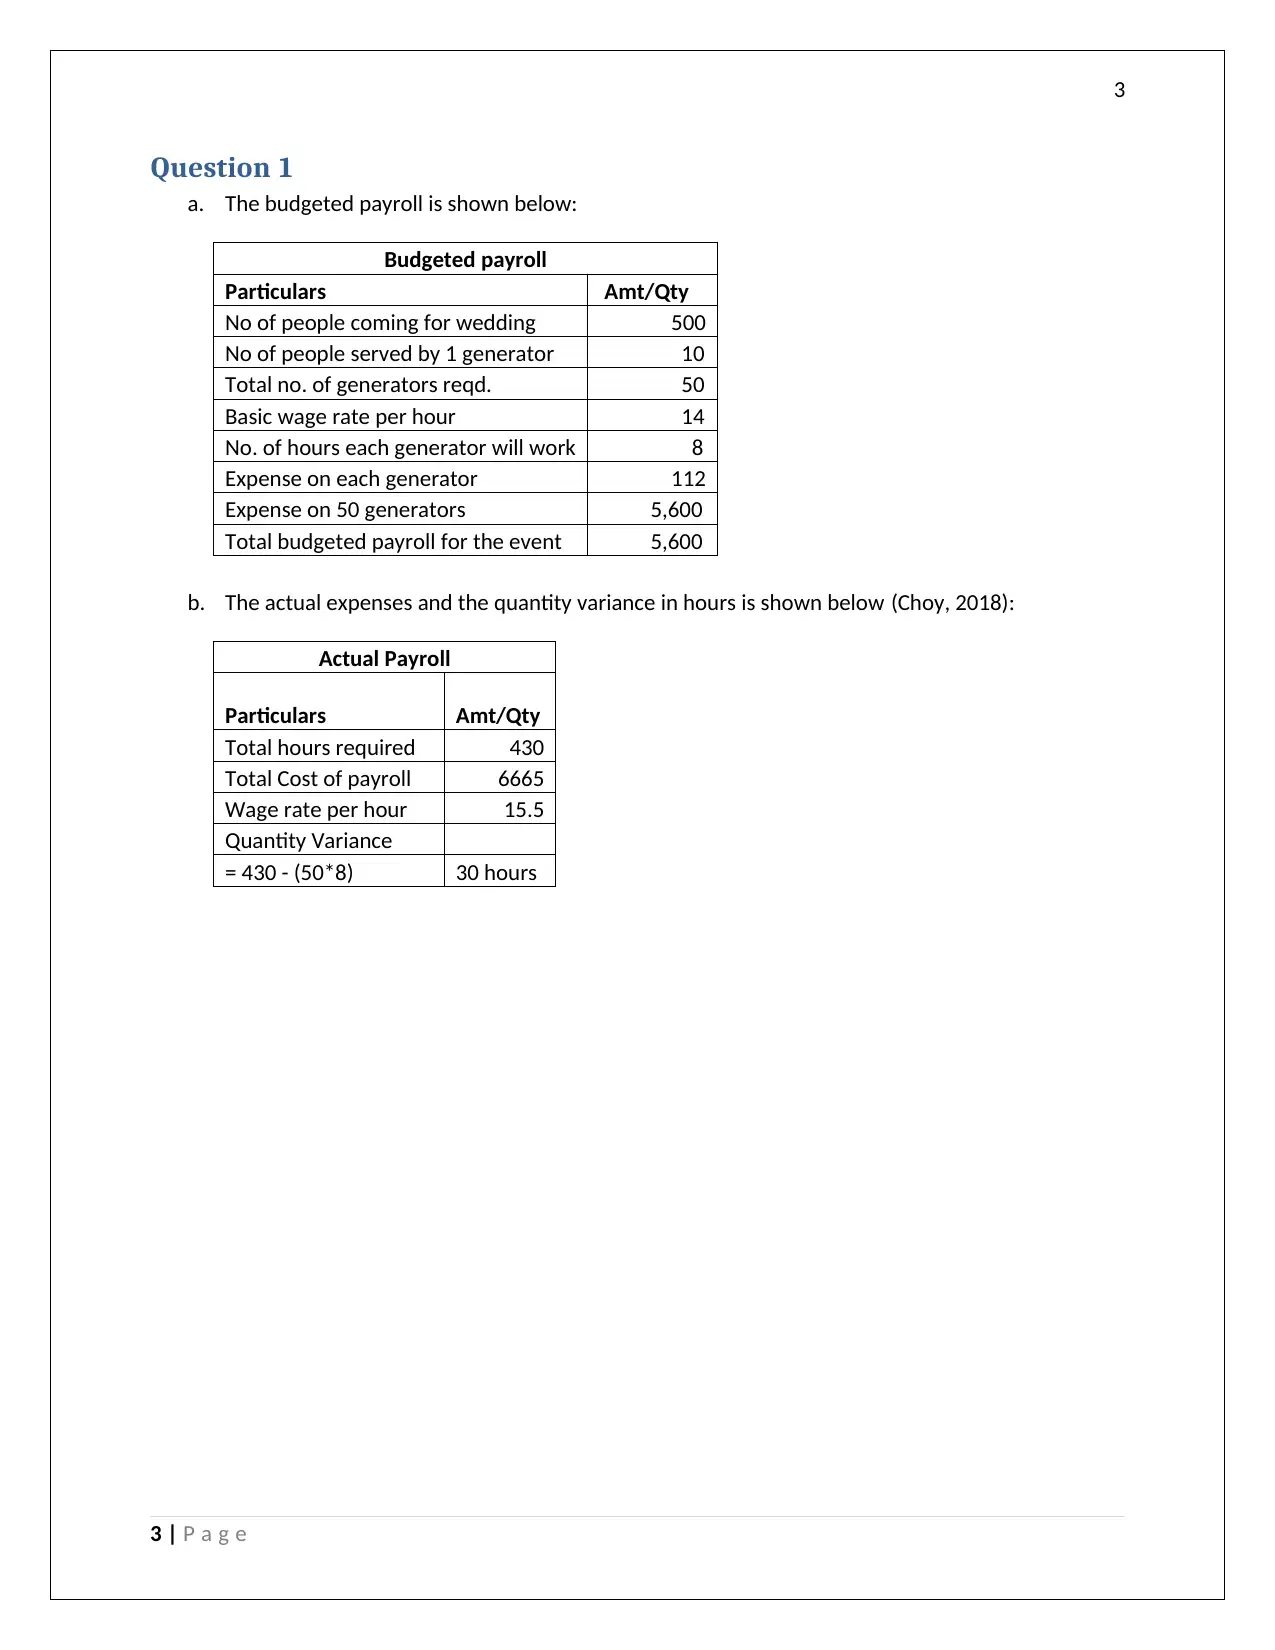
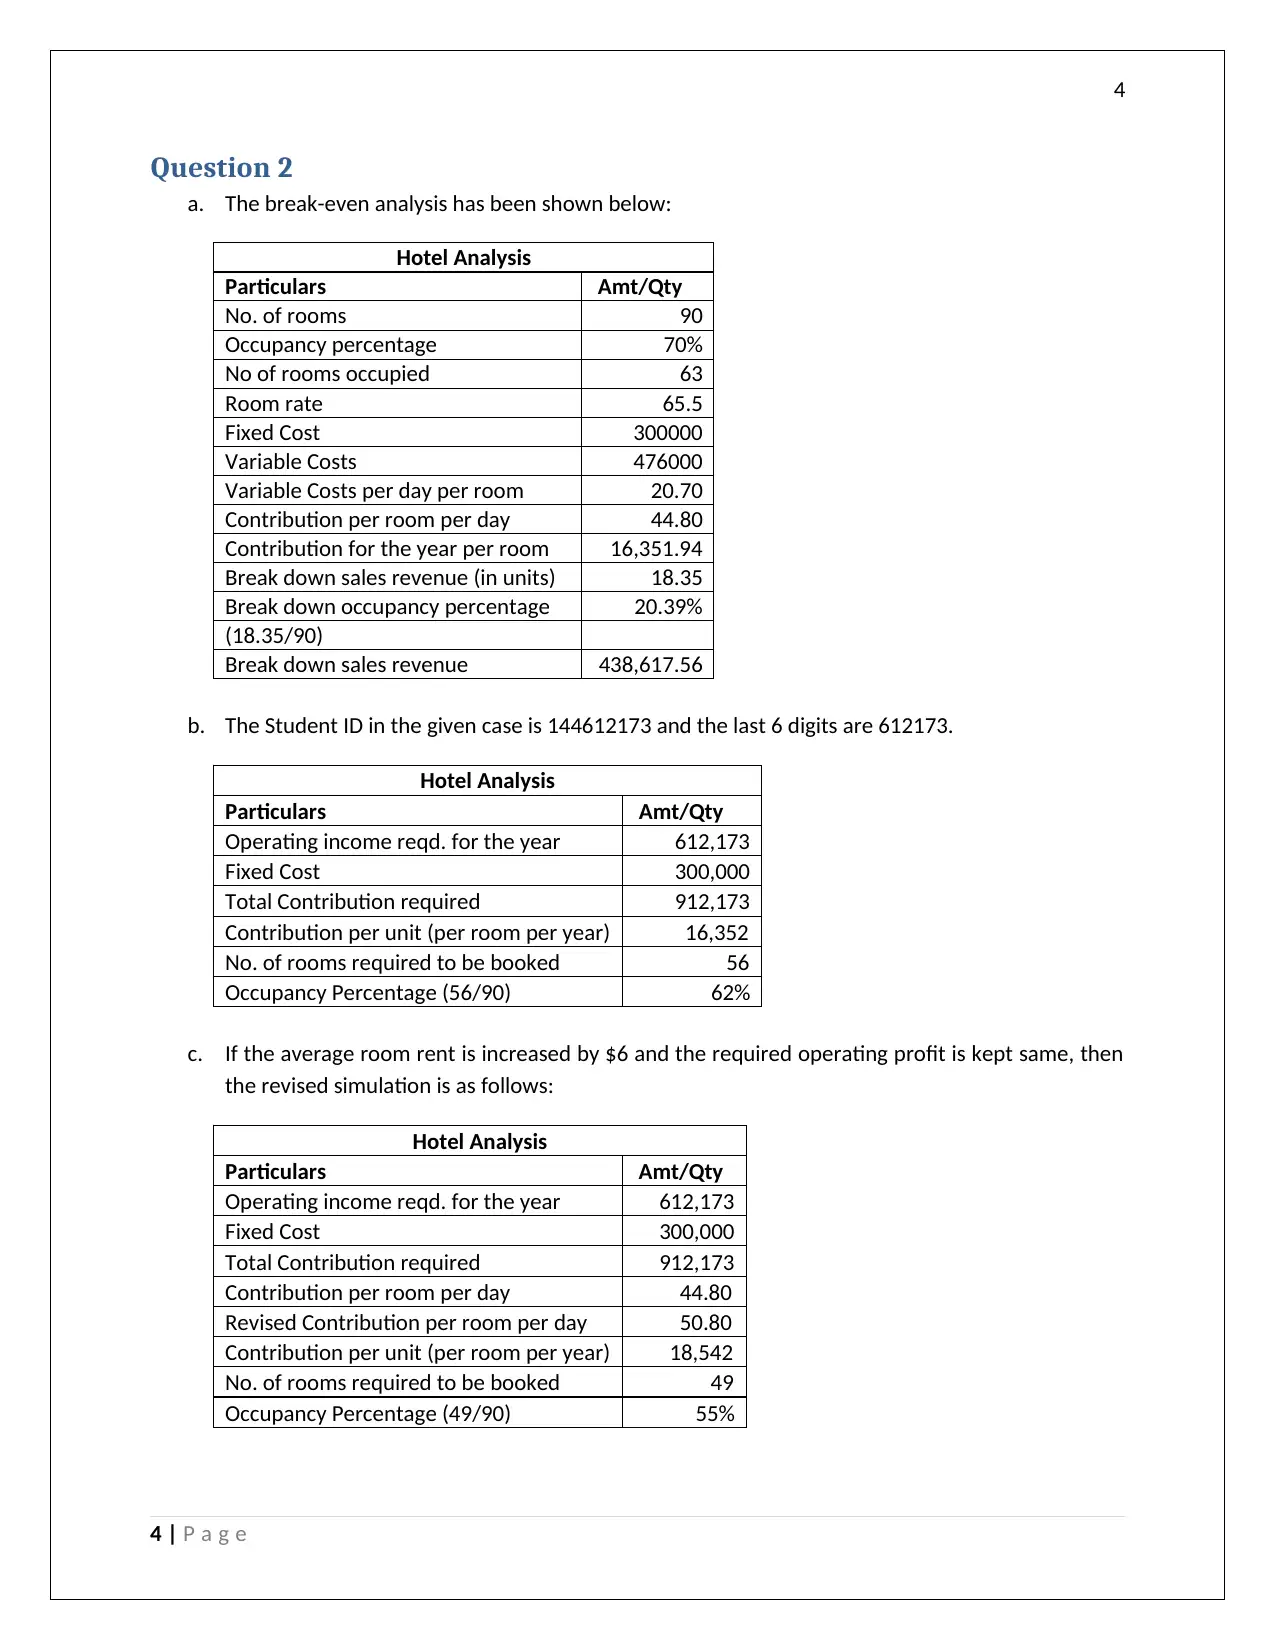
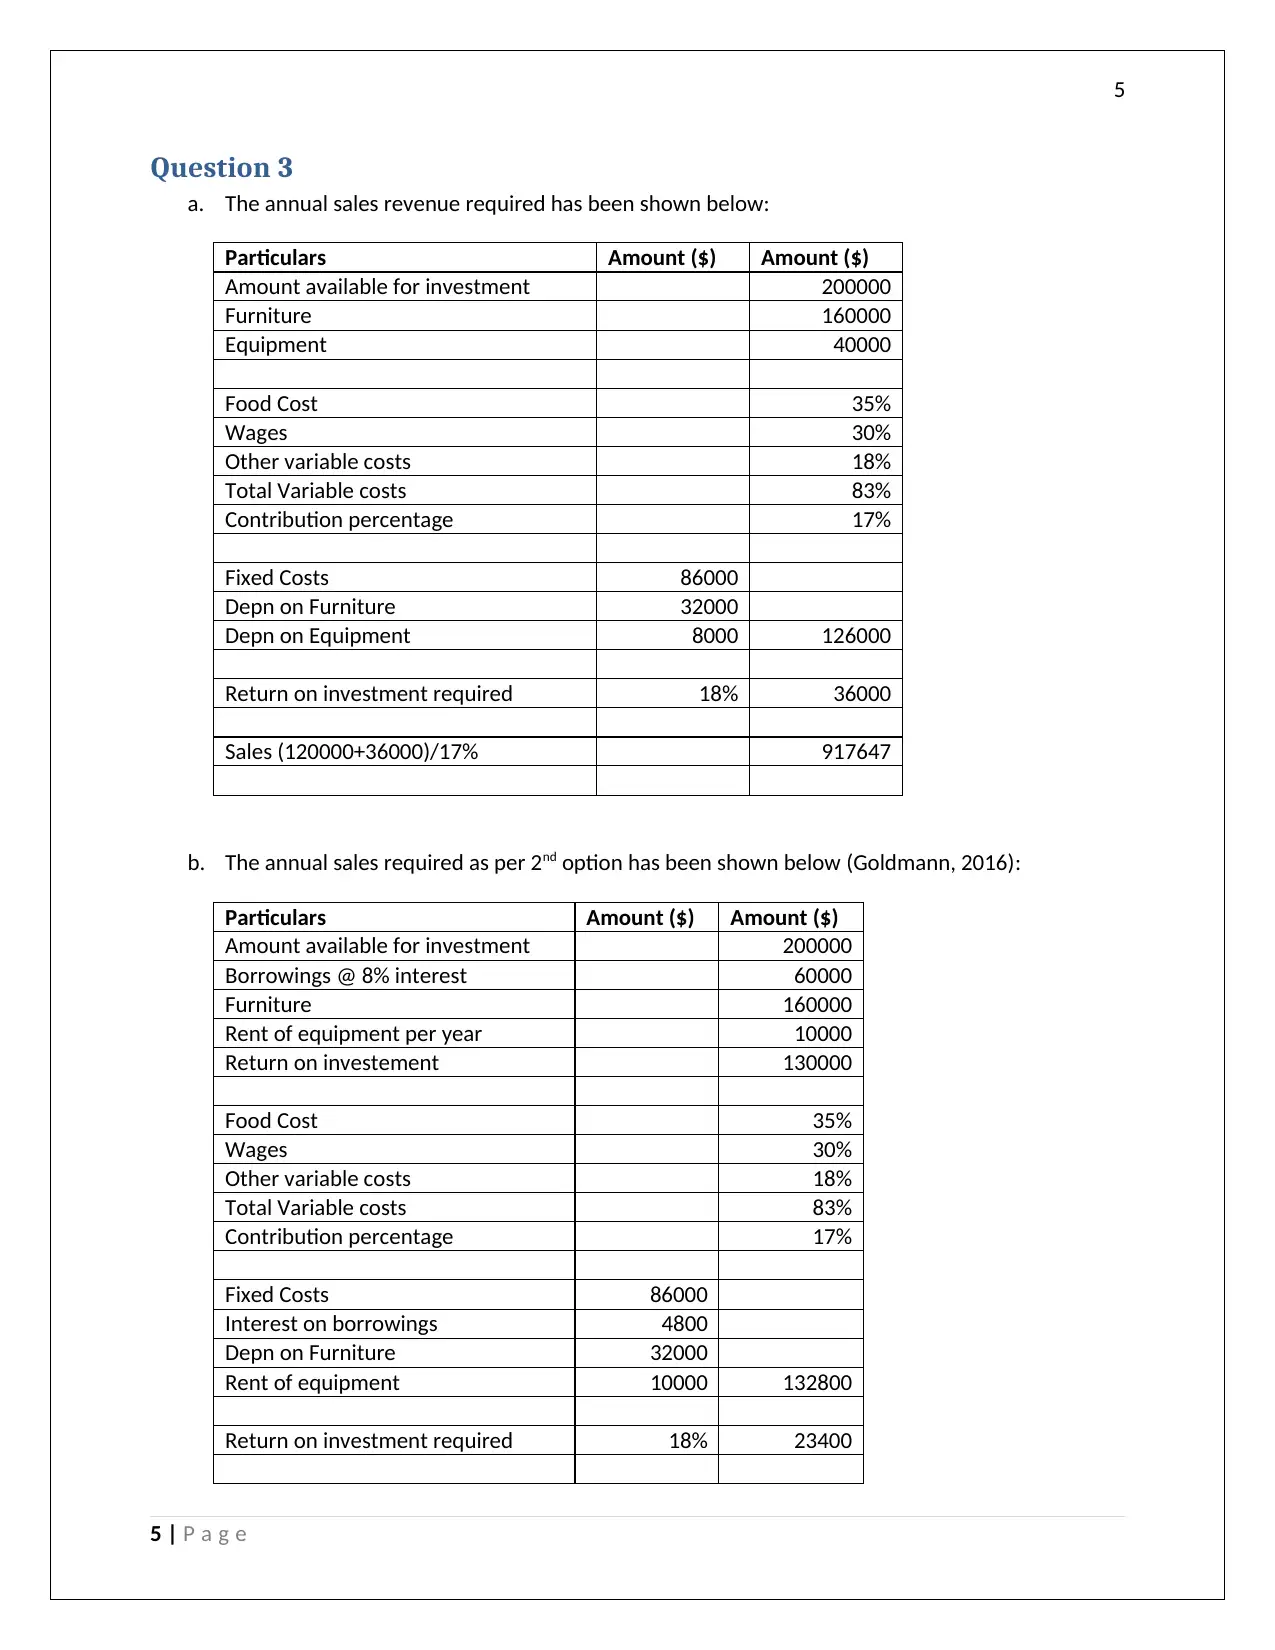
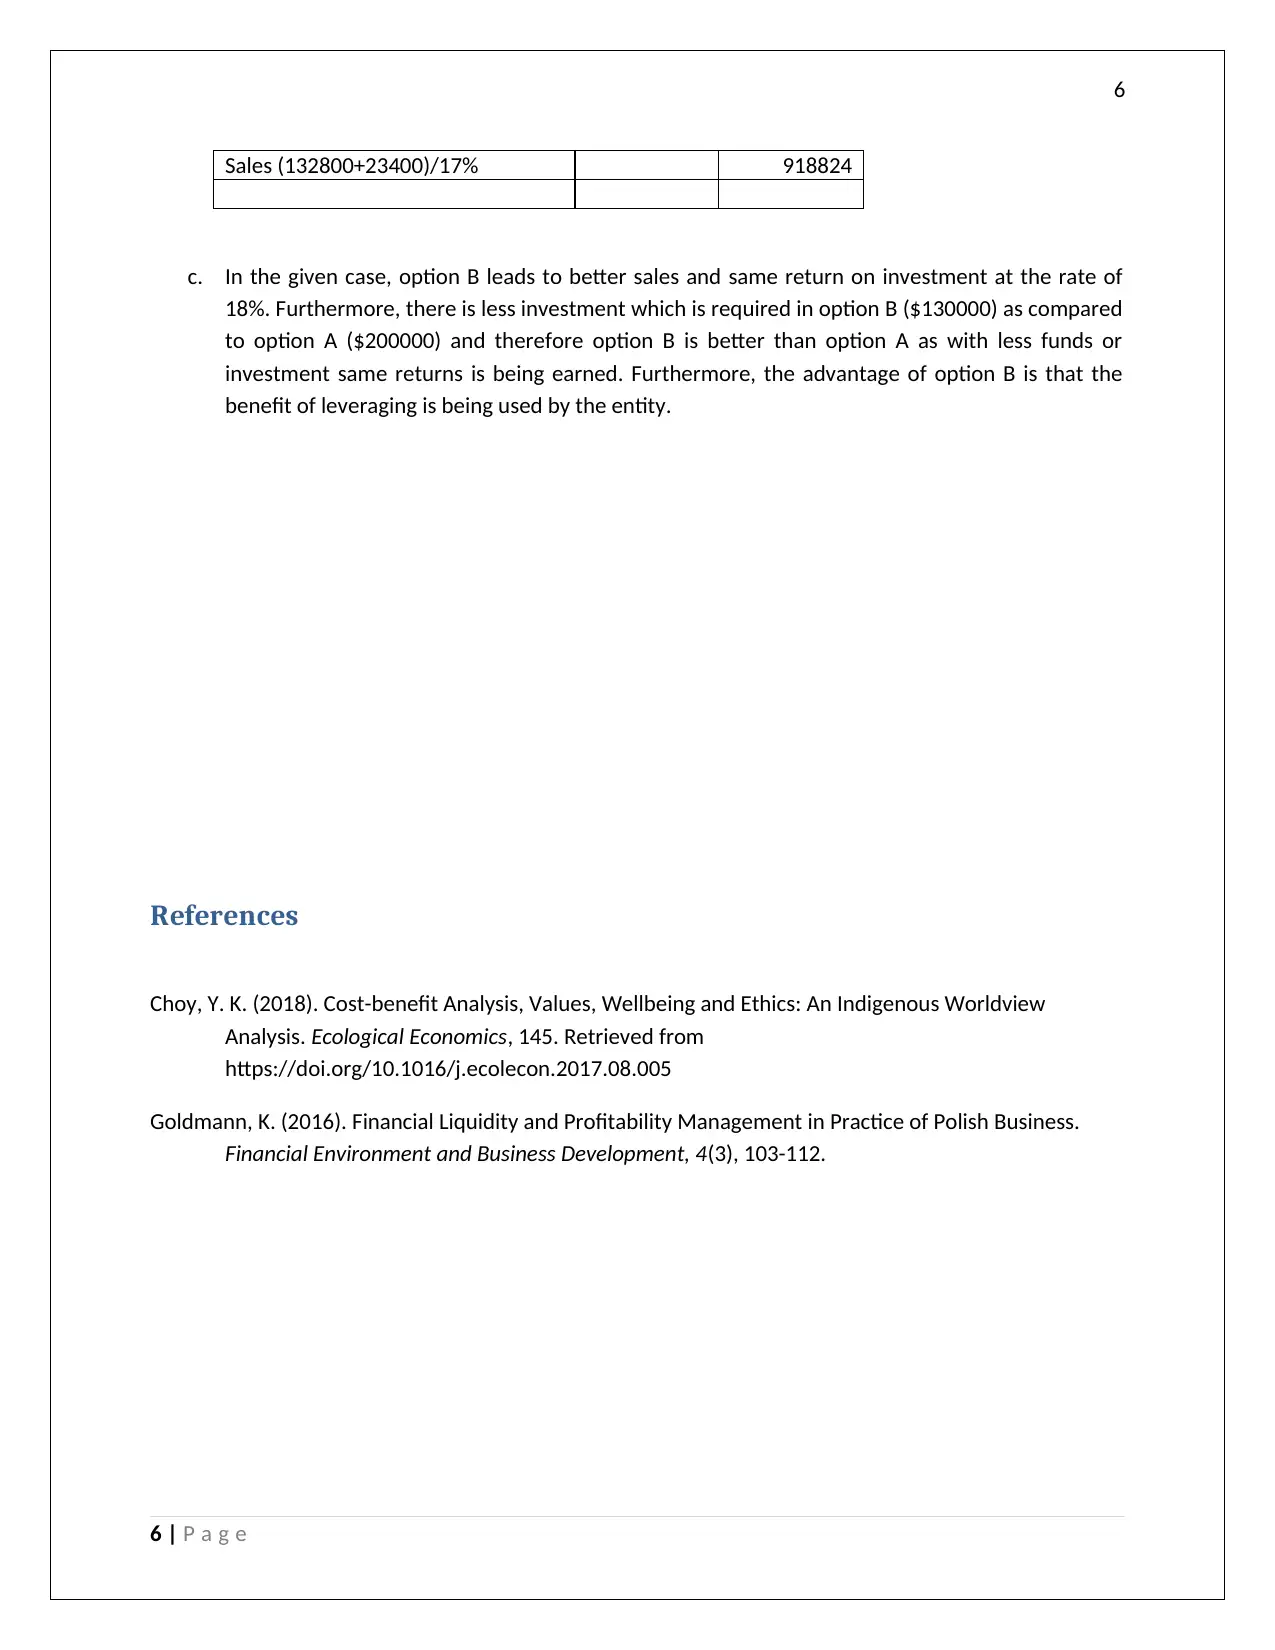
This document presents a solved Finance Assignment 1, addressing key concepts such as budgeting, variance analysis, break-even analysis, and investment decisions. The assignment begins with a budgeted payroll calculation, followed by an analysis of actual expenses and quantity variances. It then ...

FINANCE
ASSIGNMENT
ASSIGNMENT
Secure Best Marks with AI Grader
Need help grading? Try our AI Grader for instant feedback on your assignments.

1
By student name
Professor
University
Date: 25 April 2018.
1 | P a g e
By student name
Professor
University
Date: 25 April 2018.
1 | P a g e

2
Contents
Question 1...................................................................................................................................................3
Question 2...................................................................................................................................................4
Question 3...................................................................................................................................................5
References...................................................................................................................................................6
2 | P a g e

3
Question 1
a. The budgeted payroll is shown below:
Budgeted payroll
Particulars Amt/Qty
No of people coming for wedding 500
No of people served by 1 generator 10
Total no. of generators reqd. 50
Basic wage rate per hour 14
No. of hours each generator will work 8
Expense on each generator 112
Expense on 50 generators 5,600
Total budgeted payroll for the event 5,600
b. The actual expenses and the quantity variance in hours is shown below (Choy, 2018):
Actual Payroll
Particulars Amt/Qty
Total hours required 430
Total Cost of payroll 6665
Wage rate per hour 15.5
Quantity Variance
= 430 - (50*8) 30 hours
3 | P a g e
Secure Best Marks with AI Grader
Need help grading? Try our AI Grader for instant feedback on your assignments.

4
Question 2
a. The break-even analysis has been shown below:
Hotel Analysis
Particulars Amt/Qty
No. of rooms 90
Occupancy percentage 70%
No of rooms occupied 63
Room rate 65.5
Fixed Cost 300000
Variable Costs 476000
Variable Costs per day per room 20.70
Contribution per room per day 44.80
Contribution for the year per room 16,351.94
Break down sales revenue (in units) 18.35
Break down occupancy percentage 20.39%
(18.35/90)
Break down sales revenue 438,617.56
b. The Student ID in the given case is 144612173 and the last 6 digits are 612173.
Hotel Analysis
Particulars Amt/Qty
Operating income reqd. for the year 612,173
Fixed Cost 300,000
Total Contribution required 912,173
Contribution per unit (per room per year) 16,352
No. of rooms required to be booked 56
Occupancy Percentage (56/90) 62%
c. If the average room rent is increased by $6 and the required operating profit is kept same, then
the revised simulation is as follows:
Hotel Analysis
Particulars Amt/Qty
Operating income reqd. for the year 612,173
Fixed Cost 300,000
Total Contribution required 912,173
Contribution per room per day 44.80
Revised Contribution per room per day 50.80
Contribution per unit (per room per year) 18,542
No. of rooms required to be booked 49
Occupancy Percentage (49/90) 55%
4 | P a g e

5
Question 3
a. The annual sales revenue required has been shown below:
Particulars Amount ($) Amount ($)
Amount available for investment 200000
Furniture 160000
Equipment 40000
Food Cost 35%
Wages 30%
Other variable costs 18%
Total Variable costs 83%
Contribution percentage 17%
Fixed Costs 86000
Depn on Furniture 32000
Depn on Equipment 8000 126000
Return on investment required 18% 36000
Sales (120000+36000)/17% 917647
b. The annual sales required as per 2nd option has been shown below (Goldmann, 2016):
Particulars Amount ($) Amount ($)
Amount available for investment 200000
Borrowings @ 8% interest 60000
Furniture 160000
Rent of equipment per year 10000
Return on investement 130000
Food Cost 35%
Wages 30%
Other variable costs 18%
Total Variable costs 83%
Contribution percentage 17%
Fixed Costs 86000
Interest on borrowings 4800
Depn on Furniture 32000
Rent of equipment 10000 132800
Return on investment required 18% 23400
5 | P a g e

6
Sales (132800+23400)/17% 918824
c. In the given case, option B leads to better sales and same return on investment at the rate of
18%. Furthermore, there is less investment which is required in option B ($130000) as compared
to option A ($200000) and therefore option B is better than option A as with less funds or
investment same returns is being earned. Furthermore, the advantage of option B is that the
benefit of leveraging is being used by the entity.
References
Choy, Y. K. (2018). Cost-benefit Analysis, Values, Wellbeing and Ethics: An Indigenous Worldview
Analysis. Ecological Economics, 145. Retrieved from
https://doi.org/10.1016/j.ecolecon.2017.08.005
Goldmann, K. (2016). Financial Liquidity and Profitability Management in Practice of Polish Business.
Financial Environment and Business Development, 4(3), 103-112.
6 | P a g e
1 out of 7

Your All-in-One AI-Powered Toolkit for Academic Success.
+13062052269
info@desklib.com
Available 24*7 on WhatsApp / Email
Unlock your academic potential
© 2024 | Zucol Services PVT LTD | All rights reserved.