Finance for Business: Westpac vs. Bank of Queensland Analysis Report
VerifiedAdded on 2023/04/23
|18
|4492
|206
Report
AI Summary
This finance report, prepared for a foreign institutional investor, assesses the financial performance of Westpac Banking Corporation and Bank of Queensland, both operating in the Australian banking sector. The report analyzes profitability ratios (operating margin, net margin, return on assets, and return on equity) and liquidity ratios (debt ratio, equity ratio, debt-to-equity ratio, and interest cover ratio) for the period of 2016-2018. It also examines share price movements and calculates the weighted average cost of capital (WACC) and capital structures of both companies. The analysis reveals that Westpac demonstrates a stronger profitability position and more favorable long-term liquidity compared to Bank of Queensland. The share price analysis indicates a negative correlation between Westpac's share price and the All Ordinaries Index. Based on these findings, the report recommends investing in Westpac Banking Corporation to maximize the return on investment.

Running head: FINANCE FOR BUSINESS
Finance for Business
Name of the Student:
Name of the University:
Author’s Note:
Course ID:
Finance for Business
Name of the Student:
Name of the University:
Author’s Note:
Course ID:
Paraphrase This Document
Need a fresh take? Get an instant paraphrase of this document with our AI Paraphraser
1FINANCE FOR BUSINESS
Executive Summary:
The current report has focused on the perspective of a foreign institutional investor planning to
invest in the Australian market. Therefore, the two organisations that have been selected for this
assignment operate in the banking sector of Australia. They include Westpac Banking
Corporation and Bank of Queensland. Westpac is observed to be placed in a better position in
terms of profitability position than the Bank of Queensland in the Australian market. In terms of
long-term liquidity or solvency, Westpac is placed in a favourable position in the Australian
banking sector compared to the Bank of Queensland. The composition of capital structure of
Westpac has changed over the three-year period, in which the depth exposure has fallen over the
three-year period, while there has been rise in exposure of equity. Therefore, the investor is
recommended to invest in the shares of Westpac Banking Corporation for maximising the overall
return on investment.
2FINANCE FOR BUSINESS
Table of Contents
Introduction:....................................................................................................................................3
1. Description of the chosen companies:.........................................................................................3
2. Calculation and comparison of selected performance ratios:......................................................4
3. Share price movement analysis:..................................................................................................8
4. Calculation and analysis of weighted average cost of capital (WACC):...................................10
5. Capital structure policy:.............................................................................................................12
6. Recommendation letter:.............................................................................................................12
Conclusion:....................................................................................................................................13
References and Bibliographies:.....................................................................................................15
⊘ This is a preview!⊘
Do you want full access?
Subscribe today to unlock all pages.
Trusted by 1+ million students worldwide
3FINANCE FOR BUSINESS
Introduction:
The current report would focus from the perspective of a foreign institutional investor
planning to invest in the Australian market. Therefore, the two organisations that have been
selected for this assignment operate in the banking sector of Australia. They include Westpac
Banking Corporation and Bank of Queensland. The first section of the report would provide an
insight of the business operations of the two banks along with comparative advantages. The
second section would concentrate on analysing and contrasting the profitability and liquidity
positions of the two chosen banks for the past three years by extracting the financial information
from their published annual reports. The next part would emphasise on analysing the share price
movement analysis of the two banks to determine the volatility of their stock prices in the ASX
index. In addition, the weighted average cost of capital of the two companies has been analysed
as well as their capital structures. Based on all the above aspects, recommendation letter would
be provided to the concerned investor regarding the investment opportunities in the two banks.
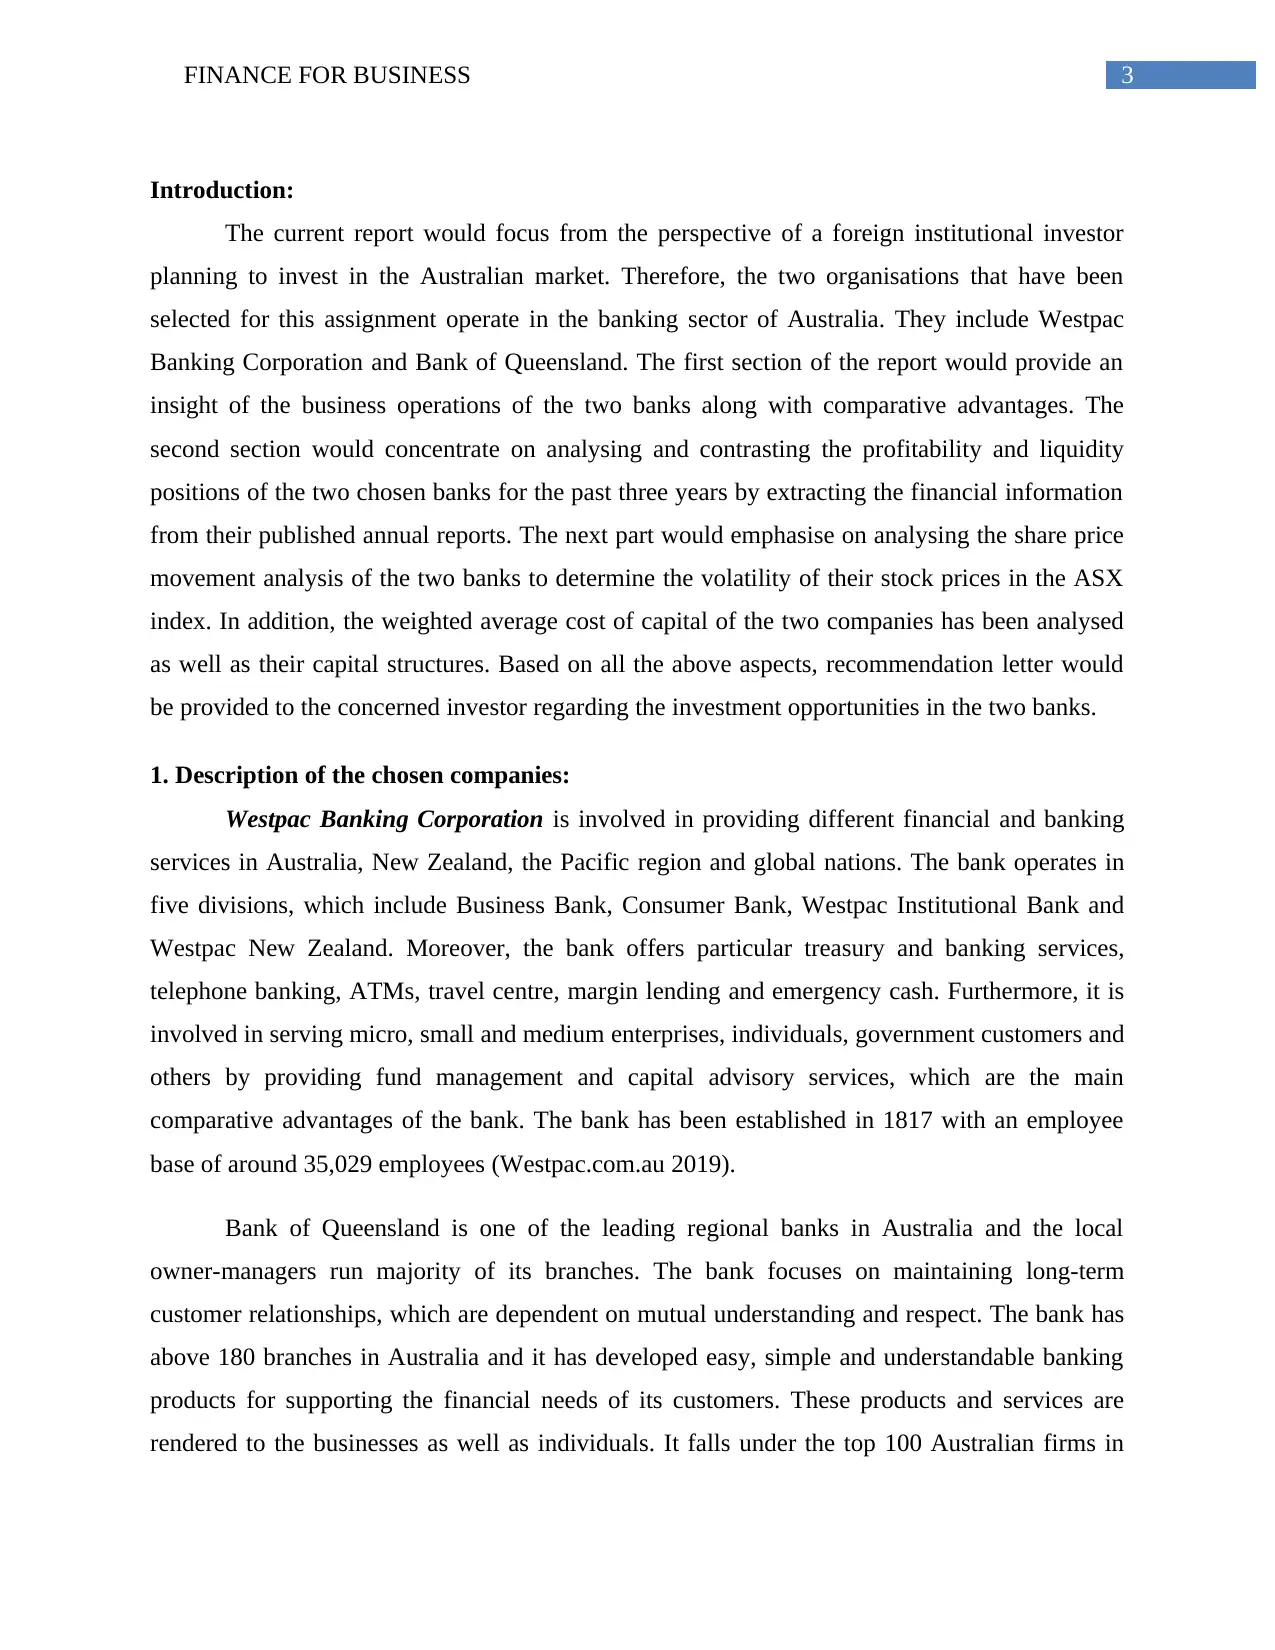
1. Description of the chosen companies:
Westpac Banking Corporation is involved in providing different financial and banking
services in Australia, New Zealand, the Pacific region and global nations. The bank operates in
five divisions, which include Business Bank, Consumer Bank, Westpac Institutional Bank and
Westpac New Zealand. Moreover, the bank offers particular treasury and banking services,
telephone banking, ATMs, travel centre, margin lending and emergency cash. Furthermore, it is
involved in serving micro, small and medium enterprises, individuals, government customers and
others by providing fund management and capital advisory services, which are the main
comparative advantages of the bank. The bank has been established in 1817 with an employee
base of around 35,029 employees (Westpac.com.au 2019).
Bank of Queensland is one of the leading regional banks in Australia and the local
owner-managers run majority of its branches. The bank focuses on maintaining long-term
customer relationships, which are dependent on mutual understanding and respect. The bank has
above 180 branches in Australia and it has developed easy, simple and understandable banking
products for supporting the financial needs of its customers. These products and services are
rendered to the businesses as well as individuals. It falls under the top 100 Australian firms in
Introduction:
The current report would focus from the perspective of a foreign institutional investor
planning to invest in the Australian market. Therefore, the two organisations that have been
selected for this assignment operate in the banking sector of Australia. They include Westpac
Banking Corporation and Bank of Queensland. The first section of the report would provide an
insight of the business operations of the two banks along with comparative advantages. The
second section would concentrate on analysing and contrasting the profitability and liquidity
positions of the two chosen banks for the past three years by extracting the financial information
from their published annual reports. The next part would emphasise on analysing the share price
movement analysis of the two banks to determine the volatility of their stock prices in the ASX
index. In addition, the weighted average cost of capital of the two companies has been analysed
as well as their capital structures. Based on all the above aspects, recommendation letter would
be provided to the concerned investor regarding the investment opportunities in the two banks.
1. Description of the chosen companies:
Westpac Banking Corporation is involved in providing different financial and banking
services in Australia, New Zealand, the Pacific region and global nations. The bank operates in
five divisions, which include Business Bank, Consumer Bank, Westpac Institutional Bank and
Westpac New Zealand. Moreover, the bank offers particular treasury and banking services,
telephone banking, ATMs, travel centre, margin lending and emergency cash. Furthermore, it is
involved in serving micro, small and medium enterprises, individuals, government customers and
others by providing fund management and capital advisory services, which are the main
comparative advantages of the bank. The bank has been established in 1817 with an employee
base of around 35,029 employees (Westpac.com.au 2019).
Bank of Queensland is one of the leading regional banks in Australia and the local
owner-managers run majority of its branches. The bank focuses on maintaining long-term
customer relationships, which are dependent on mutual understanding and respect. The bank has
above 180 branches in Australia and it has developed easy, simple and understandable banking
products for supporting the financial needs of its customers. These products and services are
rendered to the businesses as well as individuals. It falls under the top 100 Australian firms in
Paraphrase This Document
Need a fresh take? Get an instant paraphrase of this document with our AI Paraphraser
4FINANCE FOR BUSINESS
terms of market capitalisation in ASX, which has assisted the bank in gaining comparative
advantage in the market (Boq.com.au 2019).
2. Calculation and comparison of selected performance ratios:
For evaluating the profitability and liquidity position of the two selected banks, the
following ratios are taken into consideration:
Profitability ratios:
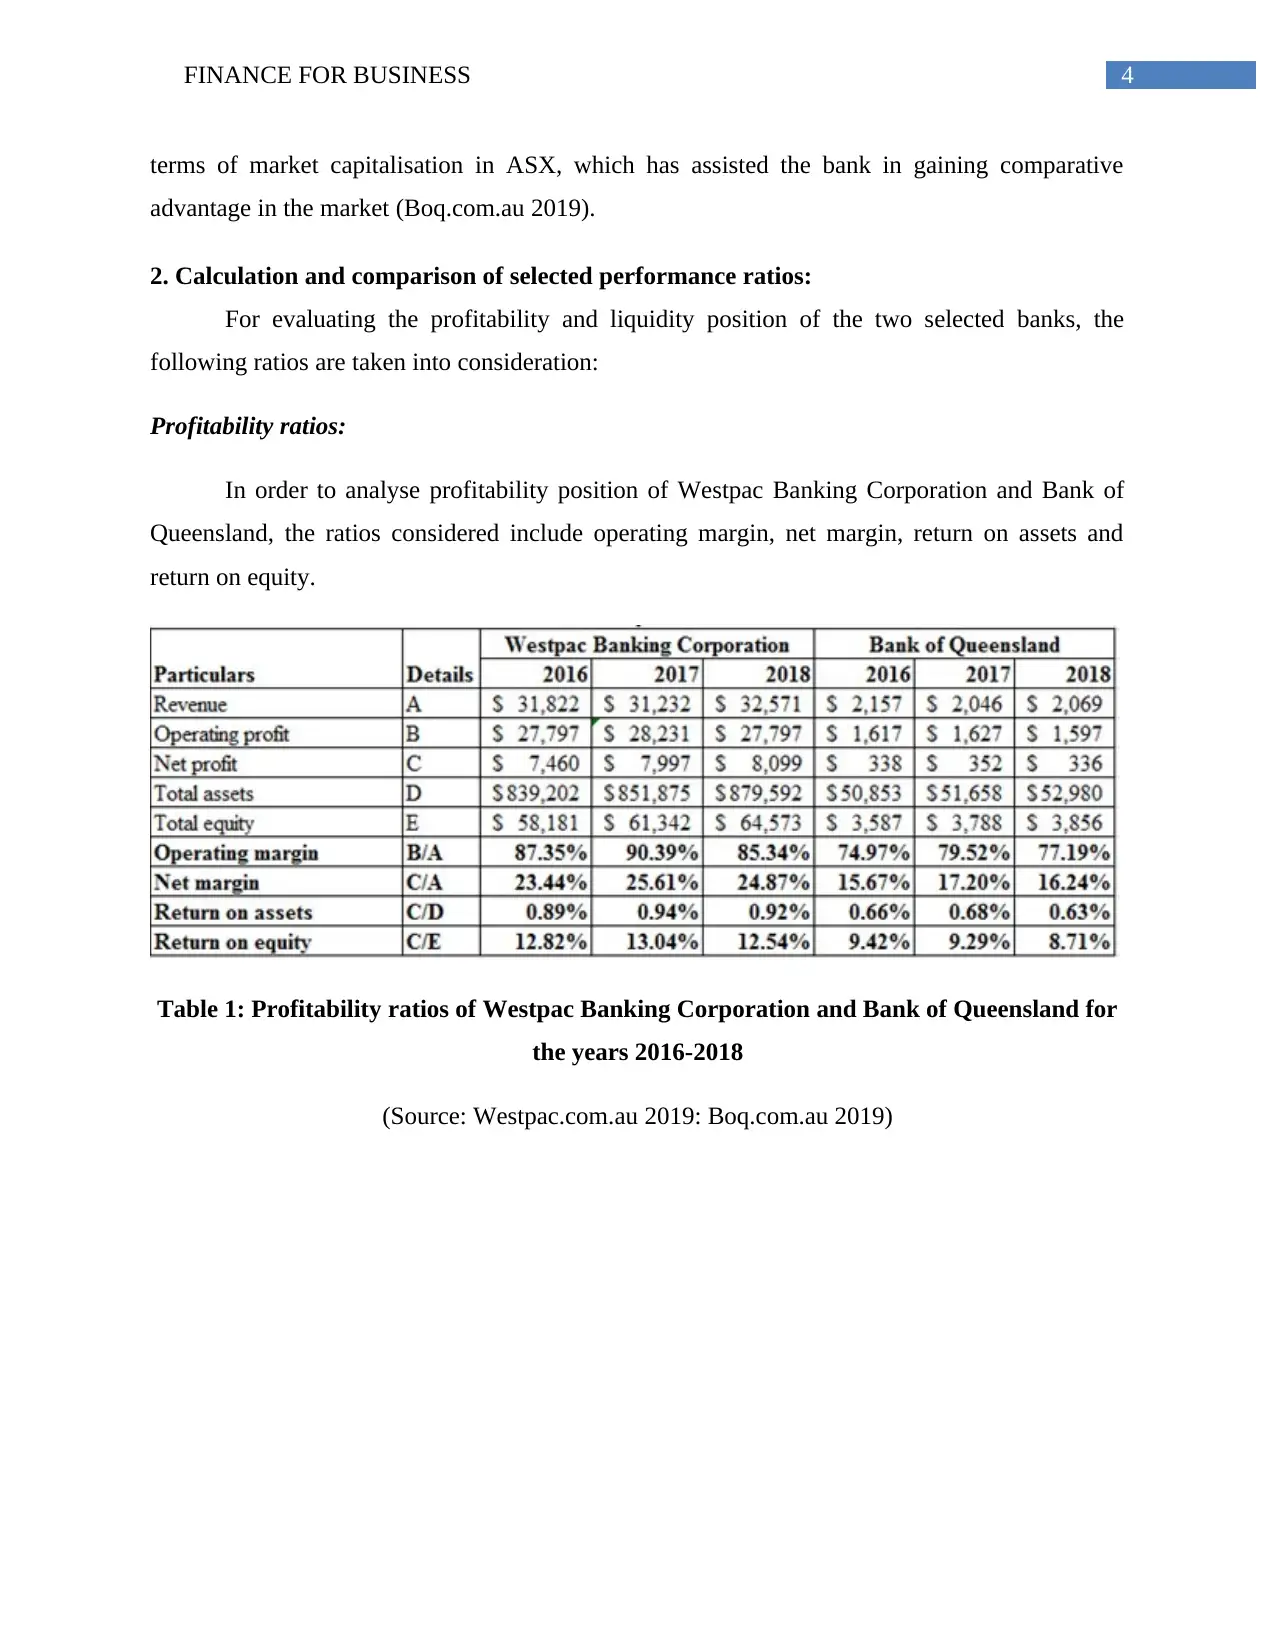
In order to analyse profitability position of Westpac Banking Corporation and Bank of
Queensland, the ratios considered include operating margin, net margin, return on assets and
return on equity.
Table 1: Profitability ratios of Westpac Banking Corporation and Bank of Queensland for
the years 2016-2018
(Source: Westpac.com.au 2019: Boq.com.au 2019)
terms of market capitalisation in ASX, which has assisted the bank in gaining comparative
advantage in the market (Boq.com.au 2019).
2. Calculation and comparison of selected performance ratios:
For evaluating the profitability and liquidity position of the two selected banks, the
following ratios are taken into consideration:
Profitability ratios:
In order to analyse profitability position of Westpac Banking Corporation and Bank of
Queensland, the ratios considered include operating margin, net margin, return on assets and
return on equity.
Table 1: Profitability ratios of Westpac Banking Corporation and Bank of Queensland for
the years 2016-2018
(Source: Westpac.com.au 2019: Boq.com.au 2019)
5FINANCE FOR BUSINESS
2016 2017 2018 2016 2017 2018
Westpac Banking
Corporation Bank of Queensland
0.00%
10.00%
20.00%
30.00%
40.00%
50.00%
60.00%
70.00%
80.00%
90.00%
100.00%
Profitability Ratios
Operating margin
Net margin
Return on assets
Return on equity
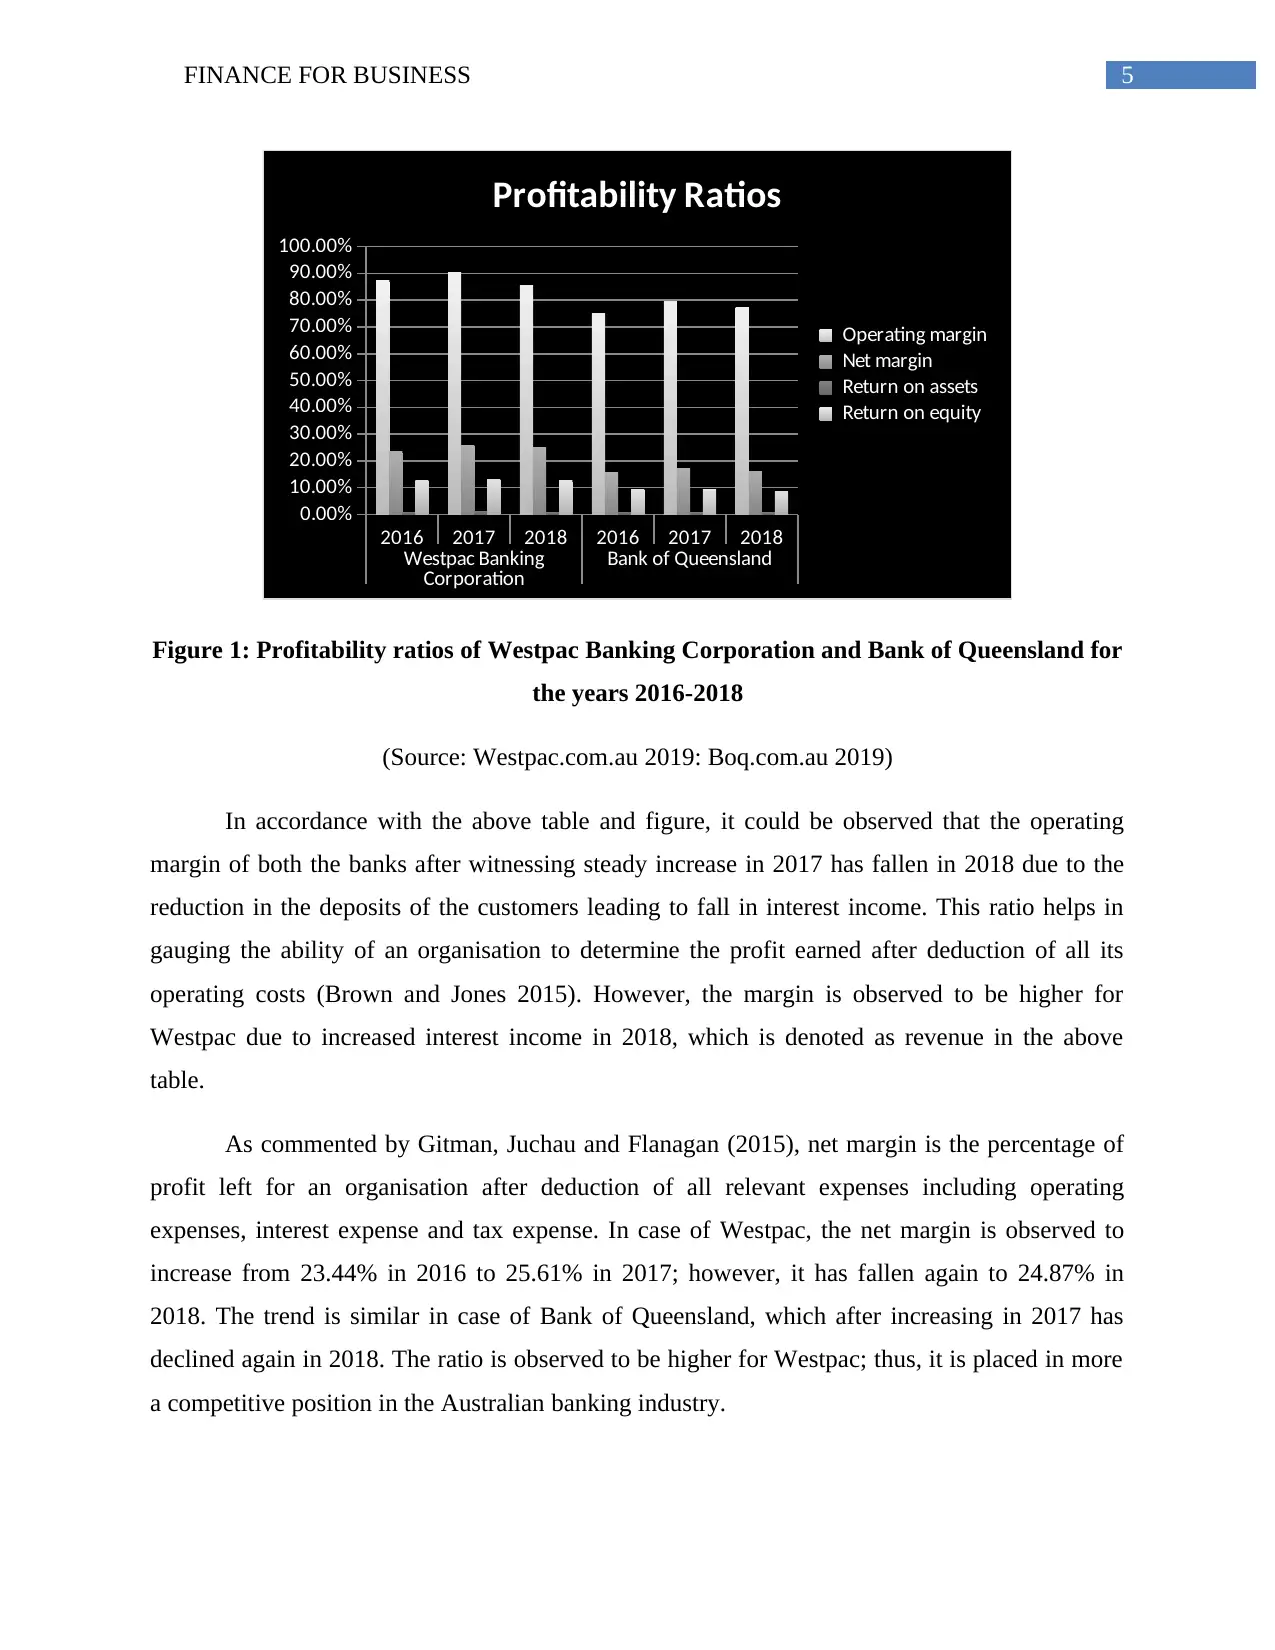
Figure 1: Profitability ratios of Westpac Banking Corporation and Bank of Queensland for
the years 2016-2018
(Source: Westpac.com.au 2019: Boq.com.au 2019)
In accordance with the above table and figure, it could be observed that the operating
margin of both the banks after witnessing steady increase in 2017 has fallen in 2018 due to the
reduction in the deposits of the customers leading to fall in interest income. This ratio helps in
gauging the ability of an organisation to determine the profit earned after deduction of all its
operating costs (Brown and Jones 2015). However, the margin is observed to be higher for
Westpac due to increased interest income in 2018, which is denoted as revenue in the above
table.
As commented by Gitman, Juchau and Flanagan (2015), net margin is the percentage of
profit left for an organisation after deduction of all relevant expenses including operating
expenses, interest expense and tax expense. In case of Westpac, the net margin is observed to
increase from 23.44% in 2016 to 25.61% in 2017; however, it has fallen again to 24.87% in
2018. The trend is similar in case of Bank of Queensland, which after increasing in 2017 has
declined again in 2018. The ratio is observed to be higher for Westpac; thus, it is placed in more
a competitive position in the Australian banking industry.
2016 2017 2018 2016 2017 2018
Westpac Banking
Corporation Bank of Queensland
0.00%
10.00%
20.00%
30.00%
40.00%
50.00%
60.00%
70.00%
80.00%
90.00%
100.00%
Profitability Ratios
Operating margin
Net margin
Return on assets
Return on equity
Figure 1: Profitability ratios of Westpac Banking Corporation and Bank of Queensland for
the years 2016-2018
(Source: Westpac.com.au 2019: Boq.com.au 2019)
In accordance with the above table and figure, it could be observed that the operating
margin of both the banks after witnessing steady increase in 2017 has fallen in 2018 due to the
reduction in the deposits of the customers leading to fall in interest income. This ratio helps in
gauging the ability of an organisation to determine the profit earned after deduction of all its
operating costs (Brown and Jones 2015). However, the margin is observed to be higher for
Westpac due to increased interest income in 2018, which is denoted as revenue in the above
table.
As commented by Gitman, Juchau and Flanagan (2015), net margin is the percentage of
profit left for an organisation after deduction of all relevant expenses including operating
expenses, interest expense and tax expense. In case of Westpac, the net margin is observed to
increase from 23.44% in 2016 to 25.61% in 2017; however, it has fallen again to 24.87% in
2018. The trend is similar in case of Bank of Queensland, which after increasing in 2017 has
declined again in 2018. The ratio is observed to be higher for Westpac; thus, it is placed in more
a competitive position in the Australian banking industry.
⊘ This is a preview!⊘
Do you want full access?
Subscribe today to unlock all pages.
Trusted by 1+ million students worldwide
6FINANCE FOR BUSINESS
The return on assets gauges the effectiveness of an organisation in earning a return on its
investment in assets (Halili, Saleh and Zeitun 2015). For both the banks, return on assets after
experiencing increase in 2017 has fallen slightly in 2018 due to increase in assets funded by debt.
In this situation, the position is deemed to be favourable for Westpac, as its return on assets has
been higher in all three years compared to Bank of Queensland. Finally, return on equity gauges
the efficiency of an organisation in utilising money from the shareholders for profit generation
and business expansion (Hatfield 2014). In case of Westpac, the return of assets after increasing
in 2017 has declined slightly in 2018; however, the ratio is observed to be falling for the Bank of
Queensland over three years. Thus, in this aspect as well, Westpac is enjoying competitive
supremacy over the Bank of Queensland in the Australian banking sector.
Considering all the above-discussed points, Westpac is observed to be placed in a better
position in terms of profitability position than the Bank of Queensland in the Australian market.
Liquidity ratios:
For assessing the long-term liquidity or solvency position of Westpac Banking
Corporation and Bank of Queensland, the ratios considered include debt ratio, equity ratio, debt
to equity ratio and interest cover ratio.
Table 2: Long-term liquidity/solvency ratios of Westpac Banking Corporation and Bank of
Queensland for the years 2016-2018
(Source: Westpac.com.au 2019: Boq.com.au 2019)
Paraphrase This Document
Need a fresh take? Get an instant paraphrase of this document with our AI Paraphraser
7FINANCE FOR BUSINESS
2016 2017 2018 2016 2017 2018
Westpac Banking
Corporation Bank of Queensland
-
2.00
4.00
6.00
8.00
10.00
12.00
14.00
16.00
Long-Term Liqudity/Solvency Ratios
Debt ratio
Equity ratio
Debt to equity ratio
Interest cover ratio
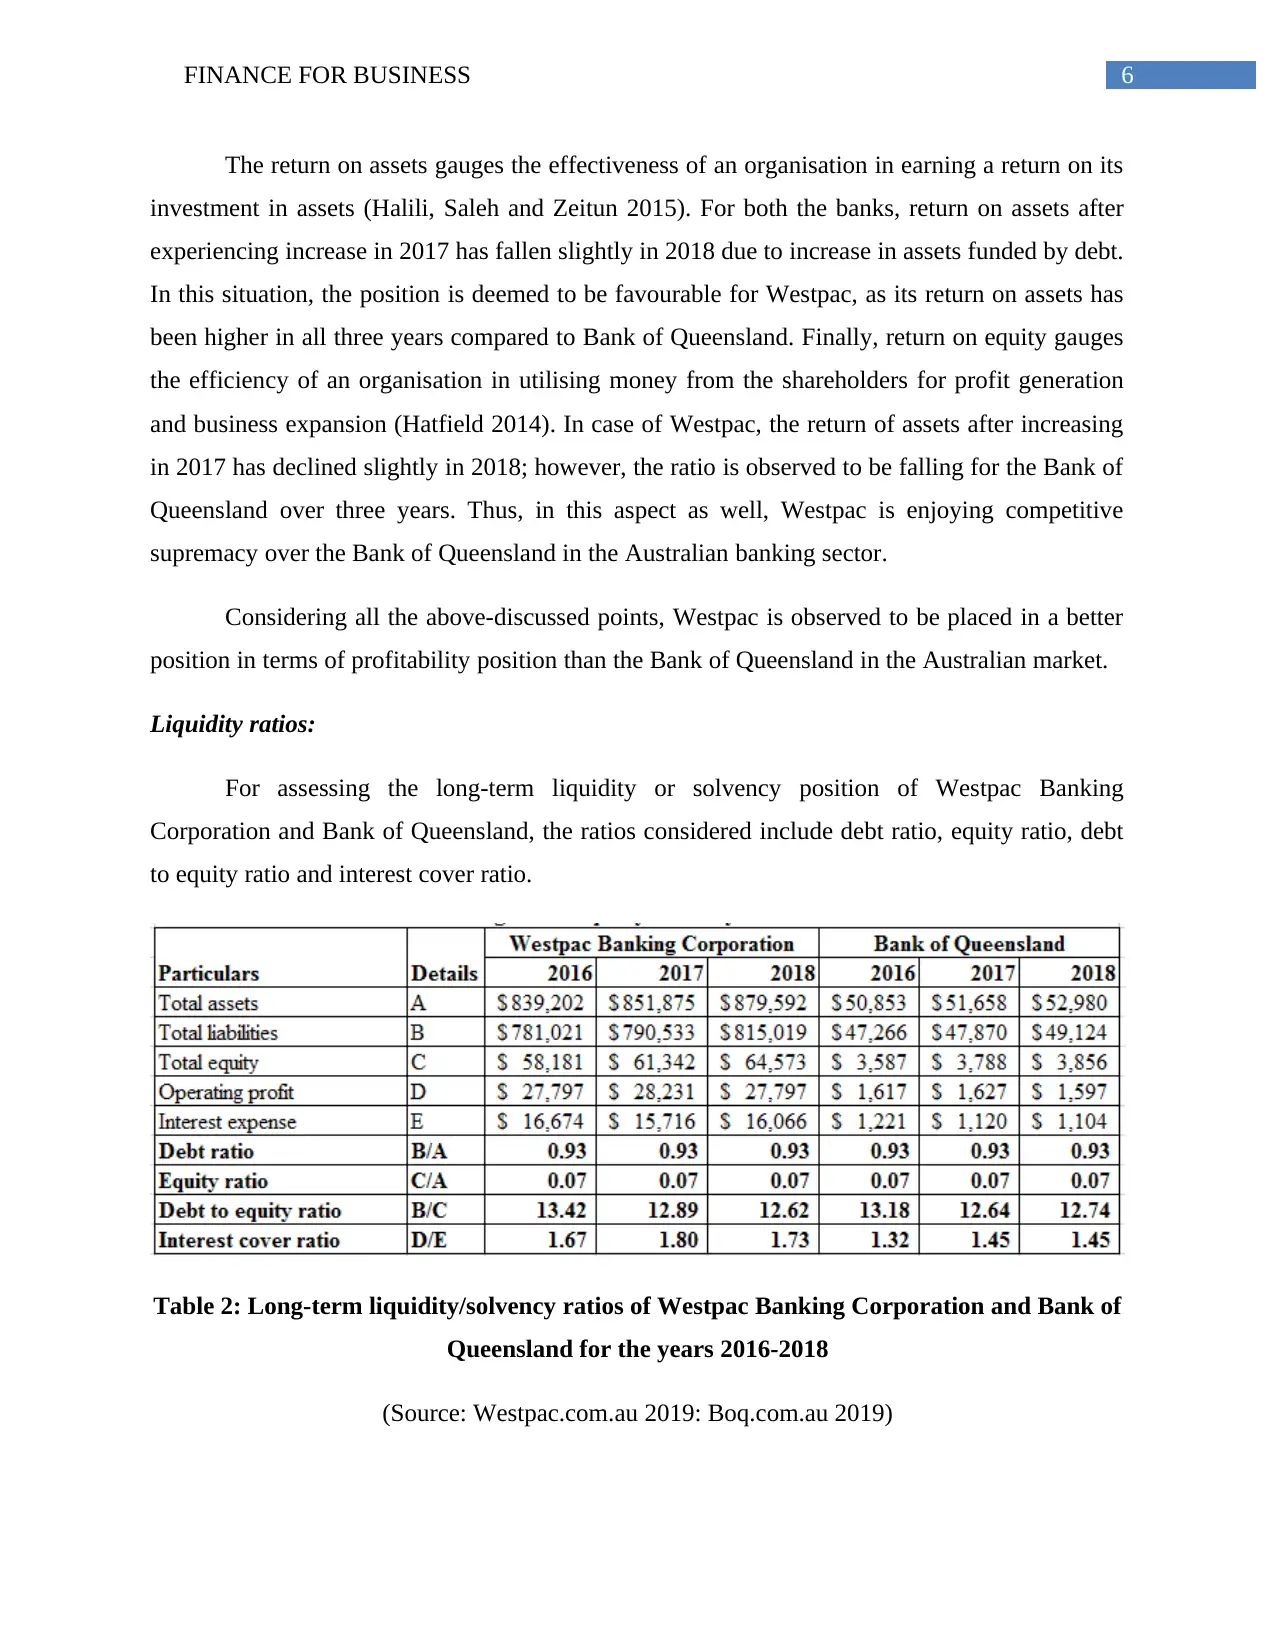
Figure 2: Long-term liquidity/solvency ratios of Westpac Banking Corporation and Bank
of Queensland for the years 2016-2018
(Source: Westpac.com.au 2019: Boq.com.au 2019)
Debt ratio is considered as a solvency measure that gauges the proportion of total
liabilities of an organisation as a percentage of total assets (Henderson et al. 2015). It is observed
from the above figure that both banks have same debt ratio of 0.93 in all the three years, which
denote that 93% of the assets of the banks are funded by debt. On the other hand, equity ratio
denotes the percentage of equity out of the total asset base of an organisation (Hirshleifer 2015).
The situation is similar like debt ratio, as 7% of the overall assets of the two banks are funded by
equity.
Debt to equity ratio helps in denoting the proportion of company financing coming from
investors and creditors (Hoyle, Schaefer and Doupnik 2015). This ratio has remained identical
for both the banks, as most of its assets are funded by public deposits and thus, the banks are
prone to increased financial leverage risk. Finally, interest cover ratio helps in denoting the
capability of an organisation to settle off its interest expense with the help of operating profit
(Kaplan and Atkinson 2015). In terms of this ratio, both banks have the ability to clear its interest
expense efficiently due to higher positive operating income; however, the ratio is found to be
slightly higher for Westpac Banking Corporation.
2016 2017 2018 2016 2017 2018
Westpac Banking
Corporation Bank of Queensland
-
2.00
4.00
6.00
8.00
10.00
12.00
14.00
16.00
Long-Term Liqudity/Solvency Ratios
Debt ratio
Equity ratio
Debt to equity ratio
Interest cover ratio
Figure 2: Long-term liquidity/solvency ratios of Westpac Banking Corporation and Bank
of Queensland for the years 2016-2018
(Source: Westpac.com.au 2019: Boq.com.au 2019)
Debt ratio is considered as a solvency measure that gauges the proportion of total
liabilities of an organisation as a percentage of total assets (Henderson et al. 2015). It is observed
from the above figure that both banks have same debt ratio of 0.93 in all the three years, which
denote that 93% of the assets of the banks are funded by debt. On the other hand, equity ratio
denotes the percentage of equity out of the total asset base of an organisation (Hirshleifer 2015).
The situation is similar like debt ratio, as 7% of the overall assets of the two banks are funded by
equity.
Debt to equity ratio helps in denoting the proportion of company financing coming from
investors and creditors (Hoyle, Schaefer and Doupnik 2015). This ratio has remained identical
for both the banks, as most of its assets are funded by public deposits and thus, the banks are
prone to increased financial leverage risk. Finally, interest cover ratio helps in denoting the
capability of an organisation to settle off its interest expense with the help of operating profit
(Kaplan and Atkinson 2015). In terms of this ratio, both banks have the ability to clear its interest
expense efficiently due to higher positive operating income; however, the ratio is found to be
slightly higher for Westpac Banking Corporation.
8FINANCE FOR BUSINESS
Therefore, in terms of long-term liquidity or solvency, Westpac is placed in a favourable
position in the Australian banking sector compared to the Bank of Queensland.
3. Share price movement analysis:
0
5
10
15
20
25
30
35
40
0
1000
2000
3000
4000
5000
6000
7000
Westpac and All Ordinaries Index
Westpac Close All Ordinaries Index
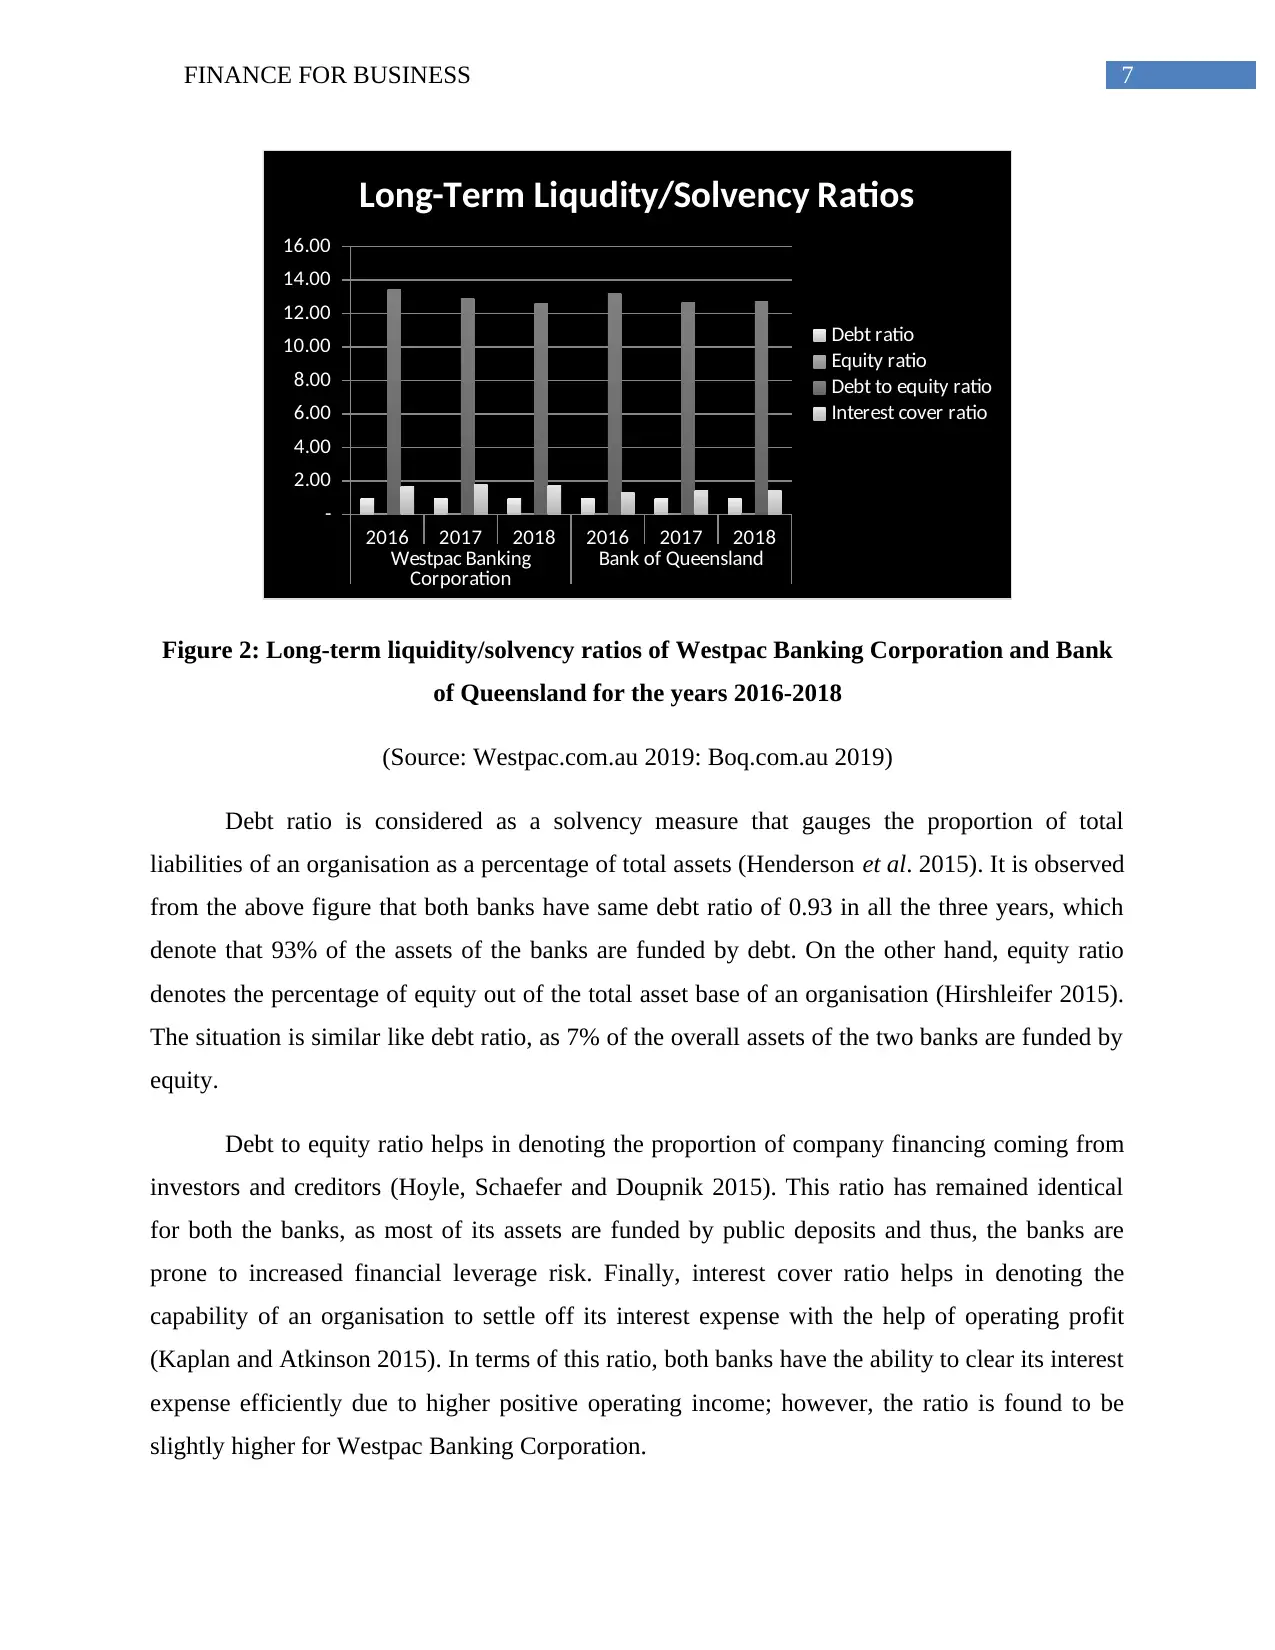
Figure 3: Monthly share price movements of Westpac Banking Corporation in comparison
to All Ordinaries Index for the years 2016-2018
(Source: Au.finance.yahoo.com 2019)
The above figure mainly assists in representing the monthly share price movements of
Westpac Banking Corporation compared to the All Ordinaries Index for three-year period
starting from 2016 to 2018. The analysis directly points out the fact that the entire performance
of Westpac has been declining over the three years. Along with this, the share price of the bank
has failed to complement the rise in share price of the All Ordinaries Index, in which the index
has increased exponentially, while the share price of Westpac has fallen; thus, depicting between
negative correlation between the share price of the bank and the index. The price action of
Westpac has indicated an unfavourable trend, which is expected to fall further in future and thus
would minimise the overall return on investment for the investors. The correlation between the
share price of Westpac and All Ordinaries Index is observed to be -0.211, which indicates that if
Therefore, in terms of long-term liquidity or solvency, Westpac is placed in a favourable
position in the Australian banking sector compared to the Bank of Queensland.
3. Share price movement analysis:
0
5
10
15
20
25
30
35
40
0
1000
2000
3000
4000
5000
6000
7000
Westpac and All Ordinaries Index
Westpac Close All Ordinaries Index
Figure 3: Monthly share price movements of Westpac Banking Corporation in comparison
to All Ordinaries Index for the years 2016-2018
(Source: Au.finance.yahoo.com 2019)
The above figure mainly assists in representing the monthly share price movements of
Westpac Banking Corporation compared to the All Ordinaries Index for three-year period
starting from 2016 to 2018. The analysis directly points out the fact that the entire performance
of Westpac has been declining over the three years. Along with this, the share price of the bank
has failed to complement the rise in share price of the All Ordinaries Index, in which the index
has increased exponentially, while the share price of Westpac has fallen; thus, depicting between
negative correlation between the share price of the bank and the index. The price action of
Westpac has indicated an unfavourable trend, which is expected to fall further in future and thus
would minimise the overall return on investment for the investors. The correlation between the
share price of Westpac and All Ordinaries Index is observed to be -0.211, which indicates that if
⊘ This is a preview!⊘
Do you want full access?
Subscribe today to unlock all pages.
Trusted by 1+ million students worldwide
9FINANCE FOR BUSINESS
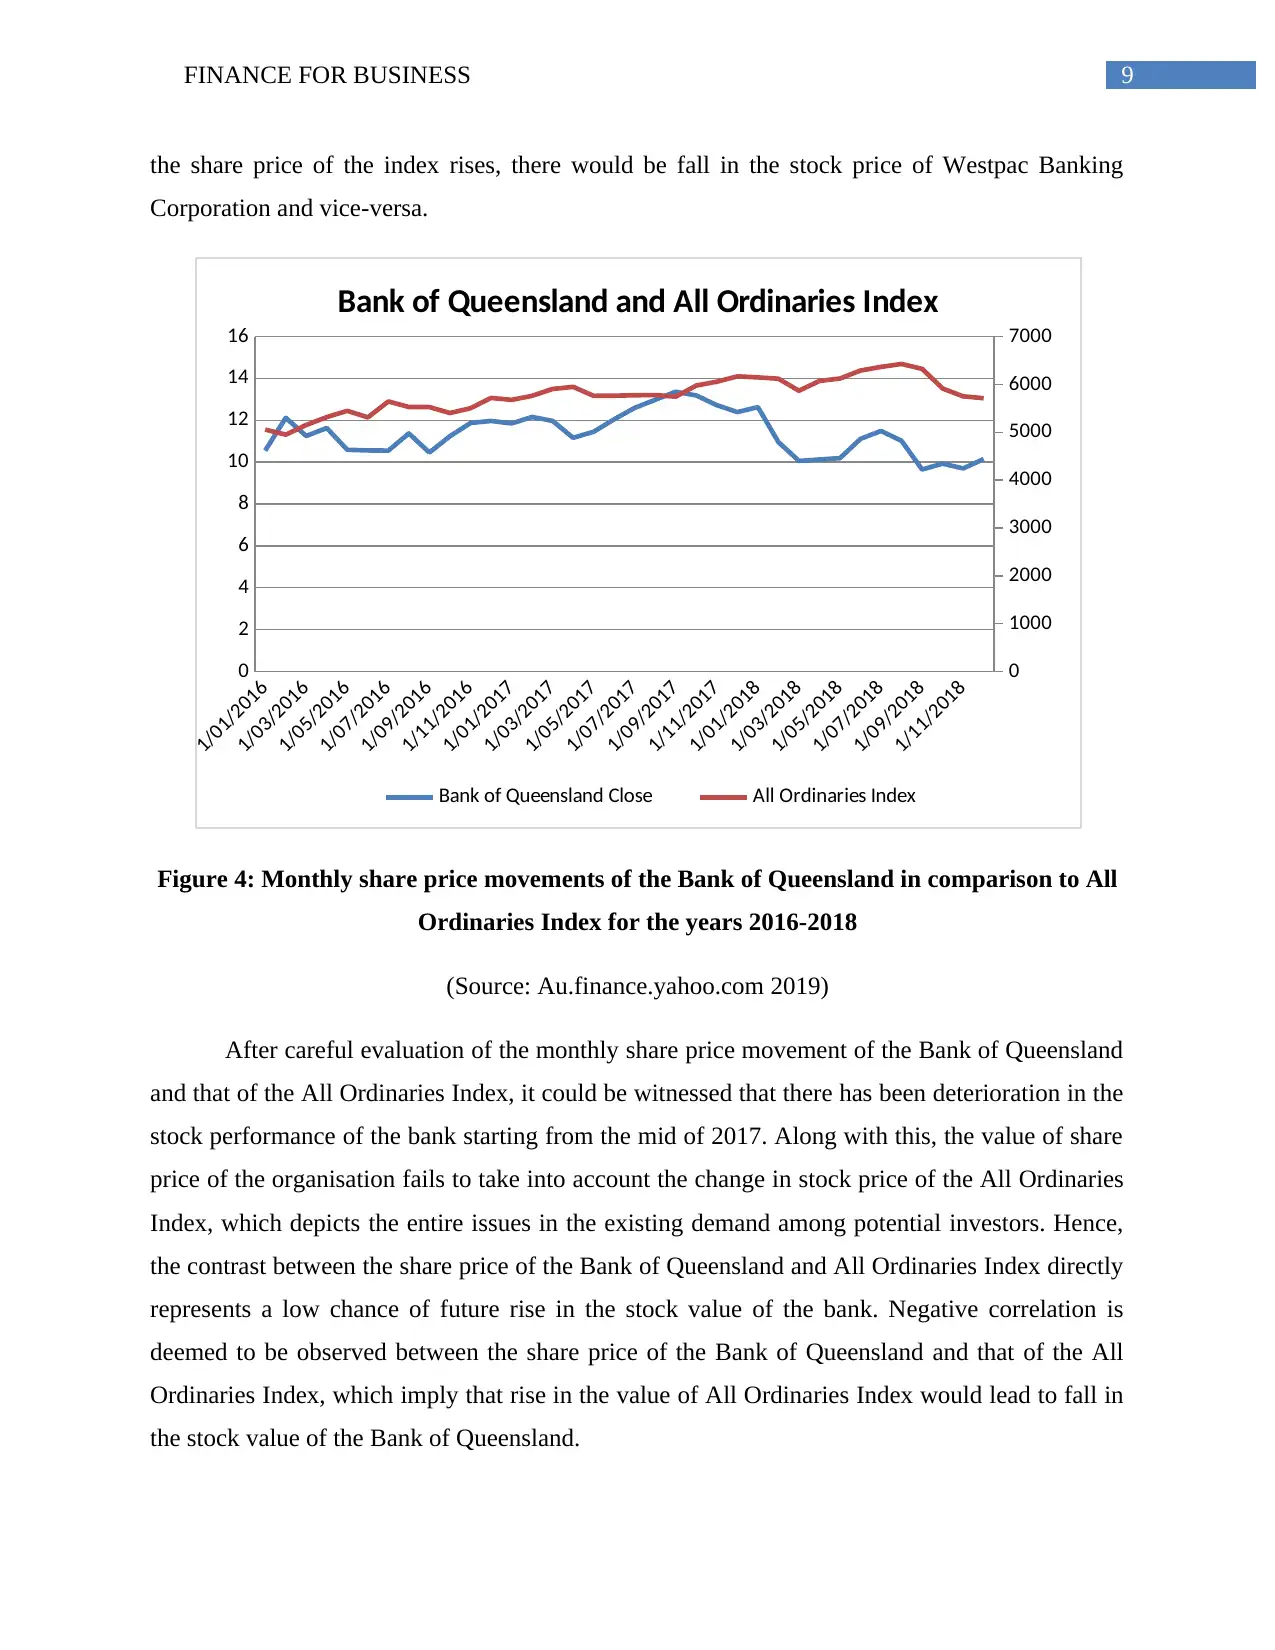
the share price of the index rises, there would be fall in the stock price of Westpac Banking
Corporation and vice-versa.
1/01/2016
1/03/2016
1/05/2016
1/07/2016
1/09/2016
1/11/2016
1/01/2017
1/03/2017
1/05/2017
1/07/2017
1/09/2017
1/11/2017
1/01/2018
1/03/2018
1/05/2018
1/07/2018
1/09/2018
1/11/2018
0
2
4
6
8
10
12
14
16
0
1000
2000
3000
4000
5000
6000
7000
Bank of Queensland and All Ordinaries Index
Bank of Queensland Close All Ordinaries Index
Figure 4: Monthly share price movements of the Bank of Queensland in comparison to All
Ordinaries Index for the years 2016-2018
(Source: Au.finance.yahoo.com 2019)
After careful evaluation of the monthly share price movement of the Bank of Queensland
and that of the All Ordinaries Index, it could be witnessed that there has been deterioration in the
stock performance of the bank starting from the mid of 2017. Along with this, the value of share
price of the organisation fails to take into account the change in stock price of the All Ordinaries
Index, which depicts the entire issues in the existing demand among potential investors. Hence,
the contrast between the share price of the Bank of Queensland and All Ordinaries Index directly
represents a low chance of future rise in the stock value of the bank. Negative correlation is
deemed to be observed between the share price of the Bank of Queensland and that of the All
Ordinaries Index, which imply that rise in the value of All Ordinaries Index would lead to fall in
the stock value of the Bank of Queensland.
Paraphrase This Document
Need a fresh take? Get an instant paraphrase of this document with our AI Paraphraser
10FINANCE FOR BUSINESS
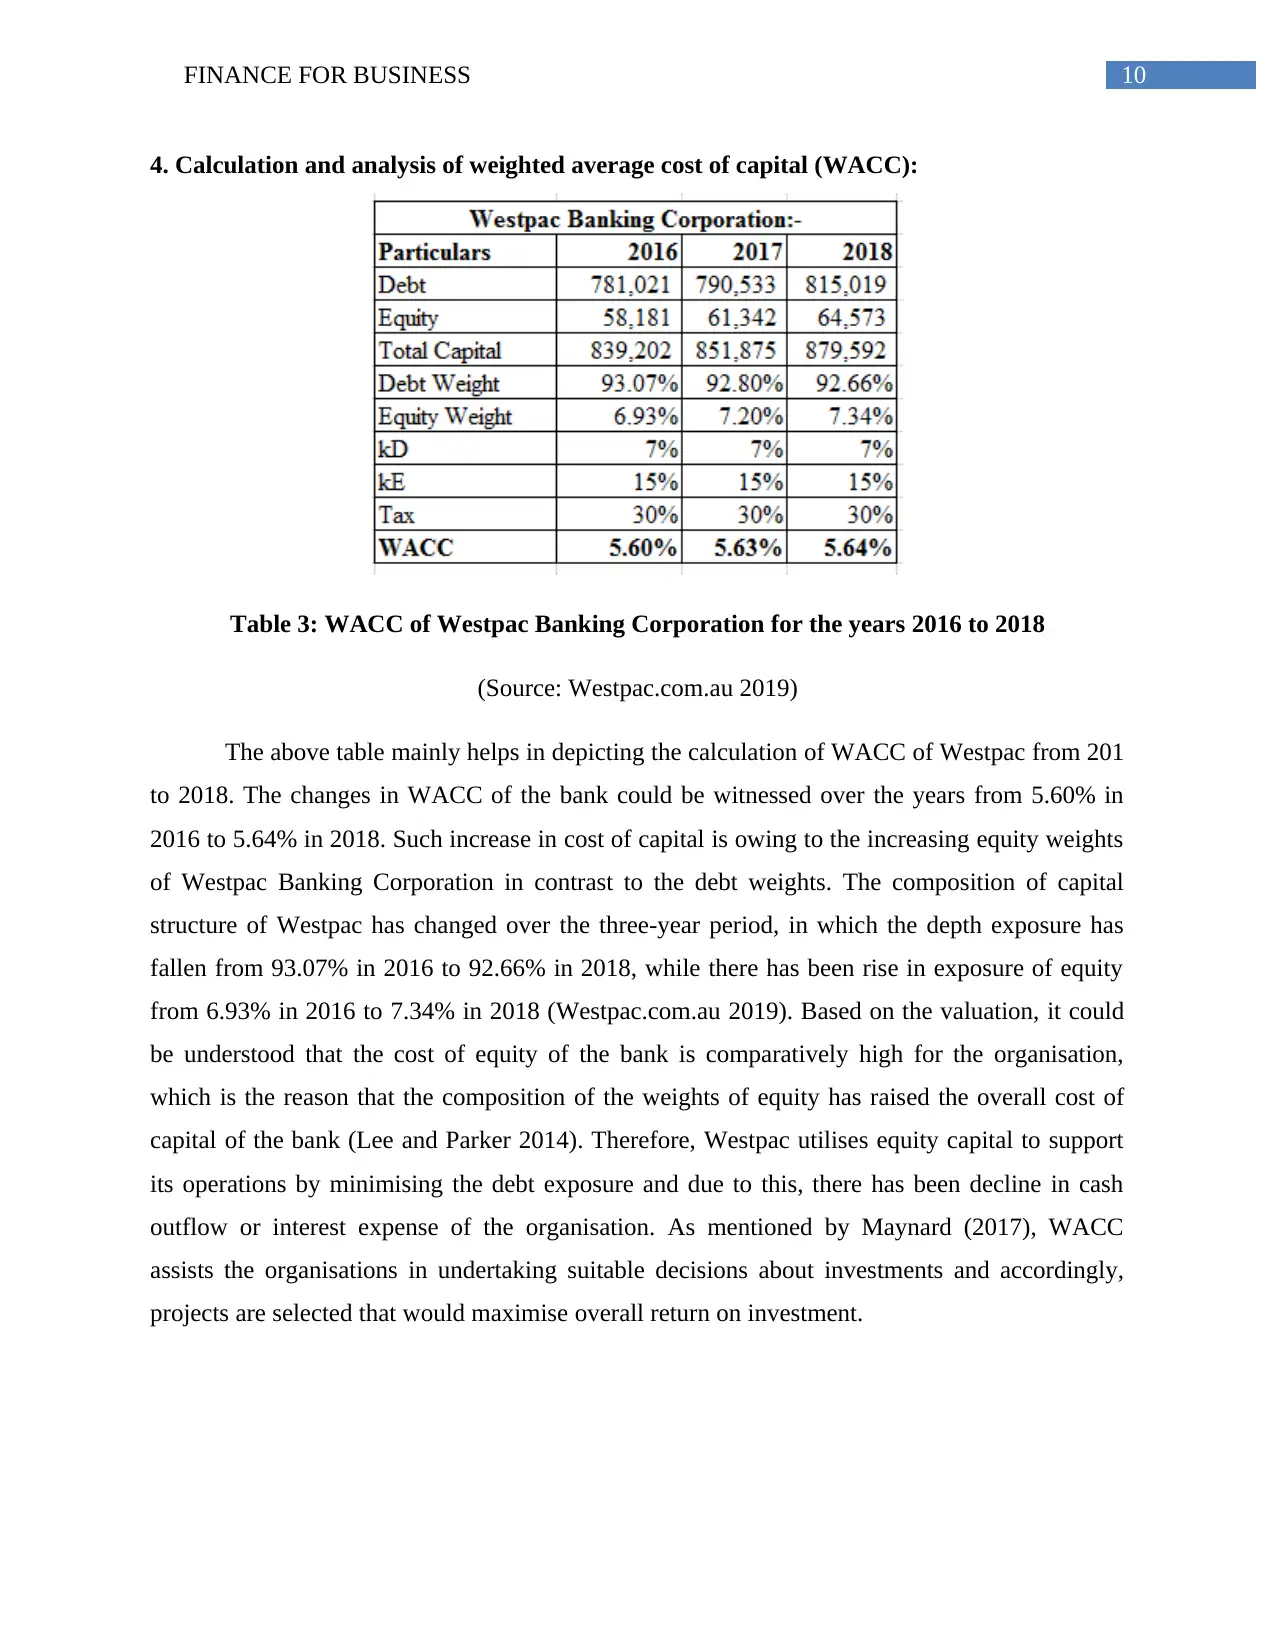
4. Calculation and analysis of weighted average cost of capital (WACC):
Table 3: WACC of Westpac Banking Corporation for the years 2016 to 2018
(Source: Westpac.com.au 2019)
The above table mainly helps in depicting the calculation of WACC of Westpac from 201
to 2018. The changes in WACC of the bank could be witnessed over the years from 5.60% in
2016 to 5.64% in 2018. Such increase in cost of capital is owing to the increasing equity weights
of Westpac Banking Corporation in contrast to the debt weights. The composition of capital
structure of Westpac has changed over the three-year period, in which the depth exposure has
fallen from 93.07% in 2016 to 92.66% in 2018, while there has been rise in exposure of equity
from 6.93% in 2016 to 7.34% in 2018 (Westpac.com.au 2019). Based on the valuation, it could
be understood that the cost of equity of the bank is comparatively high for the organisation,
which is the reason that the composition of the weights of equity has raised the overall cost of
capital of the bank (Lee and Parker 2014). Therefore, Westpac utilises equity capital to support
its operations by minimising the debt exposure and due to this, there has been decline in cash
outflow or interest expense of the organisation. As mentioned by Maynard (2017), WACC
assists the organisations in undertaking suitable decisions about investments and accordingly,
projects are selected that would maximise overall return on investment.
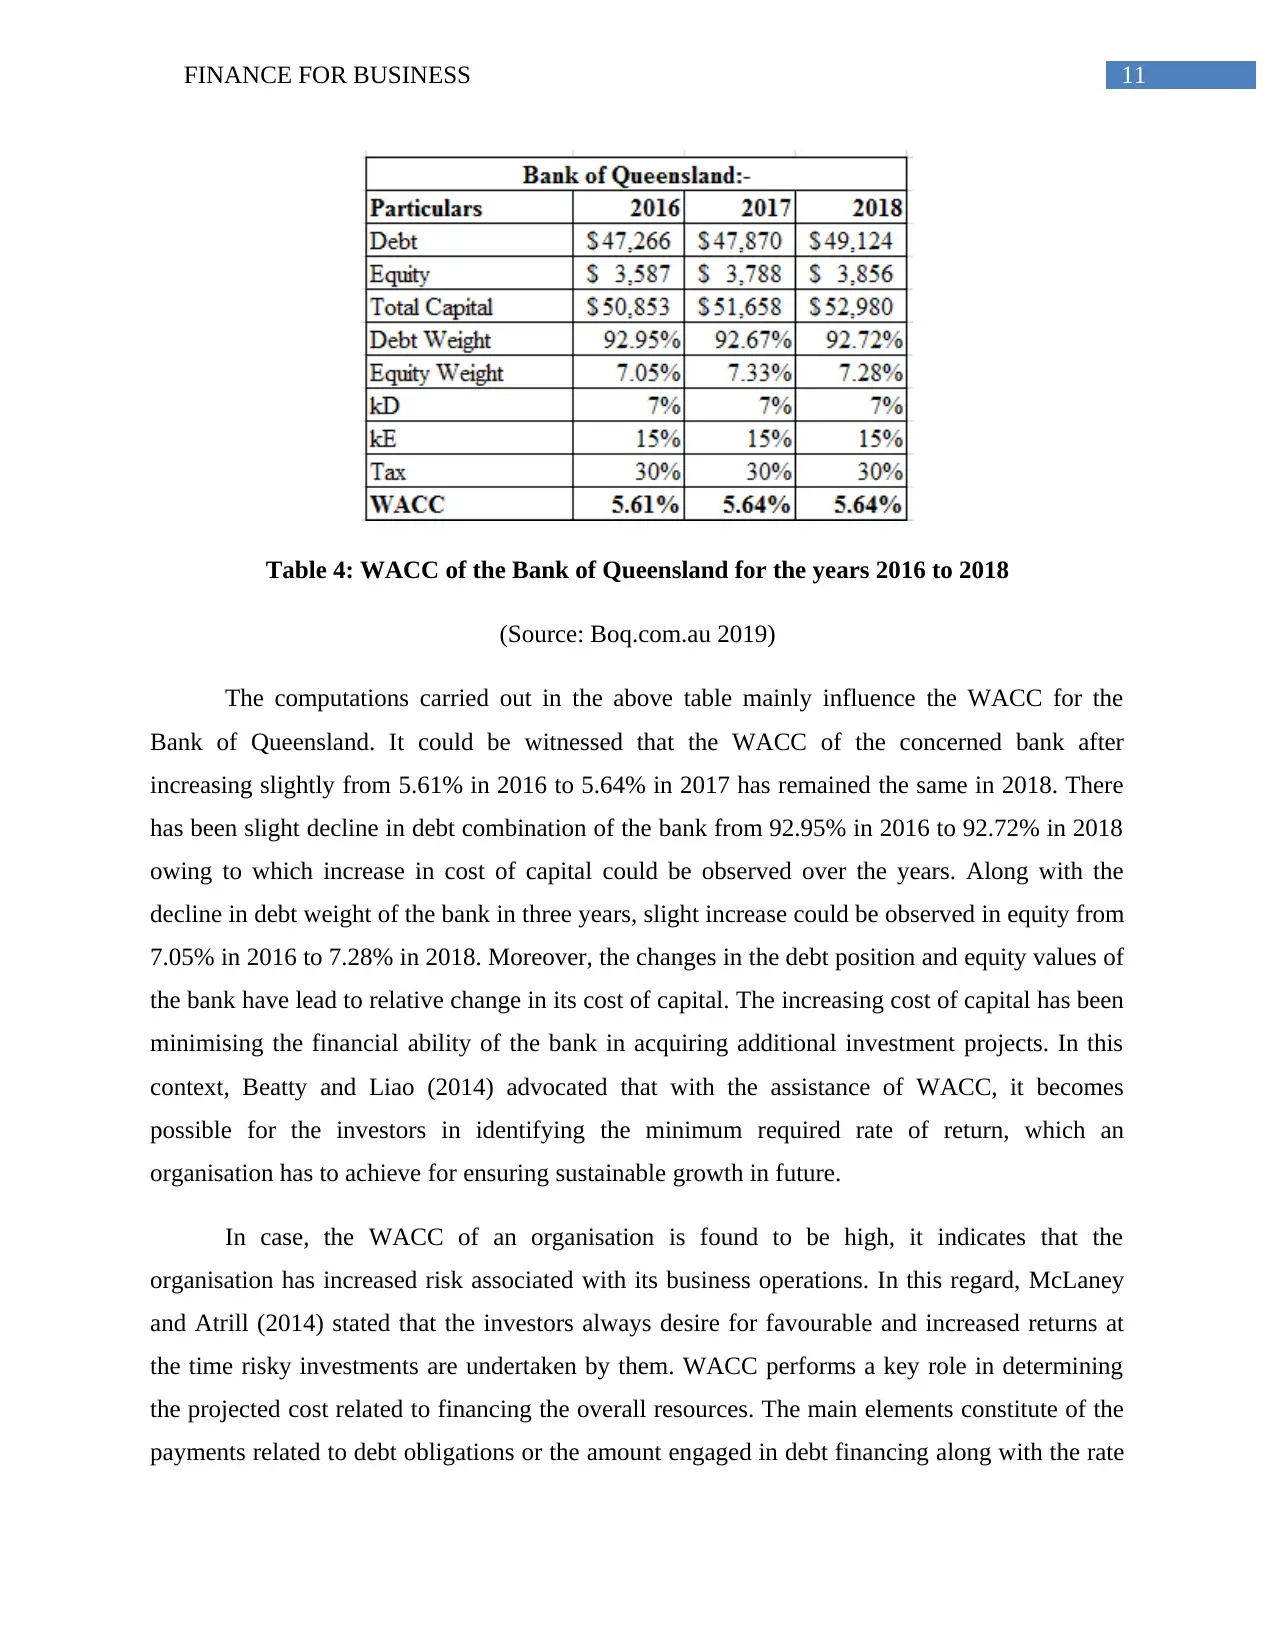
11FINANCE FOR BUSINESS
Table 4: WACC of the Bank of Queensland for the years 2016 to 2018
(Source: Boq.com.au 2019)
The computations carried out in the above table mainly influence the WACC for the
Bank of Queensland. It could be witnessed that the WACC of the concerned bank after
increasing slightly from 5.61% in 2016 to 5.64% in 2017 has remained the same in 2018. There
has been slight decline in debt combination of the bank from 92.95% in 2016 to 92.72% in 2018
owing to which increase in cost of capital could be observed over the years. Along with the
decline in debt weight of the bank in three years, slight increase could be observed in equity from
7.05% in 2016 to 7.28% in 2018. Moreover, the changes in the debt position and equity values of
the bank have lead to relative change in its cost of capital. The increasing cost of capital has been
minimising the financial ability of the bank in acquiring additional investment projects. In this
context, Beatty and Liao (2014) advocated that with the assistance of WACC, it becomes
possible for the investors in identifying the minimum required rate of return, which an
organisation has to achieve for ensuring sustainable growth in future.
In case, the WACC of an organisation is found to be high, it indicates that the
organisation has increased risk associated with its business operations. In this regard, McLaney
and Atrill (2014) stated that the investors always desire for favourable and increased returns at
the time risky investments are undertaken by them. WACC performs a key role in determining
the projected cost related to financing the overall resources. The main elements constitute of the
payments related to debt obligations or the amount engaged in debt financing along with the rate
⊘ This is a preview!⊘
Do you want full access?
Subscribe today to unlock all pages.
Trusted by 1+ million students worldwide
1 out of 18
Related Documents


Your All-in-One AI-Powered Toolkit for Academic Success.
+13062052269
info@desklib.com
Available 24*7 on WhatsApp / Email
![[object Object]](/_next/static/media/star-bottom.7253800d.svg)
Unlock your academic potential
Copyright © 2020–2026 A2Z Services. All Rights Reserved. Developed and managed by ZUCOL.