Project Report: Business Finance - Office Building Loan Analysis
VerifiedAdded on 2020/05/16
|27
|6318
|64
Project
AI Summary
This project report delves into the financial analysis of an office building loan, providing a detailed breakdown of loan calculations. It starts with the determination of the monthly EMI, calculated to be $2,42,655. The report proceeds to calculate the monthly interest payment, which is $1,33,333 for the first month, and the monthly principle payment, which is $1,09,322. The report also includes a loan schedule showing the loan amount after 3 years, which is $1,55,68,577.62. Furthermore, the report compares the total EMI and interest amounts for an 8% interest rate versus a 7% interest rate, along with the costs associated with refinancing. Finally, the report presents a loan schedule for the remaining loan amount after refinancing, with a new EMI of $2,34,972 and a detailed breakdown of interest and closing balance over 84 months. The analysis is based on the data and financial models related to loan amortization and repayment schedules.

Running Head: Business Finance
1
Project report: Business Finance
1
Project report: Business Finance
Paraphrase This Document
Need a fresh take? Get an instant paraphrase of this document with our AI Paraphraser
Business Finance
2
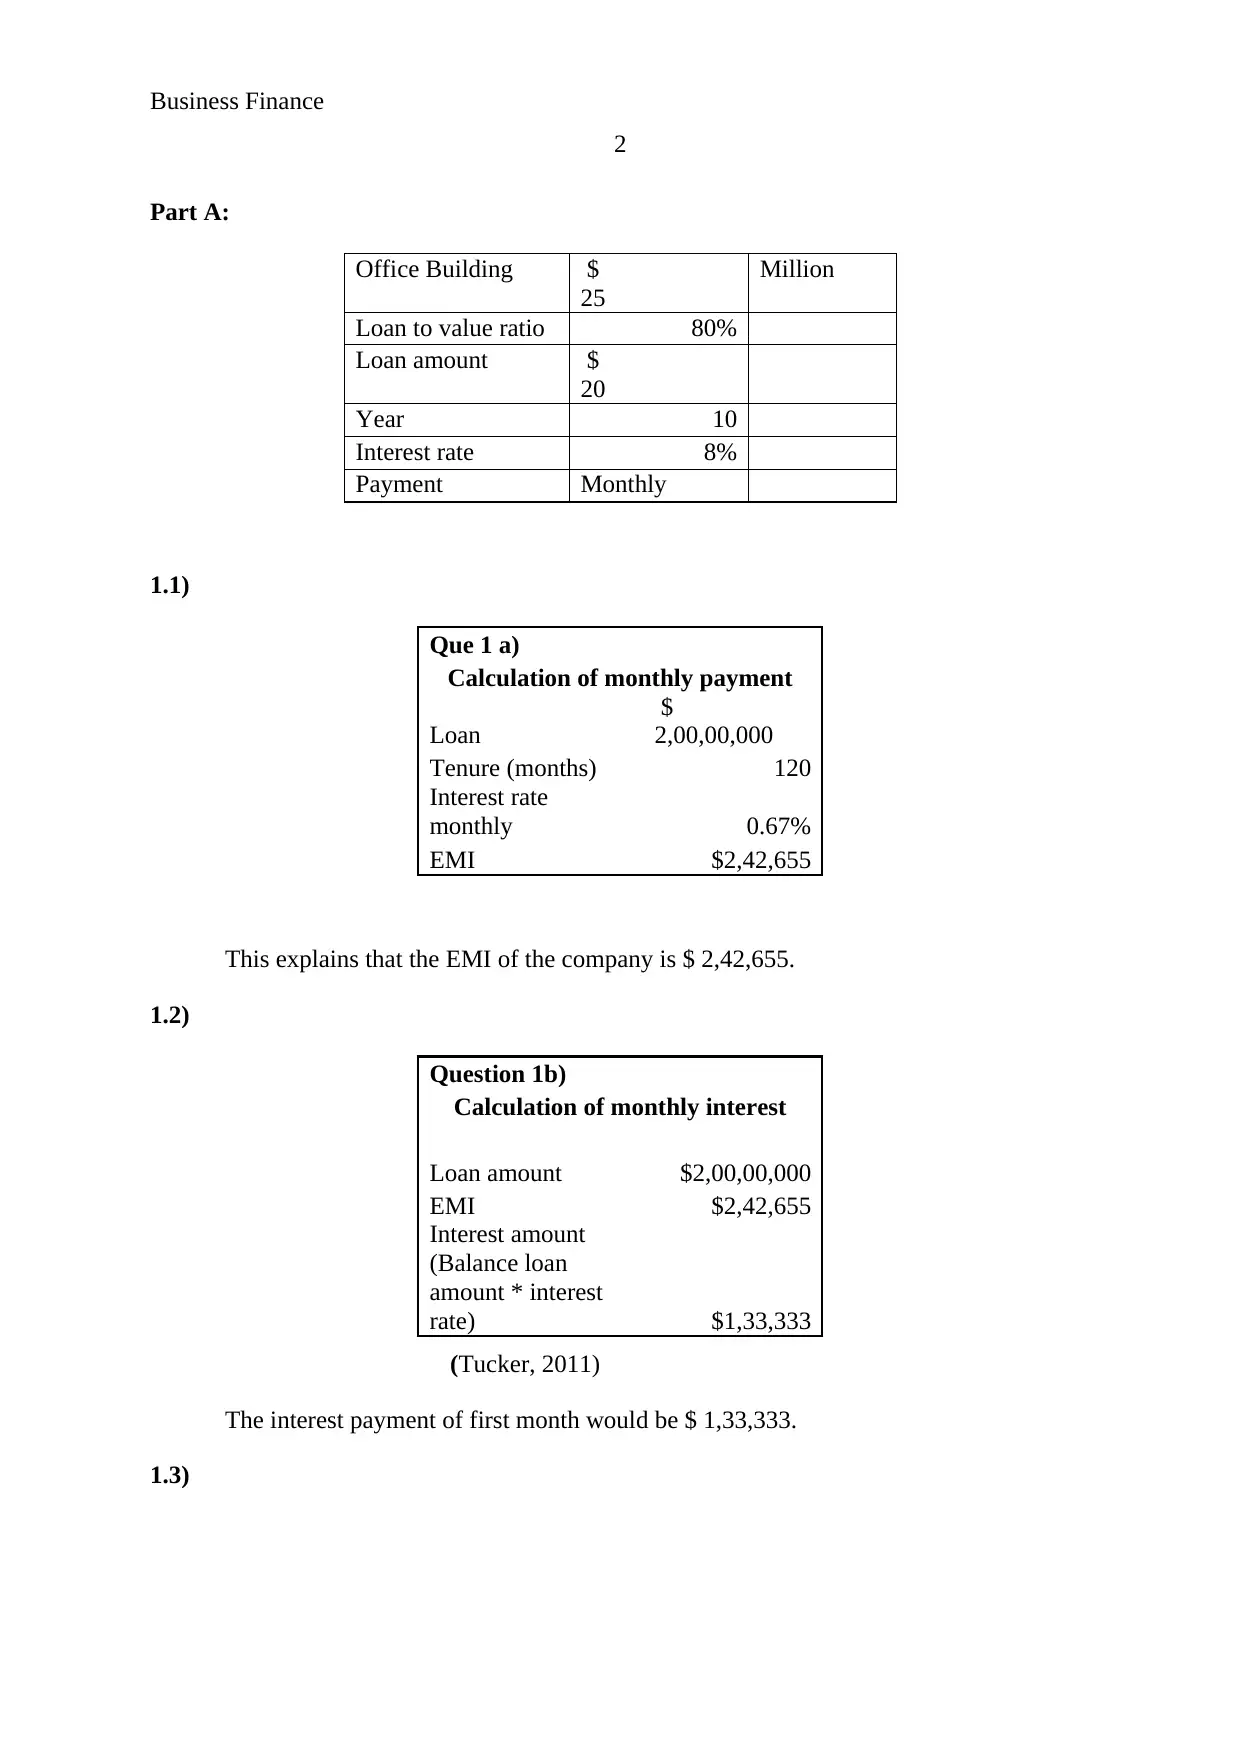
Part A:
Office Building $
25
Million
Loan to value ratio 80%
Loan amount $
20
Year 10
Interest rate 8%
Payment Monthly
1.1)
Que 1 a)
Calculation of monthly payment
Loan
$
2,00,00,000
Tenure (months) 120
Interest rate
monthly 0.67%
EMI $2,42,655
This explains that the EMI of the company is $ 2,42,655.
1.2)
Question 1b)
Calculation of monthly interest
Loan amount $2,00,00,000
EMI $2,42,655
Interest amount
(Balance loan
amount * interest
rate) $1,33,333
(Tucker, 2011)
The interest payment of first month would be $ 1,33,333.
1.3)
2
Part A:
Office Building $
25
Million
Loan to value ratio 80%
Loan amount $
20
Year 10
Interest rate 8%
Payment Monthly
1.1)
Que 1 a)
Calculation of monthly payment
Loan
$
2,00,00,000
Tenure (months) 120
Interest rate
monthly 0.67%
EMI $2,42,655
This explains that the EMI of the company is $ 2,42,655.
1.2)
Question 1b)
Calculation of monthly interest
Loan amount $2,00,00,000
EMI $2,42,655
Interest amount
(Balance loan
amount * interest
rate) $1,33,333
(Tucker, 2011)
The interest payment of first month would be $ 1,33,333.
1.3)
Business Finance
3
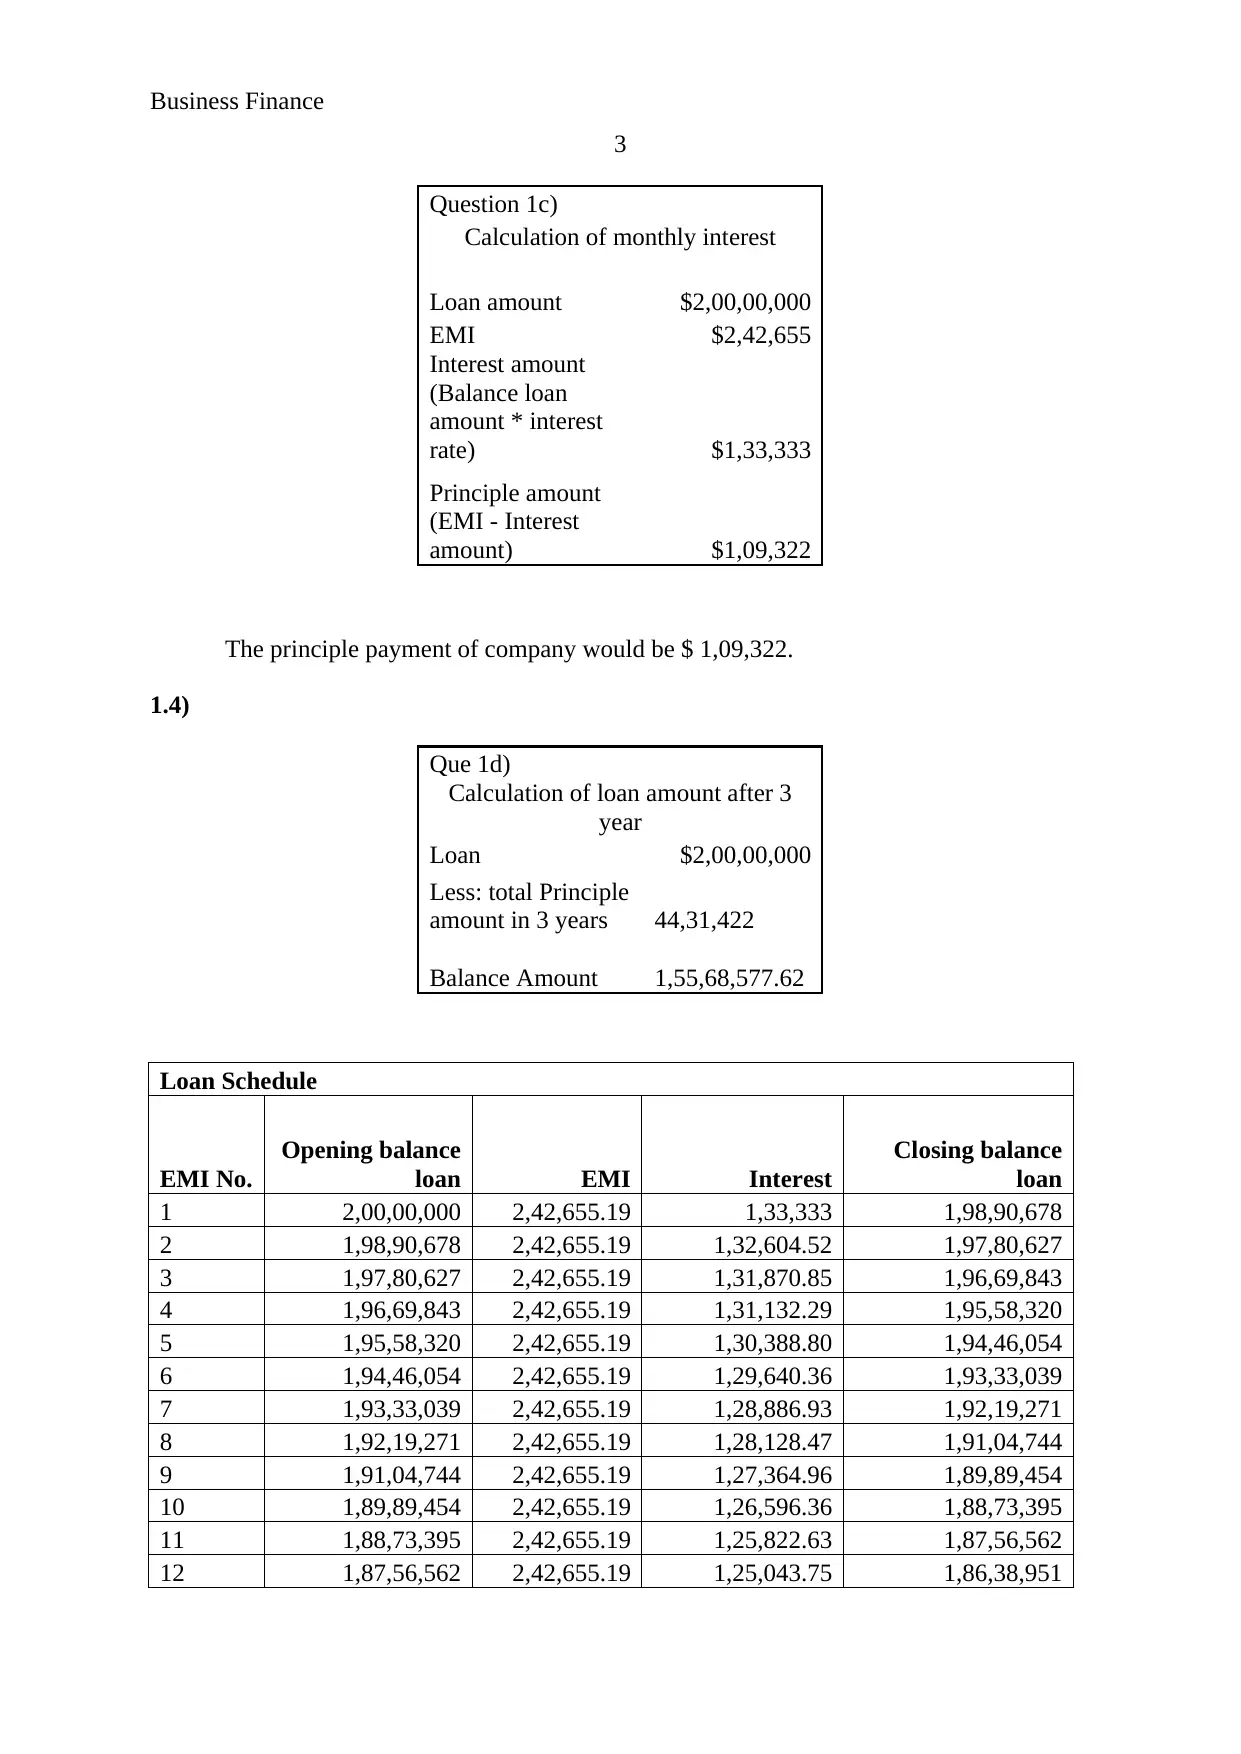
Question 1c)
Calculation of monthly interest
Loan amount $2,00,00,000
EMI $2,42,655
Interest amount
(Balance loan
amount * interest
rate) $1,33,333
Principle amount
(EMI - Interest
amount) $1,09,322
The principle payment of company would be $ 1,09,322.
1.4)
Que 1d)
Calculation of loan amount after 3
year
Loan $2,00,00,000
Less: total Principle
amount in 3 years 44,31,422
Balance Amount 1,55,68,577.62
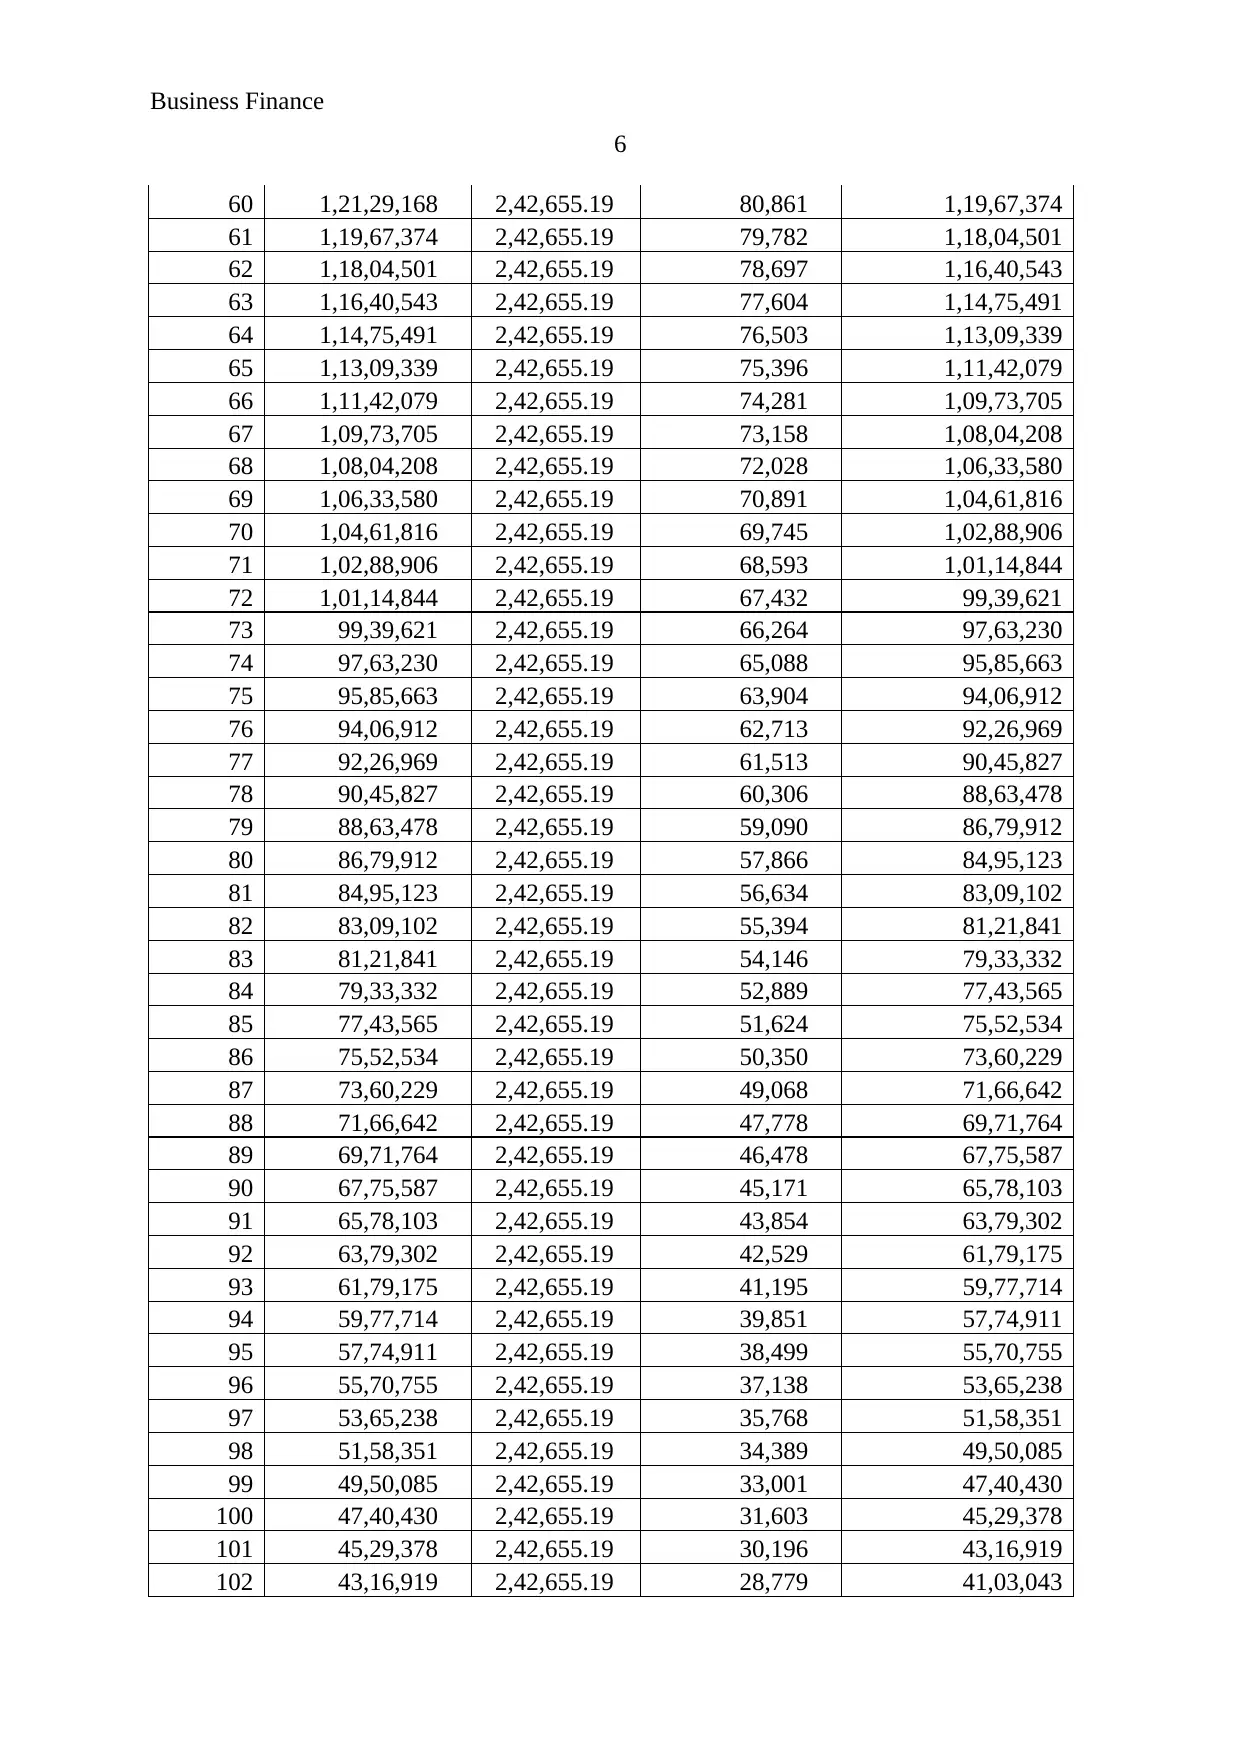
Loan Schedule
EMI No.
Opening balance
loan EMI Interest
Closing balance
loan
1 2,00,00,000 2,42,655.19 1,33,333 1,98,90,678
2 1,98,90,678 2,42,655.19 1,32,604.52 1,97,80,627
3 1,97,80,627 2,42,655.19 1,31,870.85 1,96,69,843
4 1,96,69,843 2,42,655.19 1,31,132.29 1,95,58,320
5 1,95,58,320 2,42,655.19 1,30,388.80 1,94,46,054
6 1,94,46,054 2,42,655.19 1,29,640.36 1,93,33,039
7 1,93,33,039 2,42,655.19 1,28,886.93 1,92,19,271
8 1,92,19,271 2,42,655.19 1,28,128.47 1,91,04,744
9 1,91,04,744 2,42,655.19 1,27,364.96 1,89,89,454
10 1,89,89,454 2,42,655.19 1,26,596.36 1,88,73,395
11 1,88,73,395 2,42,655.19 1,25,822.63 1,87,56,562
12 1,87,56,562 2,42,655.19 1,25,043.75 1,86,38,951
3
Question 1c)
Calculation of monthly interest
Loan amount $2,00,00,000
EMI $2,42,655
Interest amount
(Balance loan
amount * interest
rate) $1,33,333
Principle amount
(EMI - Interest
amount) $1,09,322
The principle payment of company would be $ 1,09,322.
1.4)
Que 1d)
Calculation of loan amount after 3
year
Loan $2,00,00,000
Less: total Principle
amount in 3 years 44,31,422
Balance Amount 1,55,68,577.62
Loan Schedule
EMI No.
Opening balance
loan EMI Interest
Closing balance
loan
1 2,00,00,000 2,42,655.19 1,33,333 1,98,90,678
2 1,98,90,678 2,42,655.19 1,32,604.52 1,97,80,627
3 1,97,80,627 2,42,655.19 1,31,870.85 1,96,69,843
4 1,96,69,843 2,42,655.19 1,31,132.29 1,95,58,320
5 1,95,58,320 2,42,655.19 1,30,388.80 1,94,46,054
6 1,94,46,054 2,42,655.19 1,29,640.36 1,93,33,039
7 1,93,33,039 2,42,655.19 1,28,886.93 1,92,19,271
8 1,92,19,271 2,42,655.19 1,28,128.47 1,91,04,744
9 1,91,04,744 2,42,655.19 1,27,364.96 1,89,89,454
10 1,89,89,454 2,42,655.19 1,26,596.36 1,88,73,395
11 1,88,73,395 2,42,655.19 1,25,822.63 1,87,56,562
12 1,87,56,562 2,42,655.19 1,25,043.75 1,86,38,951
⊘ This is a preview!⊘
Do you want full access?
Subscribe today to unlock all pages.
Trusted by 1+ million students worldwide
Business Finance
4
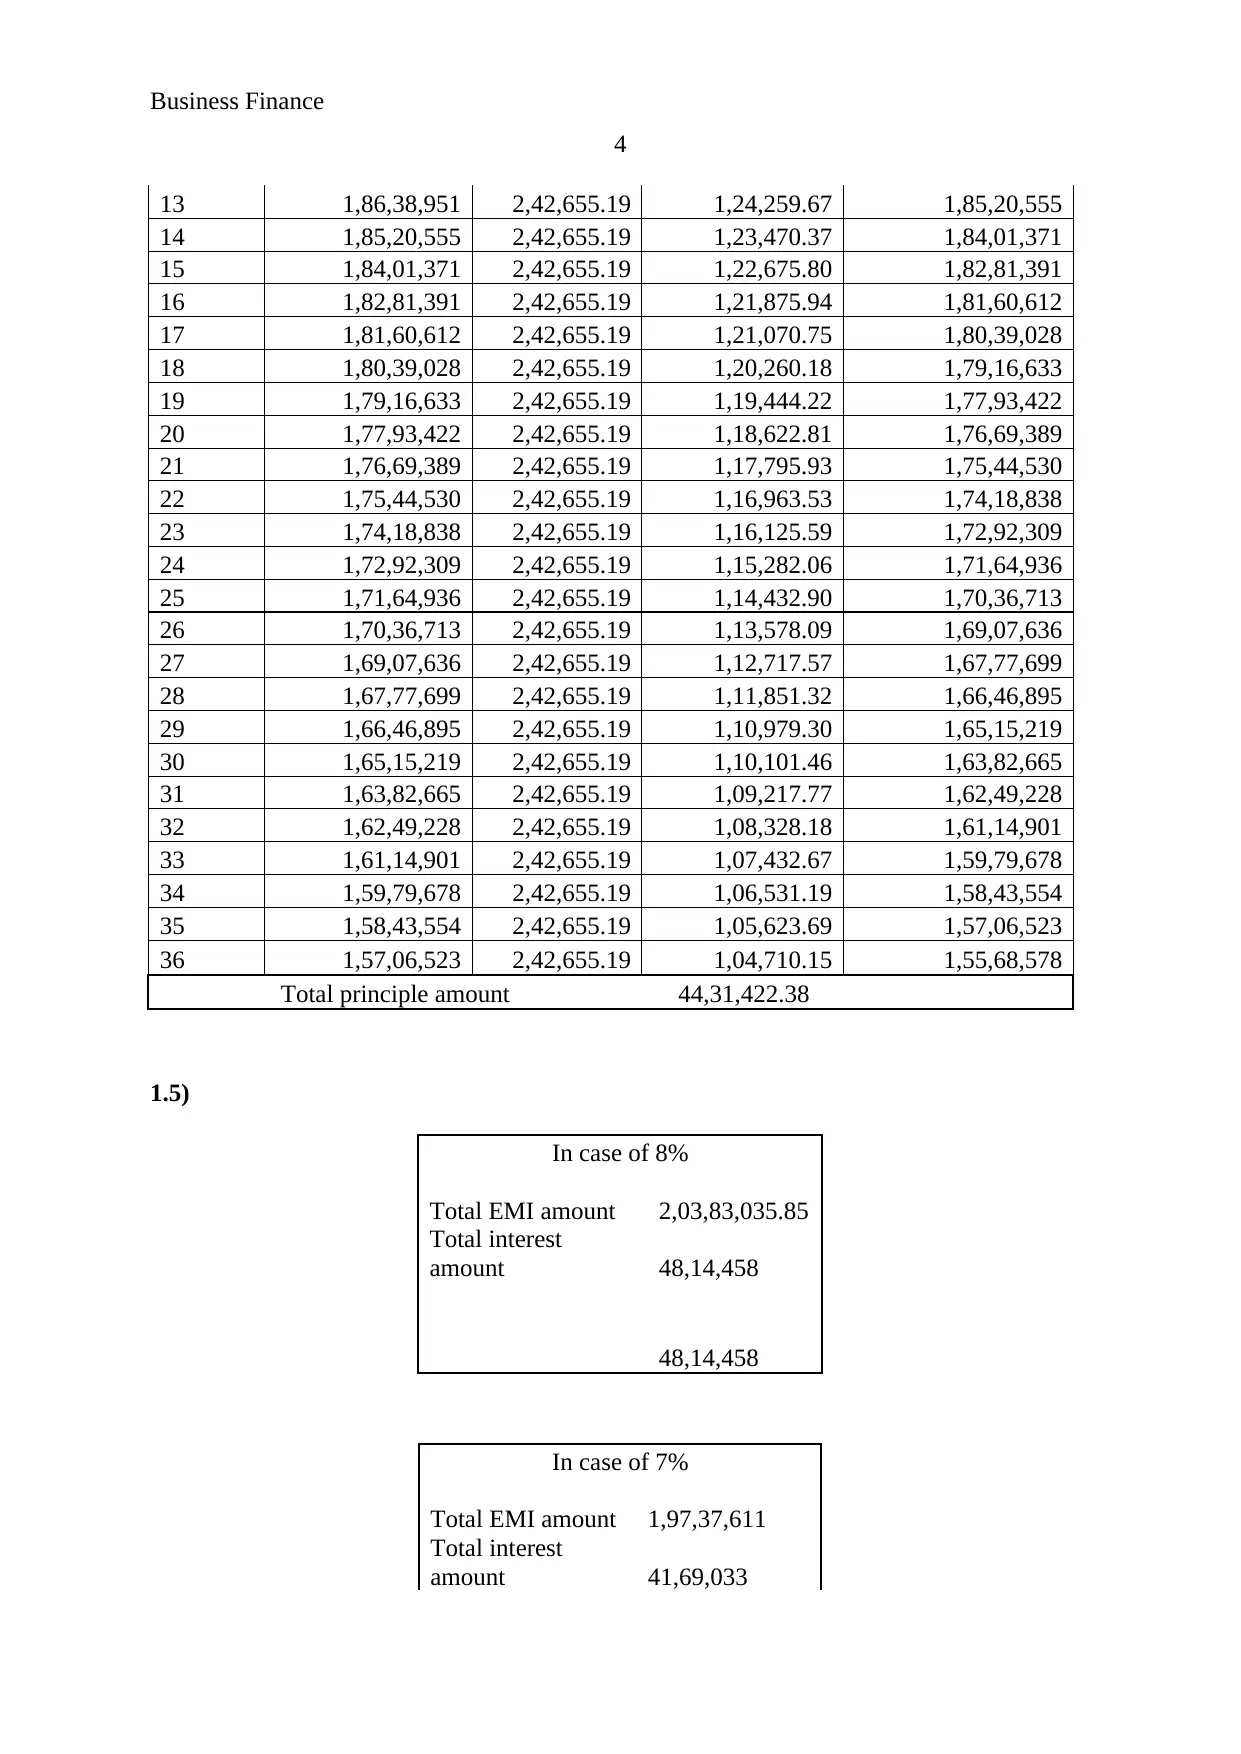
13 1,86,38,951 2,42,655.19 1,24,259.67 1,85,20,555
14 1,85,20,555 2,42,655.19 1,23,470.37 1,84,01,371
15 1,84,01,371 2,42,655.19 1,22,675.80 1,82,81,391
16 1,82,81,391 2,42,655.19 1,21,875.94 1,81,60,612
17 1,81,60,612 2,42,655.19 1,21,070.75 1,80,39,028
18 1,80,39,028 2,42,655.19 1,20,260.18 1,79,16,633
19 1,79,16,633 2,42,655.19 1,19,444.22 1,77,93,422
20 1,77,93,422 2,42,655.19 1,18,622.81 1,76,69,389
21 1,76,69,389 2,42,655.19 1,17,795.93 1,75,44,530
22 1,75,44,530 2,42,655.19 1,16,963.53 1,74,18,838
23 1,74,18,838 2,42,655.19 1,16,125.59 1,72,92,309
24 1,72,92,309 2,42,655.19 1,15,282.06 1,71,64,936
25 1,71,64,936 2,42,655.19 1,14,432.90 1,70,36,713
26 1,70,36,713 2,42,655.19 1,13,578.09 1,69,07,636
27 1,69,07,636 2,42,655.19 1,12,717.57 1,67,77,699
28 1,67,77,699 2,42,655.19 1,11,851.32 1,66,46,895
29 1,66,46,895 2,42,655.19 1,10,979.30 1,65,15,219
30 1,65,15,219 2,42,655.19 1,10,101.46 1,63,82,665
31 1,63,82,665 2,42,655.19 1,09,217.77 1,62,49,228
32 1,62,49,228 2,42,655.19 1,08,328.18 1,61,14,901
33 1,61,14,901 2,42,655.19 1,07,432.67 1,59,79,678
34 1,59,79,678 2,42,655.19 1,06,531.19 1,58,43,554
35 1,58,43,554 2,42,655.19 1,05,623.69 1,57,06,523
36 1,57,06,523 2,42,655.19 1,04,710.15 1,55,68,578
Total principle amount 44,31,422.38
1.5)
In case of 8%
Total EMI amount 2,03,83,035.85
Total interest
amount 48,14,458
48,14,458
In case of 7%
Total EMI amount 1,97,37,611
Total interest
amount 41,69,033
4
13 1,86,38,951 2,42,655.19 1,24,259.67 1,85,20,555
14 1,85,20,555 2,42,655.19 1,23,470.37 1,84,01,371
15 1,84,01,371 2,42,655.19 1,22,675.80 1,82,81,391
16 1,82,81,391 2,42,655.19 1,21,875.94 1,81,60,612
17 1,81,60,612 2,42,655.19 1,21,070.75 1,80,39,028
18 1,80,39,028 2,42,655.19 1,20,260.18 1,79,16,633
19 1,79,16,633 2,42,655.19 1,19,444.22 1,77,93,422
20 1,77,93,422 2,42,655.19 1,18,622.81 1,76,69,389
21 1,76,69,389 2,42,655.19 1,17,795.93 1,75,44,530
22 1,75,44,530 2,42,655.19 1,16,963.53 1,74,18,838
23 1,74,18,838 2,42,655.19 1,16,125.59 1,72,92,309
24 1,72,92,309 2,42,655.19 1,15,282.06 1,71,64,936
25 1,71,64,936 2,42,655.19 1,14,432.90 1,70,36,713
26 1,70,36,713 2,42,655.19 1,13,578.09 1,69,07,636
27 1,69,07,636 2,42,655.19 1,12,717.57 1,67,77,699
28 1,67,77,699 2,42,655.19 1,11,851.32 1,66,46,895
29 1,66,46,895 2,42,655.19 1,10,979.30 1,65,15,219
30 1,65,15,219 2,42,655.19 1,10,101.46 1,63,82,665
31 1,63,82,665 2,42,655.19 1,09,217.77 1,62,49,228
32 1,62,49,228 2,42,655.19 1,08,328.18 1,61,14,901
33 1,61,14,901 2,42,655.19 1,07,432.67 1,59,79,678
34 1,59,79,678 2,42,655.19 1,06,531.19 1,58,43,554
35 1,58,43,554 2,42,655.19 1,05,623.69 1,57,06,523
36 1,57,06,523 2,42,655.19 1,04,710.15 1,55,68,578
Total principle amount 44,31,422.38
1.5)
In case of 8%
Total EMI amount 2,03,83,035.85
Total interest
amount 48,14,458
48,14,458
In case of 7%
Total EMI amount 1,97,37,611
Total interest
amount 41,69,033
Paraphrase This Document
Need a fresh take? Get an instant paraphrase of this document with our AI Paraphraser
Business Finance
5
Refinanced cost 2,50,000
44,19,033
Que 1 e)
Calculation of monthly payment
Loan
$
1,55,68,578
Tenure (months) 84
Interest rate
monthly 0.58%
EMI $2,34,972
Loan Schedule
EMI No.
Opening balance
loan EMI Interest
Closing balance
loan
37 1,55,68,578 2,42,655.19 1,03,791 1,54,29,713
38 1,54,29,713 2,42,655.19 1,02,865 1,52,89,923
39 1,52,89,923 2,42,655.19 1,01,933 1,51,49,200
40 1,51,49,200 2,42,655.19 1,00,995 1,50,07,540
41 1,50,07,540 2,42,655.19 1,00,050 1,48,64,935
42 1,48,64,935 2,42,655.19 99,100 1,47,21,379
43 1,47,21,379 2,42,655.19 98,143 1,45,76,866
44 1,45,76,866 2,42,655.19 97,179 1,44,31,390
45 1,44,31,390 2,42,655.19 96,209 1,42,84,944
46 1,42,84,944 2,42,655.19 95,233 1,41,37,522
47 1,41,37,522 2,42,655.19 94,250 1,39,89,117
48 1,39,89,117 2,42,655.19 93,261 1,38,39,723
49 1,38,39,723 2,42,655.19 92,265 1,36,89,332
50 1,36,89,332 2,42,655.19 91,262 1,35,37,939
51 1,35,37,939 2,42,655.19 90,253 1,33,85,537
52 1,33,85,537 2,42,655.19 89,237 1,32,32,119
53 1,32,32,119 2,42,655.19 88,214 1,30,77,678
54 1,30,77,678 2,42,655.19 87,185 1,29,22,207
55 1,29,22,207 2,42,655.19 86,148 1,27,65,700
56 1,27,65,700 2,42,655.19 85,105 1,26,08,149
57 1,26,08,149 2,42,655.19 84,054 1,24,49,549
58 1,24,49,549 2,42,655.19 82,997 1,22,89,890
59 1,22,89,890 2,42,655.19 81,933 1,21,29,168
Business Finance
6
60 1,21,29,168 2,42,655.19 80,861 1,19,67,374
61 1,19,67,374 2,42,655.19 79,782 1,18,04,501
62 1,18,04,501 2,42,655.19 78,697 1,16,40,543
63 1,16,40,543 2,42,655.19 77,604 1,14,75,491
64 1,14,75,491 2,42,655.19 76,503 1,13,09,339
65 1,13,09,339 2,42,655.19 75,396 1,11,42,079
66 1,11,42,079 2,42,655.19 74,281 1,09,73,705
67 1,09,73,705 2,42,655.19 73,158 1,08,04,208
68 1,08,04,208 2,42,655.19 72,028 1,06,33,580
69 1,06,33,580 2,42,655.19 70,891 1,04,61,816
70 1,04,61,816 2,42,655.19 69,745 1,02,88,906
71 1,02,88,906 2,42,655.19 68,593 1,01,14,844
72 1,01,14,844 2,42,655.19 67,432 99,39,621
73 99,39,621 2,42,655.19 66,264 97,63,230
74 97,63,230 2,42,655.19 65,088 95,85,663
75 95,85,663 2,42,655.19 63,904 94,06,912
76 94,06,912 2,42,655.19 62,713 92,26,969
77 92,26,969 2,42,655.19 61,513 90,45,827
78 90,45,827 2,42,655.19 60,306 88,63,478
79 88,63,478 2,42,655.19 59,090 86,79,912
80 86,79,912 2,42,655.19 57,866 84,95,123
81 84,95,123 2,42,655.19 56,634 83,09,102
82 83,09,102 2,42,655.19 55,394 81,21,841
83 81,21,841 2,42,655.19 54,146 79,33,332
84 79,33,332 2,42,655.19 52,889 77,43,565
85 77,43,565 2,42,655.19 51,624 75,52,534
86 75,52,534 2,42,655.19 50,350 73,60,229
87 73,60,229 2,42,655.19 49,068 71,66,642
88 71,66,642 2,42,655.19 47,778 69,71,764
89 69,71,764 2,42,655.19 46,478 67,75,587
90 67,75,587 2,42,655.19 45,171 65,78,103
91 65,78,103 2,42,655.19 43,854 63,79,302
92 63,79,302 2,42,655.19 42,529 61,79,175
93 61,79,175 2,42,655.19 41,195 59,77,714
94 59,77,714 2,42,655.19 39,851 57,74,911
95 57,74,911 2,42,655.19 38,499 55,70,755
96 55,70,755 2,42,655.19 37,138 53,65,238
97 53,65,238 2,42,655.19 35,768 51,58,351
98 51,58,351 2,42,655.19 34,389 49,50,085
99 49,50,085 2,42,655.19 33,001 47,40,430
100 47,40,430 2,42,655.19 31,603 45,29,378
101 45,29,378 2,42,655.19 30,196 43,16,919
102 43,16,919 2,42,655.19 28,779 41,03,043
⊘ This is a preview!⊘
Do you want full access?
Subscribe today to unlock all pages.
Trusted by 1+ million students worldwide
Business Finance
7
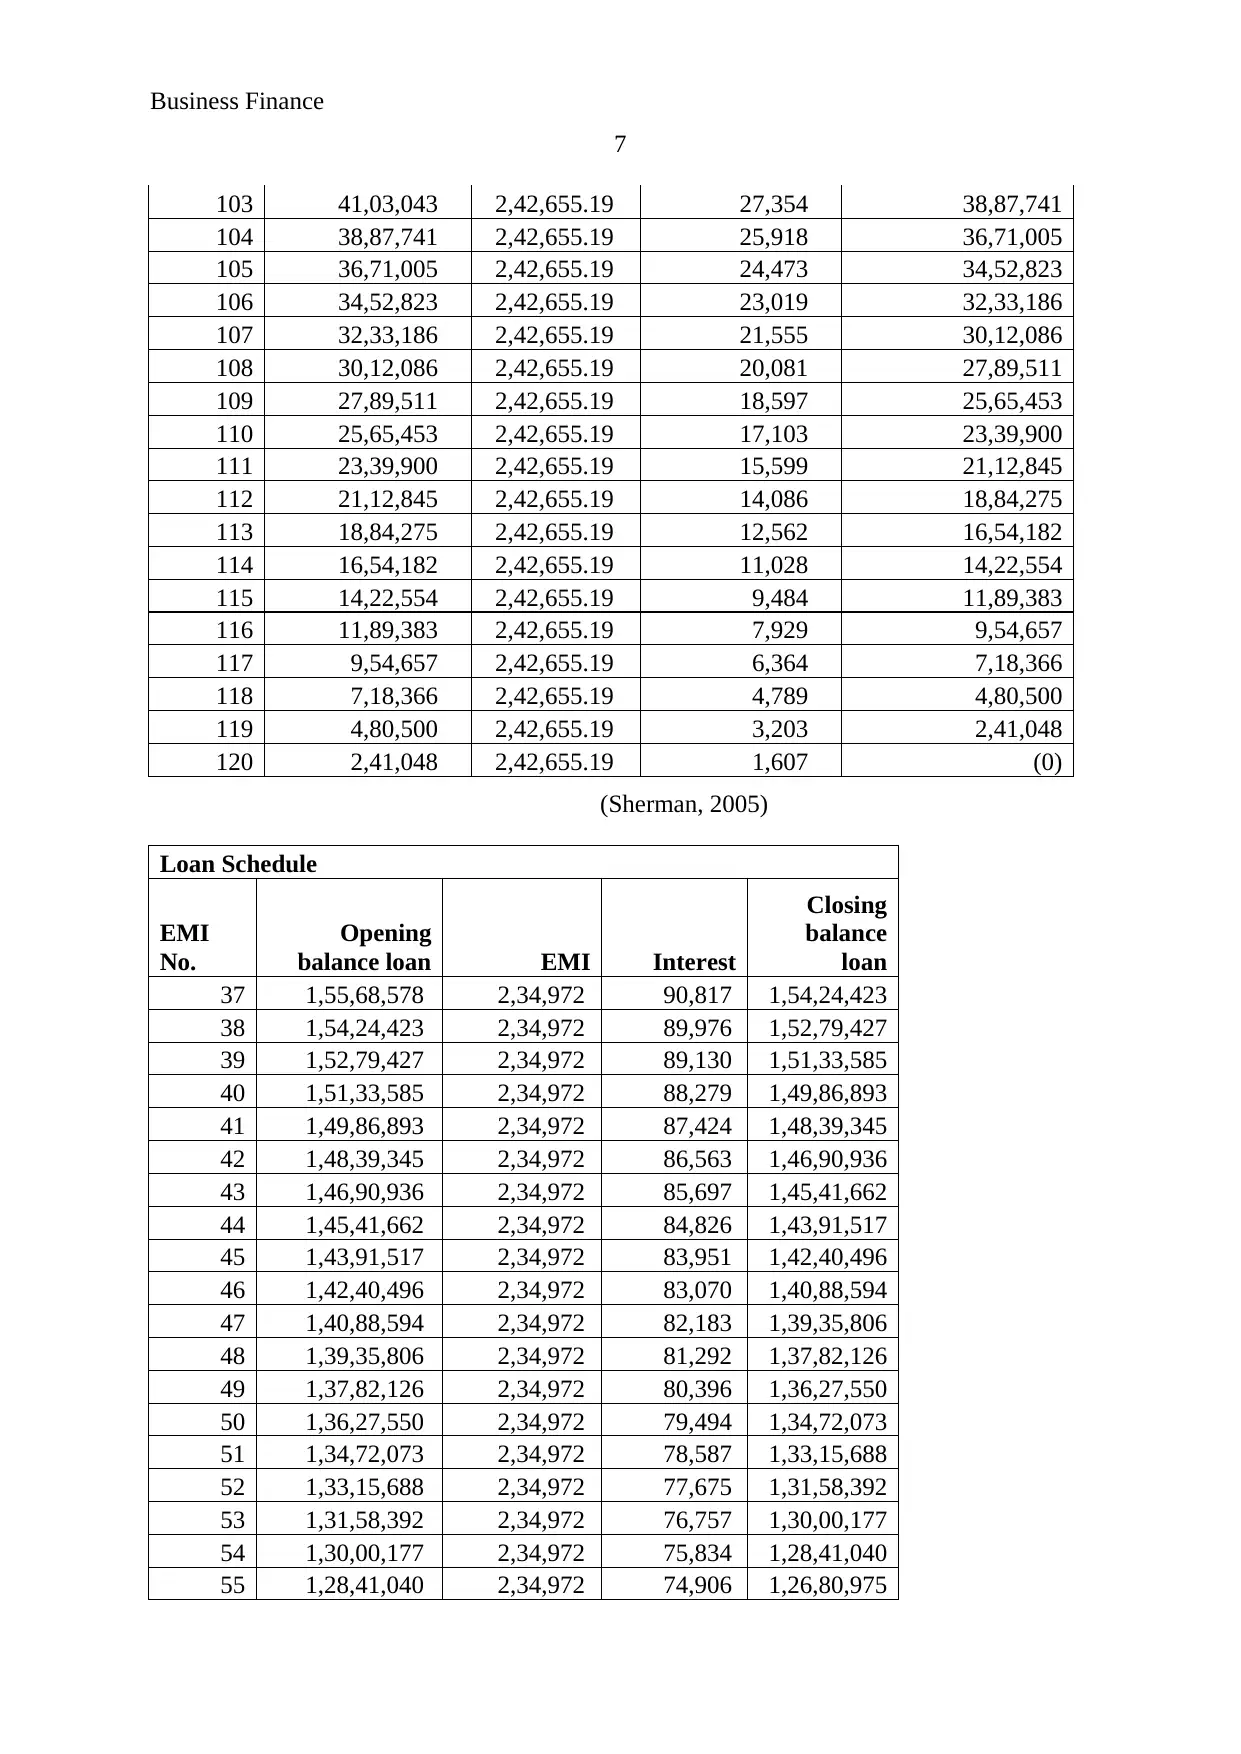
103 41,03,043 2,42,655.19 27,354 38,87,741
104 38,87,741 2,42,655.19 25,918 36,71,005
105 36,71,005 2,42,655.19 24,473 34,52,823
106 34,52,823 2,42,655.19 23,019 32,33,186
107 32,33,186 2,42,655.19 21,555 30,12,086
108 30,12,086 2,42,655.19 20,081 27,89,511
109 27,89,511 2,42,655.19 18,597 25,65,453
110 25,65,453 2,42,655.19 17,103 23,39,900
111 23,39,900 2,42,655.19 15,599 21,12,845
112 21,12,845 2,42,655.19 14,086 18,84,275
113 18,84,275 2,42,655.19 12,562 16,54,182
114 16,54,182 2,42,655.19 11,028 14,22,554
115 14,22,554 2,42,655.19 9,484 11,89,383
116 11,89,383 2,42,655.19 7,929 9,54,657
117 9,54,657 2,42,655.19 6,364 7,18,366
118 7,18,366 2,42,655.19 4,789 4,80,500
119 4,80,500 2,42,655.19 3,203 2,41,048
120 2,41,048 2,42,655.19 1,607 (0)
(Sherman, 2005)
Loan Schedule
EMI
No.
Opening
balance loan EMI Interest
Closing
balance
loan
37 1,55,68,578 2,34,972 90,817 1,54,24,423
38 1,54,24,423 2,34,972 89,976 1,52,79,427
39 1,52,79,427 2,34,972 89,130 1,51,33,585
40 1,51,33,585 2,34,972 88,279 1,49,86,893
41 1,49,86,893 2,34,972 87,424 1,48,39,345
42 1,48,39,345 2,34,972 86,563 1,46,90,936
43 1,46,90,936 2,34,972 85,697 1,45,41,662
44 1,45,41,662 2,34,972 84,826 1,43,91,517
45 1,43,91,517 2,34,972 83,951 1,42,40,496
46 1,42,40,496 2,34,972 83,070 1,40,88,594
47 1,40,88,594 2,34,972 82,183 1,39,35,806
48 1,39,35,806 2,34,972 81,292 1,37,82,126
49 1,37,82,126 2,34,972 80,396 1,36,27,550
50 1,36,27,550 2,34,972 79,494 1,34,72,073
51 1,34,72,073 2,34,972 78,587 1,33,15,688
52 1,33,15,688 2,34,972 77,675 1,31,58,392
53 1,31,58,392 2,34,972 76,757 1,30,00,177
54 1,30,00,177 2,34,972 75,834 1,28,41,040
55 1,28,41,040 2,34,972 74,906 1,26,80,975
7
103 41,03,043 2,42,655.19 27,354 38,87,741
104 38,87,741 2,42,655.19 25,918 36,71,005
105 36,71,005 2,42,655.19 24,473 34,52,823
106 34,52,823 2,42,655.19 23,019 32,33,186
107 32,33,186 2,42,655.19 21,555 30,12,086
108 30,12,086 2,42,655.19 20,081 27,89,511
109 27,89,511 2,42,655.19 18,597 25,65,453
110 25,65,453 2,42,655.19 17,103 23,39,900
111 23,39,900 2,42,655.19 15,599 21,12,845
112 21,12,845 2,42,655.19 14,086 18,84,275
113 18,84,275 2,42,655.19 12,562 16,54,182
114 16,54,182 2,42,655.19 11,028 14,22,554
115 14,22,554 2,42,655.19 9,484 11,89,383
116 11,89,383 2,42,655.19 7,929 9,54,657
117 9,54,657 2,42,655.19 6,364 7,18,366
118 7,18,366 2,42,655.19 4,789 4,80,500
119 4,80,500 2,42,655.19 3,203 2,41,048
120 2,41,048 2,42,655.19 1,607 (0)
(Sherman, 2005)
Loan Schedule
EMI
No.
Opening
balance loan EMI Interest
Closing
balance
loan
37 1,55,68,578 2,34,972 90,817 1,54,24,423
38 1,54,24,423 2,34,972 89,976 1,52,79,427
39 1,52,79,427 2,34,972 89,130 1,51,33,585
40 1,51,33,585 2,34,972 88,279 1,49,86,893
41 1,49,86,893 2,34,972 87,424 1,48,39,345
42 1,48,39,345 2,34,972 86,563 1,46,90,936
43 1,46,90,936 2,34,972 85,697 1,45,41,662
44 1,45,41,662 2,34,972 84,826 1,43,91,517
45 1,43,91,517 2,34,972 83,951 1,42,40,496
46 1,42,40,496 2,34,972 83,070 1,40,88,594
47 1,40,88,594 2,34,972 82,183 1,39,35,806
48 1,39,35,806 2,34,972 81,292 1,37,82,126
49 1,37,82,126 2,34,972 80,396 1,36,27,550
50 1,36,27,550 2,34,972 79,494 1,34,72,073
51 1,34,72,073 2,34,972 78,587 1,33,15,688
52 1,33,15,688 2,34,972 77,675 1,31,58,392
53 1,31,58,392 2,34,972 76,757 1,30,00,177
54 1,30,00,177 2,34,972 75,834 1,28,41,040
55 1,28,41,040 2,34,972 74,906 1,26,80,975
Paraphrase This Document
Need a fresh take? Get an instant paraphrase of this document with our AI Paraphraser
Business Finance
8
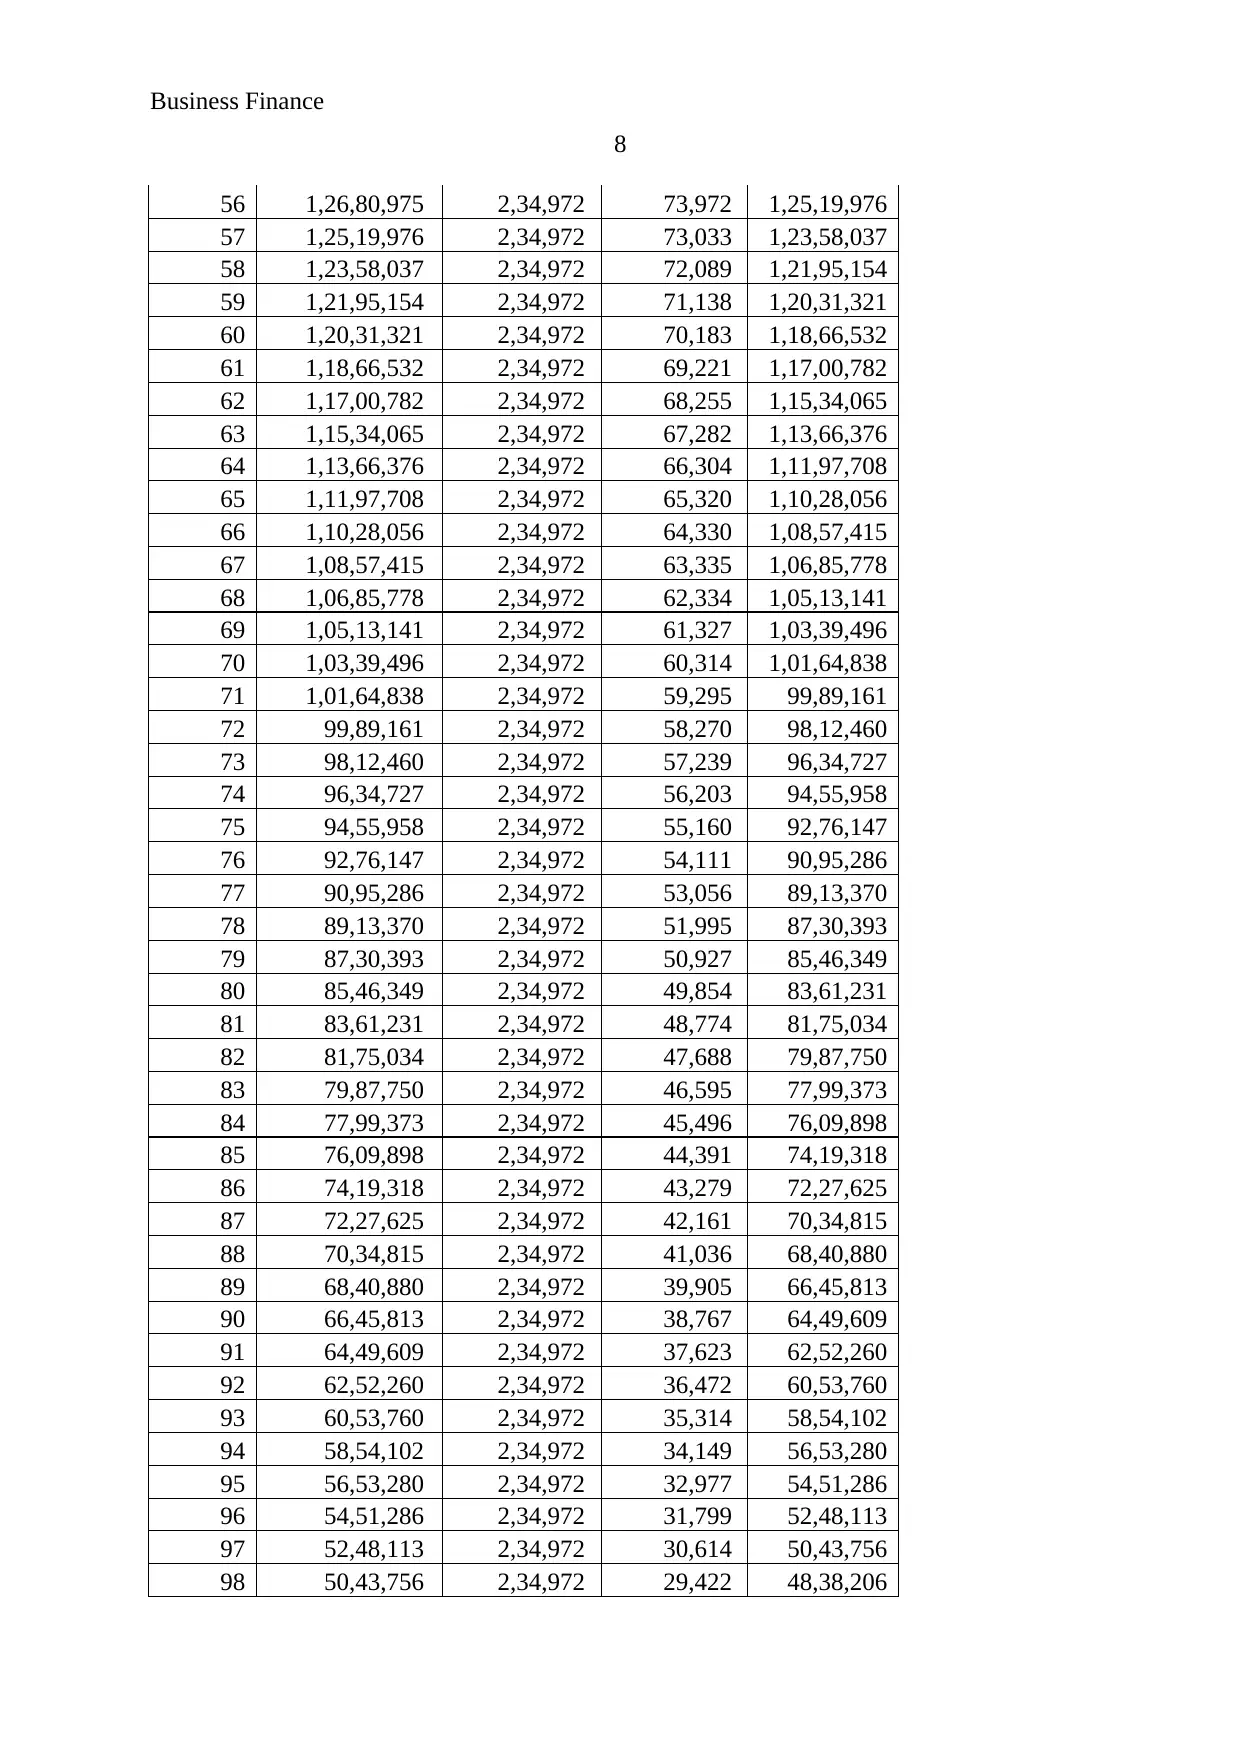
56 1,26,80,975 2,34,972 73,972 1,25,19,976
57 1,25,19,976 2,34,972 73,033 1,23,58,037
58 1,23,58,037 2,34,972 72,089 1,21,95,154
59 1,21,95,154 2,34,972 71,138 1,20,31,321
60 1,20,31,321 2,34,972 70,183 1,18,66,532
61 1,18,66,532 2,34,972 69,221 1,17,00,782
62 1,17,00,782 2,34,972 68,255 1,15,34,065
63 1,15,34,065 2,34,972 67,282 1,13,66,376
64 1,13,66,376 2,34,972 66,304 1,11,97,708
65 1,11,97,708 2,34,972 65,320 1,10,28,056
66 1,10,28,056 2,34,972 64,330 1,08,57,415
67 1,08,57,415 2,34,972 63,335 1,06,85,778
68 1,06,85,778 2,34,972 62,334 1,05,13,141
69 1,05,13,141 2,34,972 61,327 1,03,39,496
70 1,03,39,496 2,34,972 60,314 1,01,64,838
71 1,01,64,838 2,34,972 59,295 99,89,161
72 99,89,161 2,34,972 58,270 98,12,460
73 98,12,460 2,34,972 57,239 96,34,727
74 96,34,727 2,34,972 56,203 94,55,958
75 94,55,958 2,34,972 55,160 92,76,147
76 92,76,147 2,34,972 54,111 90,95,286
77 90,95,286 2,34,972 53,056 89,13,370
78 89,13,370 2,34,972 51,995 87,30,393
79 87,30,393 2,34,972 50,927 85,46,349
80 85,46,349 2,34,972 49,854 83,61,231
81 83,61,231 2,34,972 48,774 81,75,034
82 81,75,034 2,34,972 47,688 79,87,750
83 79,87,750 2,34,972 46,595 77,99,373
84 77,99,373 2,34,972 45,496 76,09,898
85 76,09,898 2,34,972 44,391 74,19,318
86 74,19,318 2,34,972 43,279 72,27,625
87 72,27,625 2,34,972 42,161 70,34,815
88 70,34,815 2,34,972 41,036 68,40,880
89 68,40,880 2,34,972 39,905 66,45,813
90 66,45,813 2,34,972 38,767 64,49,609
91 64,49,609 2,34,972 37,623 62,52,260
92 62,52,260 2,34,972 36,472 60,53,760
93 60,53,760 2,34,972 35,314 58,54,102
94 58,54,102 2,34,972 34,149 56,53,280
95 56,53,280 2,34,972 32,977 54,51,286
96 54,51,286 2,34,972 31,799 52,48,113
97 52,48,113 2,34,972 30,614 50,43,756
98 50,43,756 2,34,972 29,422 48,38,206
8
56 1,26,80,975 2,34,972 73,972 1,25,19,976
57 1,25,19,976 2,34,972 73,033 1,23,58,037
58 1,23,58,037 2,34,972 72,089 1,21,95,154
59 1,21,95,154 2,34,972 71,138 1,20,31,321
60 1,20,31,321 2,34,972 70,183 1,18,66,532
61 1,18,66,532 2,34,972 69,221 1,17,00,782
62 1,17,00,782 2,34,972 68,255 1,15,34,065
63 1,15,34,065 2,34,972 67,282 1,13,66,376
64 1,13,66,376 2,34,972 66,304 1,11,97,708
65 1,11,97,708 2,34,972 65,320 1,10,28,056
66 1,10,28,056 2,34,972 64,330 1,08,57,415
67 1,08,57,415 2,34,972 63,335 1,06,85,778
68 1,06,85,778 2,34,972 62,334 1,05,13,141
69 1,05,13,141 2,34,972 61,327 1,03,39,496
70 1,03,39,496 2,34,972 60,314 1,01,64,838
71 1,01,64,838 2,34,972 59,295 99,89,161
72 99,89,161 2,34,972 58,270 98,12,460
73 98,12,460 2,34,972 57,239 96,34,727
74 96,34,727 2,34,972 56,203 94,55,958
75 94,55,958 2,34,972 55,160 92,76,147
76 92,76,147 2,34,972 54,111 90,95,286
77 90,95,286 2,34,972 53,056 89,13,370
78 89,13,370 2,34,972 51,995 87,30,393
79 87,30,393 2,34,972 50,927 85,46,349
80 85,46,349 2,34,972 49,854 83,61,231
81 83,61,231 2,34,972 48,774 81,75,034
82 81,75,034 2,34,972 47,688 79,87,750
83 79,87,750 2,34,972 46,595 77,99,373
84 77,99,373 2,34,972 45,496 76,09,898
85 76,09,898 2,34,972 44,391 74,19,318
86 74,19,318 2,34,972 43,279 72,27,625
87 72,27,625 2,34,972 42,161 70,34,815
88 70,34,815 2,34,972 41,036 68,40,880
89 68,40,880 2,34,972 39,905 66,45,813
90 66,45,813 2,34,972 38,767 64,49,609
91 64,49,609 2,34,972 37,623 62,52,260
92 62,52,260 2,34,972 36,472 60,53,760
93 60,53,760 2,34,972 35,314 58,54,102
94 58,54,102 2,34,972 34,149 56,53,280
95 56,53,280 2,34,972 32,977 54,51,286
96 54,51,286 2,34,972 31,799 52,48,113
97 52,48,113 2,34,972 30,614 50,43,756
98 50,43,756 2,34,972 29,422 48,38,206
Business Finance
9
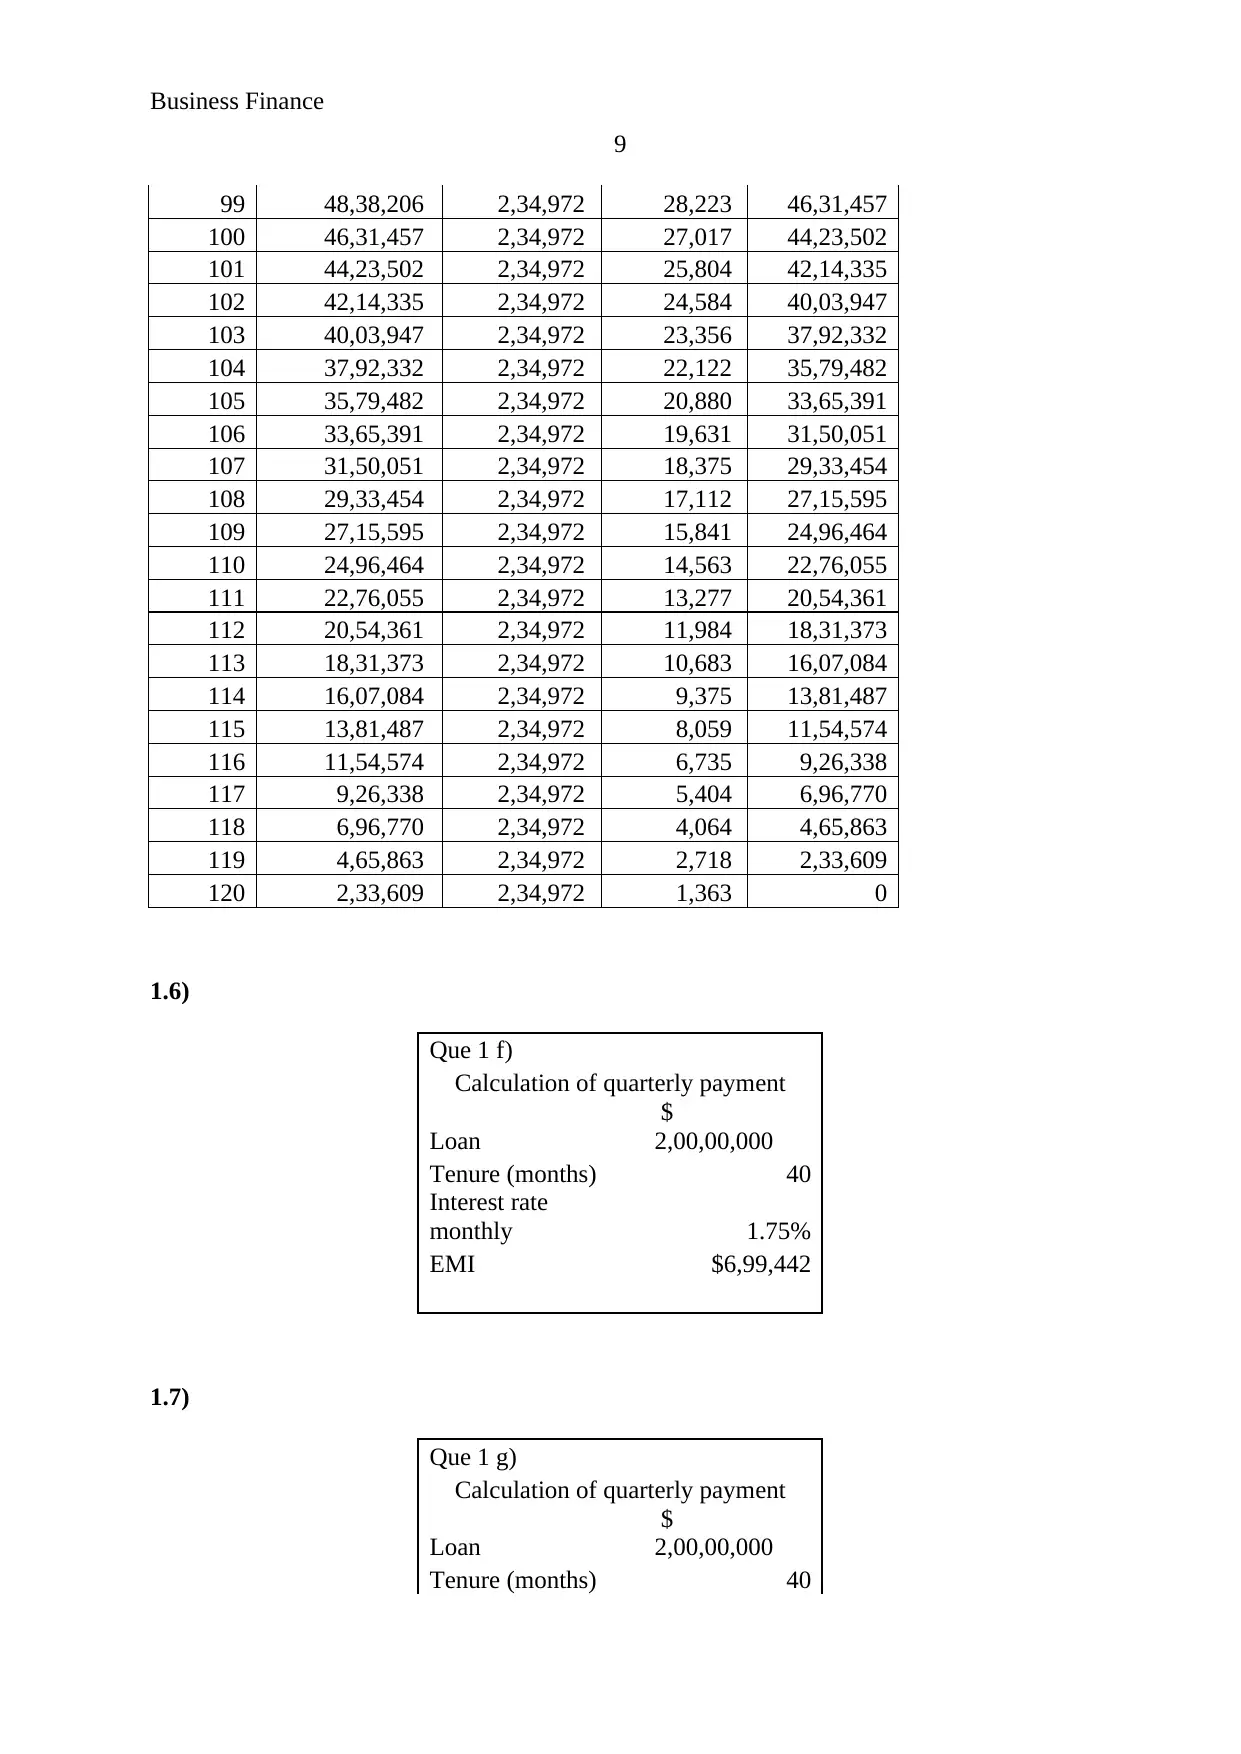
99 48,38,206 2,34,972 28,223 46,31,457
100 46,31,457 2,34,972 27,017 44,23,502
101 44,23,502 2,34,972 25,804 42,14,335
102 42,14,335 2,34,972 24,584 40,03,947
103 40,03,947 2,34,972 23,356 37,92,332
104 37,92,332 2,34,972 22,122 35,79,482
105 35,79,482 2,34,972 20,880 33,65,391
106 33,65,391 2,34,972 19,631 31,50,051
107 31,50,051 2,34,972 18,375 29,33,454
108 29,33,454 2,34,972 17,112 27,15,595
109 27,15,595 2,34,972 15,841 24,96,464
110 24,96,464 2,34,972 14,563 22,76,055
111 22,76,055 2,34,972 13,277 20,54,361
112 20,54,361 2,34,972 11,984 18,31,373
113 18,31,373 2,34,972 10,683 16,07,084
114 16,07,084 2,34,972 9,375 13,81,487
115 13,81,487 2,34,972 8,059 11,54,574
116 11,54,574 2,34,972 6,735 9,26,338
117 9,26,338 2,34,972 5,404 6,96,770
118 6,96,770 2,34,972 4,064 4,65,863
119 4,65,863 2,34,972 2,718 2,33,609
120 2,33,609 2,34,972 1,363 0
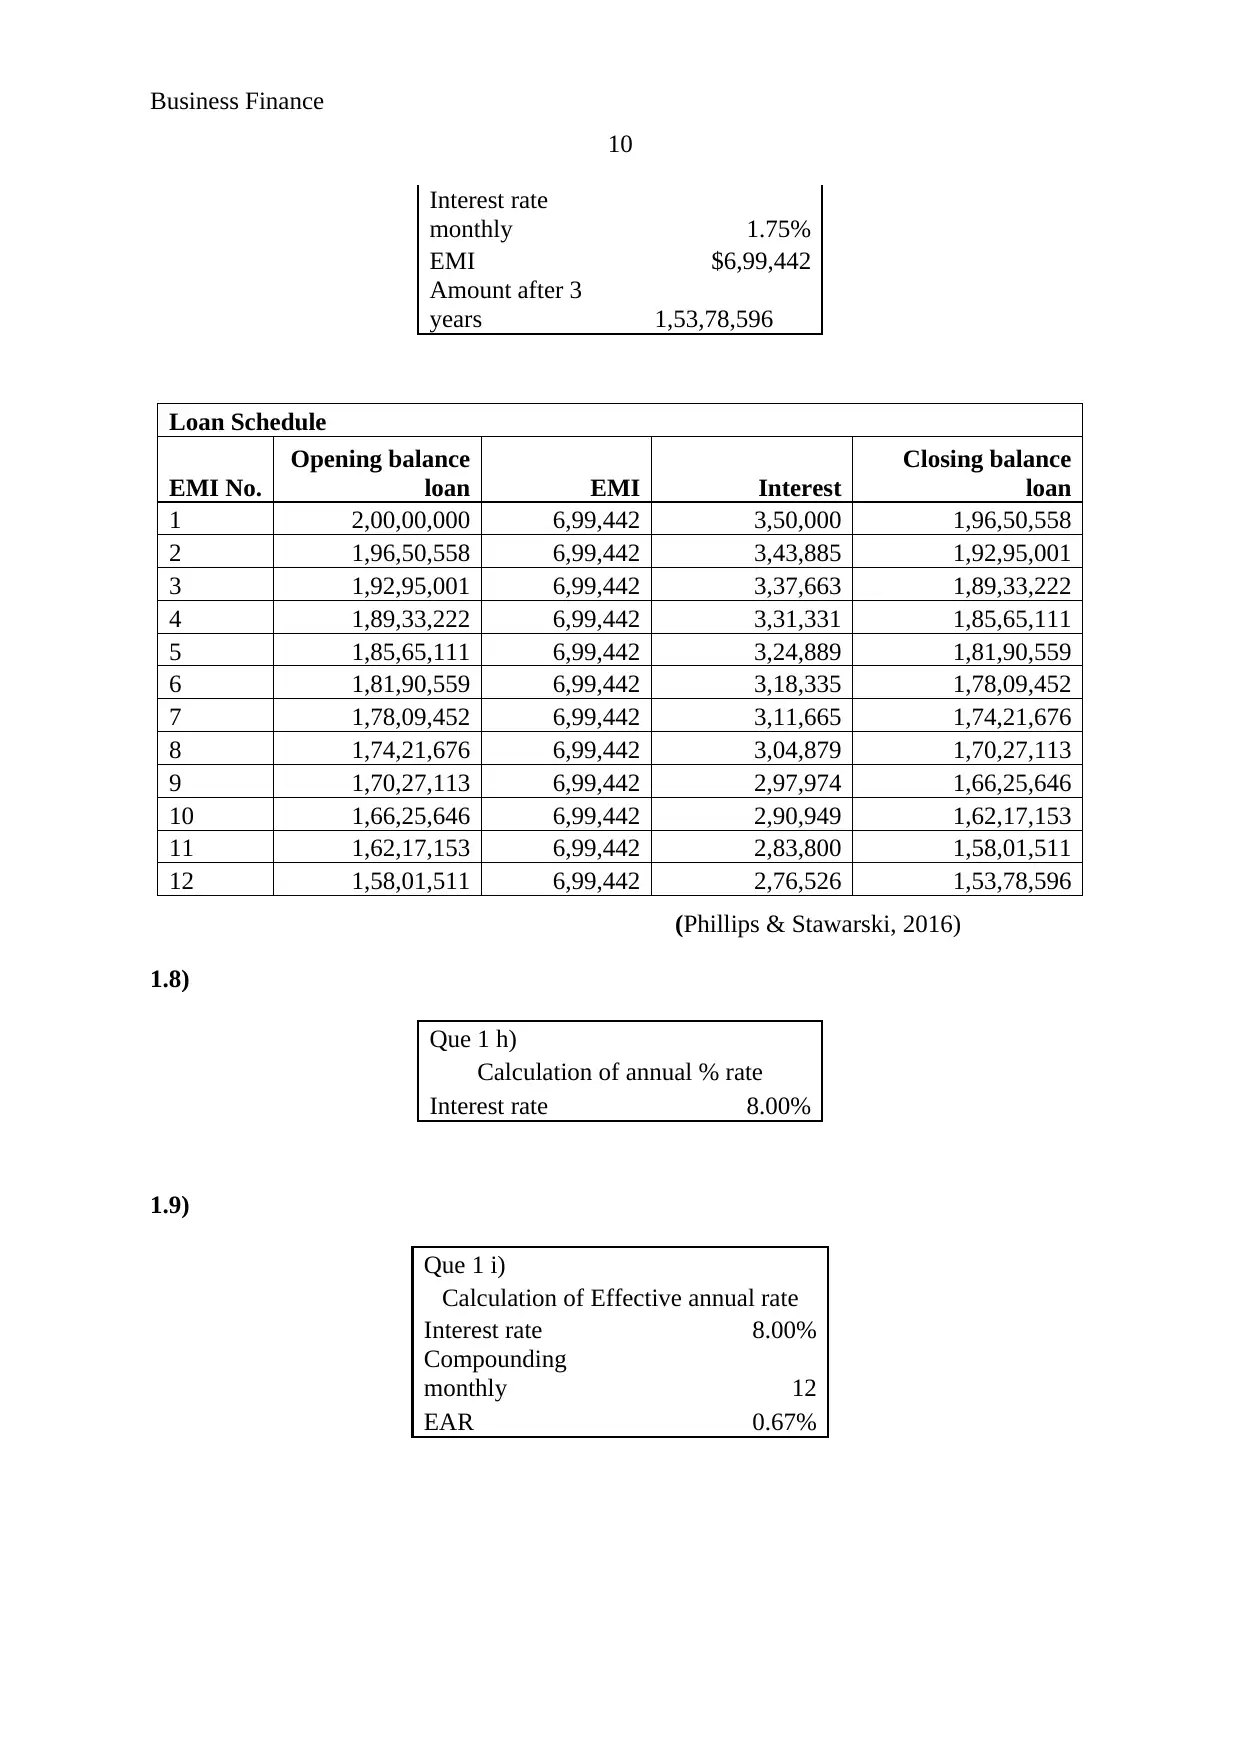
1.6)
Que 1 f)
Calculation of quarterly payment
Loan
$
2,00,00,000
Tenure (months) 40
Interest rate
monthly 1.75%
EMI $6,99,442
1.7)
Que 1 g)
Calculation of quarterly payment
Loan
$
2,00,00,000
Tenure (months) 40
9
99 48,38,206 2,34,972 28,223 46,31,457
100 46,31,457 2,34,972 27,017 44,23,502
101 44,23,502 2,34,972 25,804 42,14,335
102 42,14,335 2,34,972 24,584 40,03,947
103 40,03,947 2,34,972 23,356 37,92,332
104 37,92,332 2,34,972 22,122 35,79,482
105 35,79,482 2,34,972 20,880 33,65,391
106 33,65,391 2,34,972 19,631 31,50,051
107 31,50,051 2,34,972 18,375 29,33,454
108 29,33,454 2,34,972 17,112 27,15,595
109 27,15,595 2,34,972 15,841 24,96,464
110 24,96,464 2,34,972 14,563 22,76,055
111 22,76,055 2,34,972 13,277 20,54,361
112 20,54,361 2,34,972 11,984 18,31,373
113 18,31,373 2,34,972 10,683 16,07,084
114 16,07,084 2,34,972 9,375 13,81,487
115 13,81,487 2,34,972 8,059 11,54,574
116 11,54,574 2,34,972 6,735 9,26,338
117 9,26,338 2,34,972 5,404 6,96,770
118 6,96,770 2,34,972 4,064 4,65,863
119 4,65,863 2,34,972 2,718 2,33,609
120 2,33,609 2,34,972 1,363 0
1.6)
Que 1 f)
Calculation of quarterly payment
Loan
$
2,00,00,000
Tenure (months) 40
Interest rate
monthly 1.75%
EMI $6,99,442
1.7)
Que 1 g)
Calculation of quarterly payment
Loan
$
2,00,00,000
Tenure (months) 40
⊘ This is a preview!⊘
Do you want full access?
Subscribe today to unlock all pages.
Trusted by 1+ million students worldwide
Business Finance
10
Interest rate
monthly 1.75%
EMI $6,99,442
Amount after 3
years 1,53,78,596
Loan Schedule
EMI No.
Opening balance
loan EMI Interest
Closing balance
loan
1 2,00,00,000 6,99,442 3,50,000 1,96,50,558
2 1,96,50,558 6,99,442 3,43,885 1,92,95,001
3 1,92,95,001 6,99,442 3,37,663 1,89,33,222
4 1,89,33,222 6,99,442 3,31,331 1,85,65,111
5 1,85,65,111 6,99,442 3,24,889 1,81,90,559
6 1,81,90,559 6,99,442 3,18,335 1,78,09,452
7 1,78,09,452 6,99,442 3,11,665 1,74,21,676
8 1,74,21,676 6,99,442 3,04,879 1,70,27,113
9 1,70,27,113 6,99,442 2,97,974 1,66,25,646
10 1,66,25,646 6,99,442 2,90,949 1,62,17,153
11 1,62,17,153 6,99,442 2,83,800 1,58,01,511
12 1,58,01,511 6,99,442 2,76,526 1,53,78,596
(Phillips & Stawarski, 2016)
1.8)
Que 1 h)
Calculation of annual % rate
Interest rate 8.00%
1.9)
Que 1 i)
Calculation of Effective annual rate
Interest rate 8.00%
Compounding
monthly 12
EAR 0.67%
Paraphrase This Document
Need a fresh take? Get an instant paraphrase of this document with our AI Paraphraser
Business Finance
11
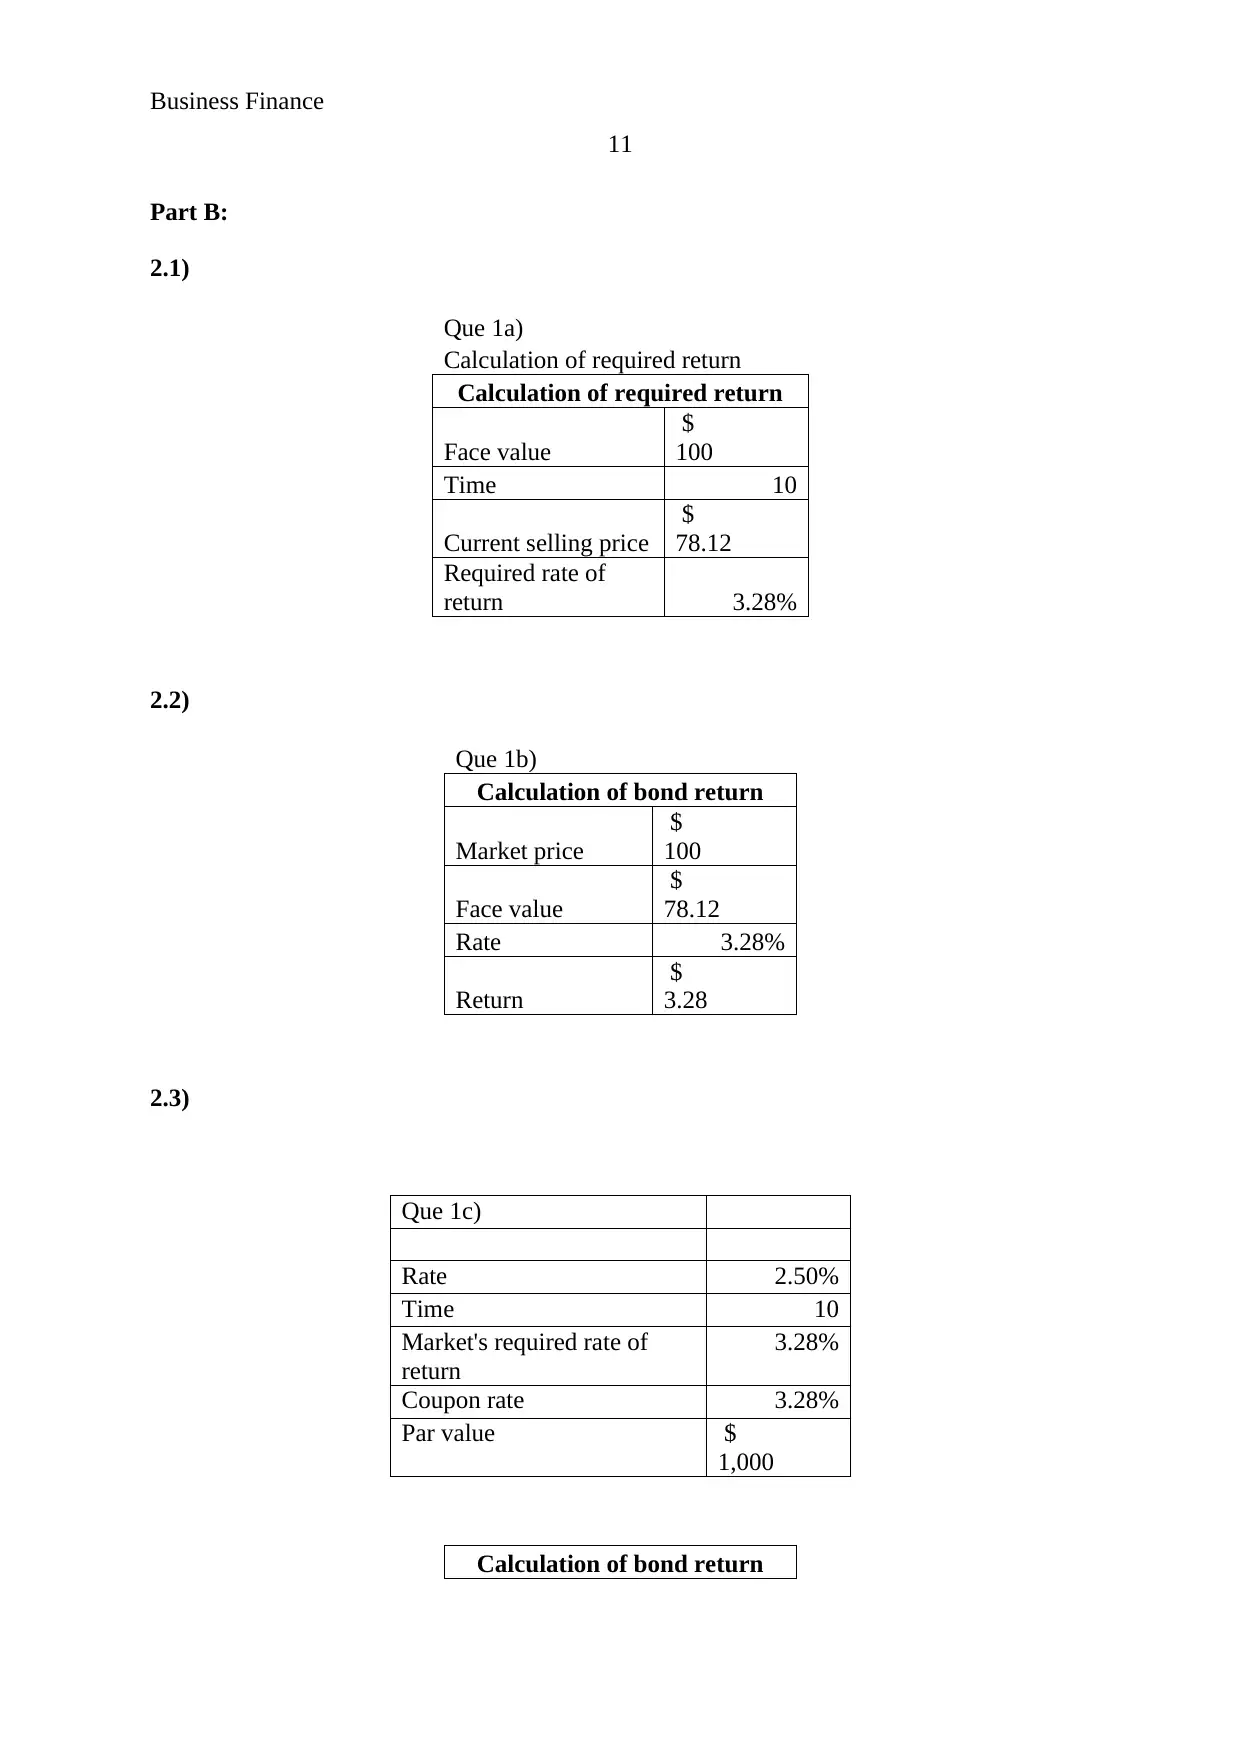
Part B:
2.1)
Que 1a)
Calculation of required return
Calculation of required return
Face value
$
100
Time 10
Current selling price
$
78.12
Required rate of
return 3.28%
2.2)
Que 1b)
Calculation of bond return
Market price
$
100
Face value
$
78.12
Rate 3.28%
Return
$
3.28
2.3)
Que 1c)
Rate 2.50%
Time 10
Market's required rate of
return
3.28%
Coupon rate 3.28%
Par value $
1,000
Calculation of bond return
11
Part B:
2.1)
Que 1a)
Calculation of required return
Calculation of required return
Face value
$
100
Time 10
Current selling price
$
78.12
Required rate of
return 3.28%
2.2)
Que 1b)
Calculation of bond return
Market price
$
100
Face value
$
78.12
Rate 3.28%
Return
$
3.28
2.3)
Que 1c)
Rate 2.50%
Time 10
Market's required rate of
return
3.28%
Coupon rate 3.28%
Par value $
1,000
Calculation of bond return
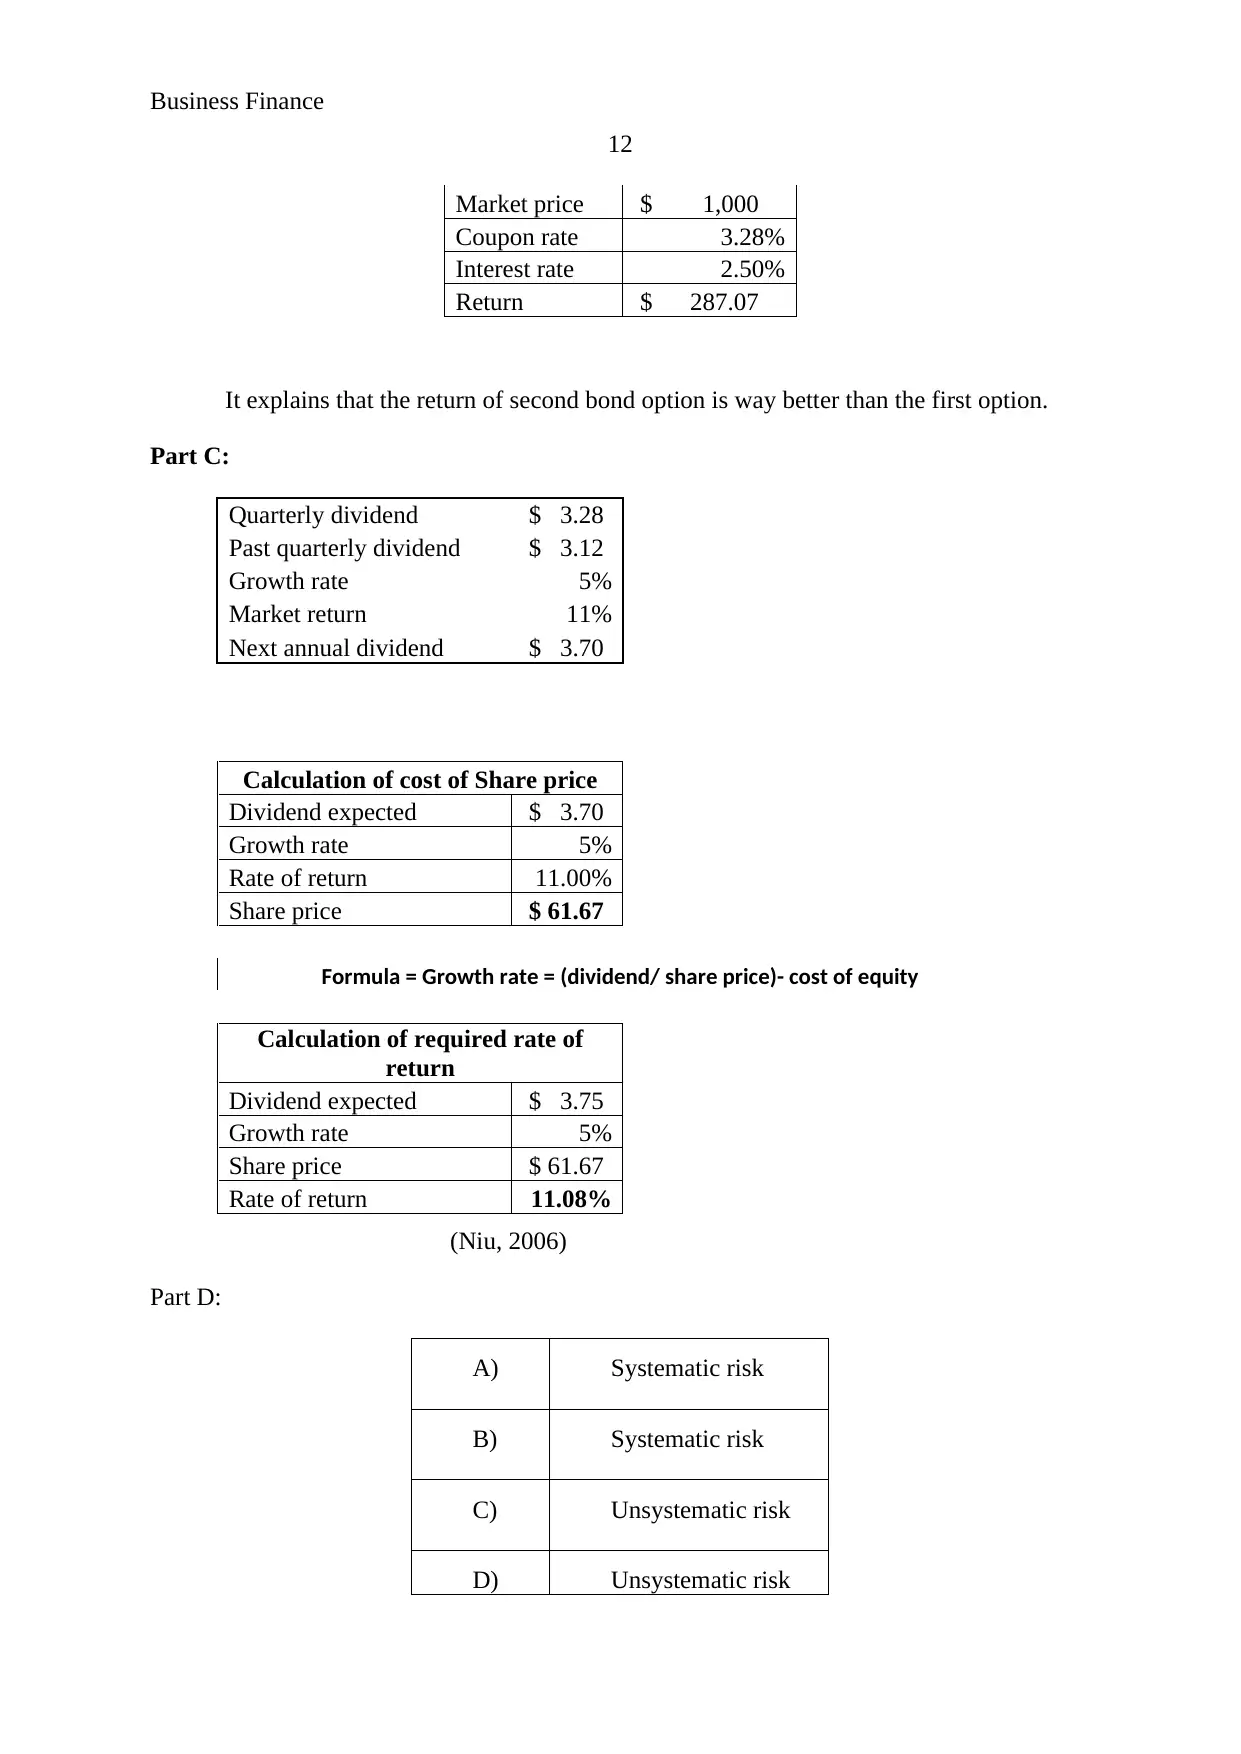
Business Finance
12
Market price $ 1,000
Coupon rate 3.28%
Interest rate 2.50%
Return $ 287.07
It explains that the return of second bond option is way better than the first option.
Part C:
Quarterly dividend $ 3.28
Past quarterly dividend $ 3.12
Growth rate 5%
Market return 11%
Next annual dividend $ 3.70
Calculation of cost of Share price
Dividend expected $ 3.70
Growth rate 5%
Rate of return 11.00%
Share price $ 61.67
Formula = Growth rate = (dividend/ share price)- cost of equity
Calculation of required rate of
return
Dividend expected $ 3.75
Growth rate 5%
Share price $ 61.67
Rate of return 11.08%
(Niu, 2006)
Part D:
A) Systematic risk
B) Systematic risk
C) Unsystematic risk
D) Unsystematic risk
⊘ This is a preview!⊘
Do you want full access?
Subscribe today to unlock all pages.
Trusted by 1+ million students worldwide
1 out of 27
Related Documents


Your All-in-One AI-Powered Toolkit for Academic Success.
+13062052269
info@desklib.com
Available 24*7 on WhatsApp / Email
![[object Object]](/_next/static/media/star-bottom.7253800d.svg)
Unlock your academic potential
Copyright © 2020–2026 A2Z Services. All Rights Reserved. Developed and managed by ZUCOL.