Business Finance Report: Macquarie Group Financial Analysis and Ratios
VerifiedAdded on 2020/10/23
|11
|2960
|64
Report
AI Summary
This report provides a comprehensive analysis of business finance, specifically focusing on Macquarie Group Ltd, an Australian multinational investment bank and financial services provider. The report delves into the company's financial performance, including an overview of its operations, products, and key regulators. It presents a detailed financial analysis, examining profitability ratios such as Return on Equity, Gross Profit Ratio, and Net Profit Ratio, along with operating efficiency ratios like Accounts Receivable Turnover and Accounts Payable Turnover. Furthermore, the report includes a comparison of Macquarie Group's share price movements, highlighting trends and factors influencing its fluctuations. The cost of equity is calculated, and the company's capital structure is identified. The report concludes with a summary of the key findings and analysis, providing a valuable resource for understanding business finance concepts and the financial health of Macquarie Group. This report is available on Desklib, a platform offering AI-based study tools for students.

BUSINESS
FINANCE
FINANCE
Paraphrase This Document
Need a fresh take? Get an instant paraphrase of this document with our AI Paraphraser
ABSTRACT
This report contains the detailed information about the business finance and how
companies can raise its funds from various other sources. It also gives the detailed information
about the Macquarie groups Ltd and the cost of capital and it capital structure. It also contains
the ratio analysis and its analysis of share price of previous two years.
Table of Contents
ABSTRACT.....................................................................................................................................2
INTRODUCTION...........................................................................................................................1
FINANCIAL ANALYSIS...............................................................................................................1
Overview of the company............................................................................................................1
Analysis of Financial Ratio..........................................................................................................2
Comparison of share price movements........................................................................................4
Cost of Equity..............................................................................................................................6
Capital Structure..........................................................................................................................6
CONCLUSION................................................................................................................................7
REFERENCES................................................................................................................................8
⊘ This is a preview!⊘
Do you want full access?
Subscribe today to unlock all pages.
Trusted by 1+ million students worldwide
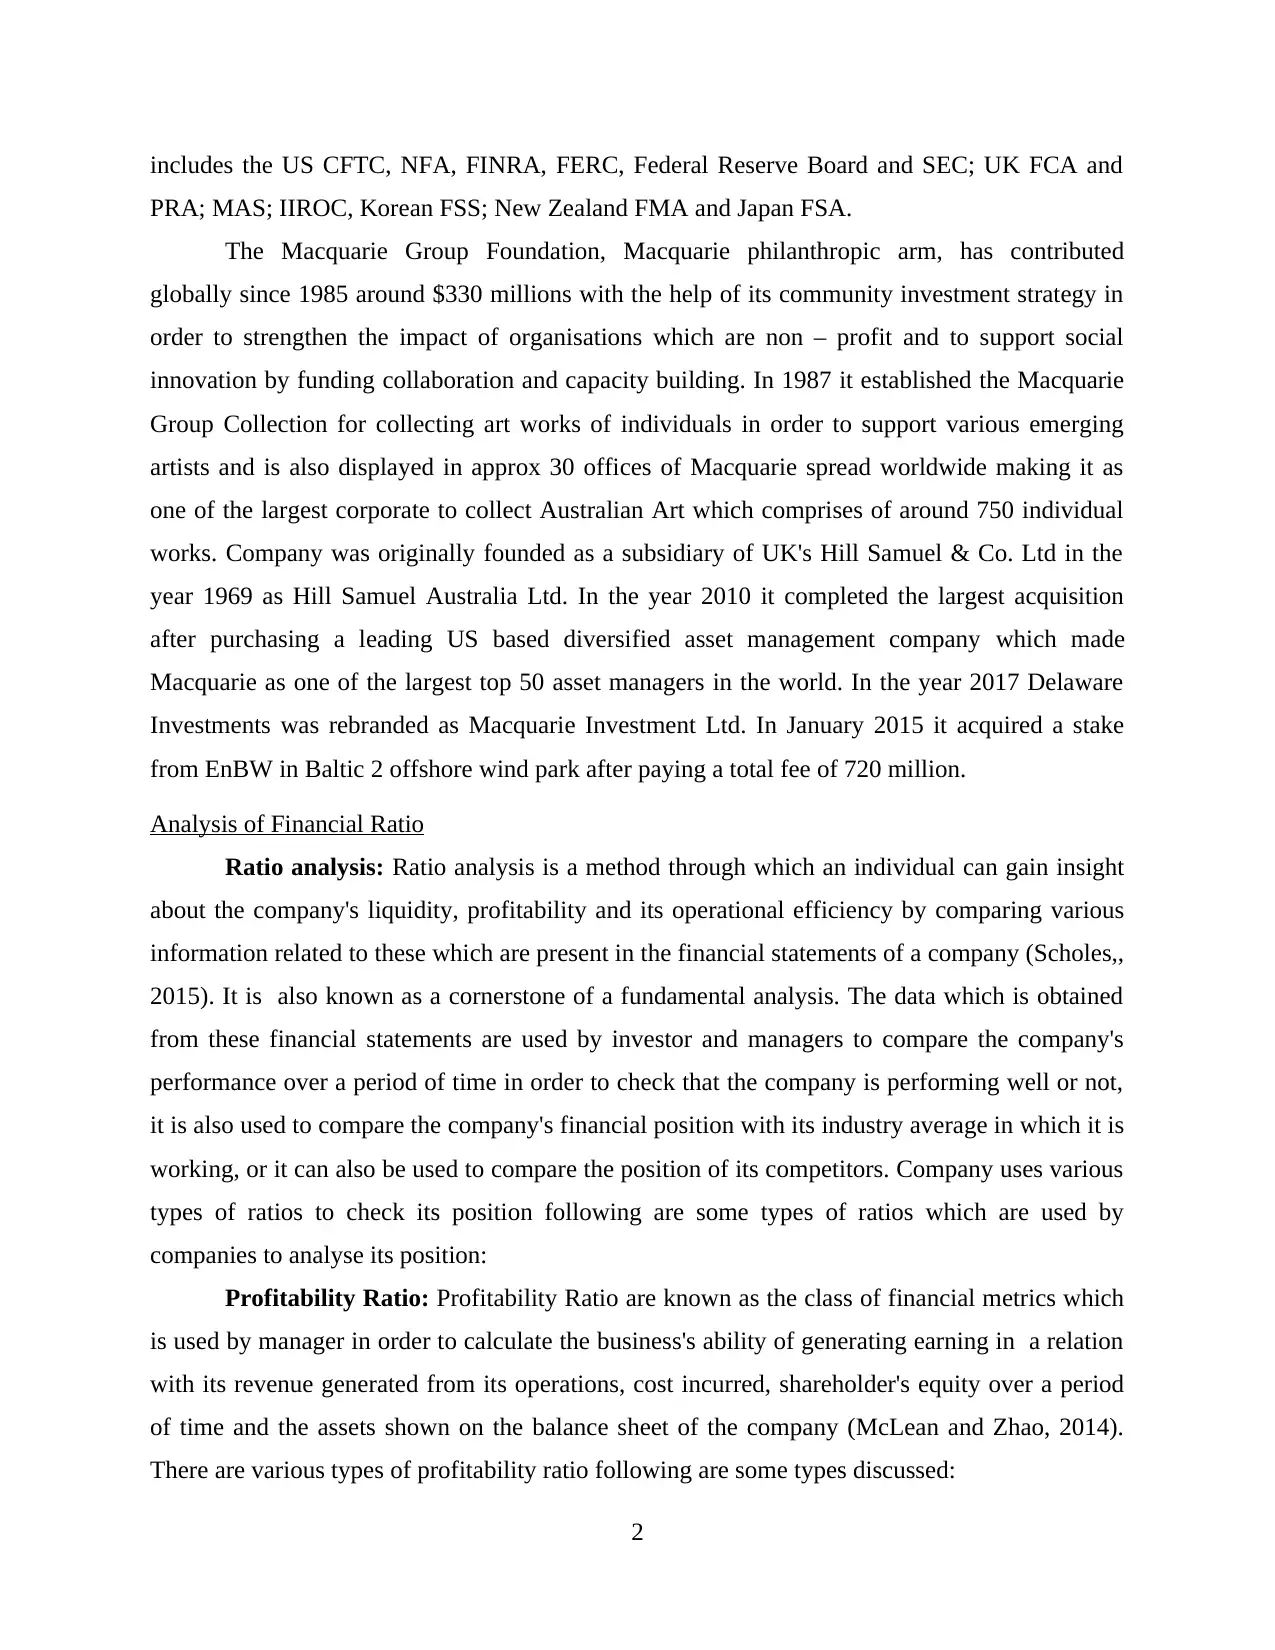
INTRODUCTION
Business finance is the credit or money which is employed in a business. Finance is one
of the basic need for any business as it requires to purchase it assets in order to starts its business
operations, raw material, good and other things (Burnsand Dewhurst, 2016). The following
report contains the detailed information about the analysis of Macquarie Group, which is an
Australian multinational investment bank and also provide financial services. This report also
focuses on the financial analysis of the company which include the analysis of various ratios
such as profitability ratio and operating efficiency ratios it also states the comparison of share
price movements of the company and it also establish the trend analysis that in which trend share
price of the company are moving. This report also contains the calculation of cost of equity and
identifies the capital structure of the company.
FINANCIAL ANALYSIS
Overview of the company
Macquarie Group Ltd is an Australian based multinational independent investment bank
and financial services provider company. Headquarter is located in located in Australia and is
listed in Australian Stock Exchange and it employs around 14000 staff in 25 countries, is one of
the world's largest infrastructure assets management company and also the top ranked acquisition
and mergers in Australia which hold approx $495 billion invested in assets. Total operating
income for the year 2018 recorded by the company was stated at $10.9 billion and the net income
recorded was stated at $2.6 billion. The products which are offered by the company are
investment banking, Asset management, private equity, corporate banking, commodity trading,
equities trading, foreign exchange trading, future and option trading, consumer banking, money
market trading, wealth management, leasing and investment management. Its operating group
includes Macquarie Asset management and Macquarie Capital. It also holds numbers of licence
which enables it to conduct its activities in different jurisdiction in which it regulates and is
operated by global regulators. Macquarie Bank Ltd has a banking licence in Australia and is also
works as an Authorised Deposit taking Institution which is supervised by Australian Prudential
Regulation Authority. There are various other key regulators of Australia includes AUSTRAC
and Australian Securities & Investment Commission (ASIC). Other Global key regulators
1
Paraphrase This Document
Need a fresh take? Get an instant paraphrase of this document with our AI Paraphraser
includes the US CFTC, NFA, FINRA, FERC, Federal Reserve Board and SEC; UK FCA and
PRA; MAS; IIROC, Korean FSS; New Zealand FMA and Japan FSA.
The Macquarie Group Foundation, Macquarie philanthropic arm, has contributed
globally since 1985 around $330 millions with the help of its community investment strategy in
order to strengthen the impact of organisations which are non – profit and to support social
innovation by funding collaboration and capacity building. In 1987 it established the Macquarie
Group Collection for collecting art works of individuals in order to support various emerging
artists and is also displayed in approx 30 offices of Macquarie spread worldwide making it as
one of the largest corporate to collect Australian Art which comprises of around 750 individual
works. Company was originally founded as a subsidiary of UK's Hill Samuel & Co. Ltd in the
year 1969 as Hill Samuel Australia Ltd. In the year 2010 it completed the largest acquisition
after purchasing a leading US based diversified asset management company which made
Macquarie as one of the largest top 50 asset managers in the world. In the year 2017 Delaware
Investments was rebranded as Macquarie Investment Ltd. In January 2015 it acquired a stake
from EnBW in Baltic 2 offshore wind park after paying a total fee of 720 million.
Analysis of Financial Ratio
Ratio analysis: Ratio analysis is a method through which an individual can gain insight
about the company's liquidity, profitability and its operational efficiency by comparing various
information related to these which are present in the financial statements of a company (Scholes,,
2015). It is also known as a cornerstone of a fundamental analysis. The data which is obtained
from these financial statements are used by investor and managers to compare the company's
performance over a period of time in order to check that the company is performing well or not,
it is also used to compare the company's financial position with its industry average in which it is
working, or it can also be used to compare the position of its competitors. Company uses various
types of ratios to check its position following are some types of ratios which are used by
companies to analyse its position:
Profitability Ratio: Profitability Ratio are known as the class of financial metrics which
is used by manager in order to calculate the business's ability of generating earning in a relation
with its revenue generated from its operations, cost incurred, shareholder's equity over a period
of time and the assets shown on the balance sheet of the company (McLean and Zhao, 2014).
There are various types of profitability ratio following are some types discussed:
2
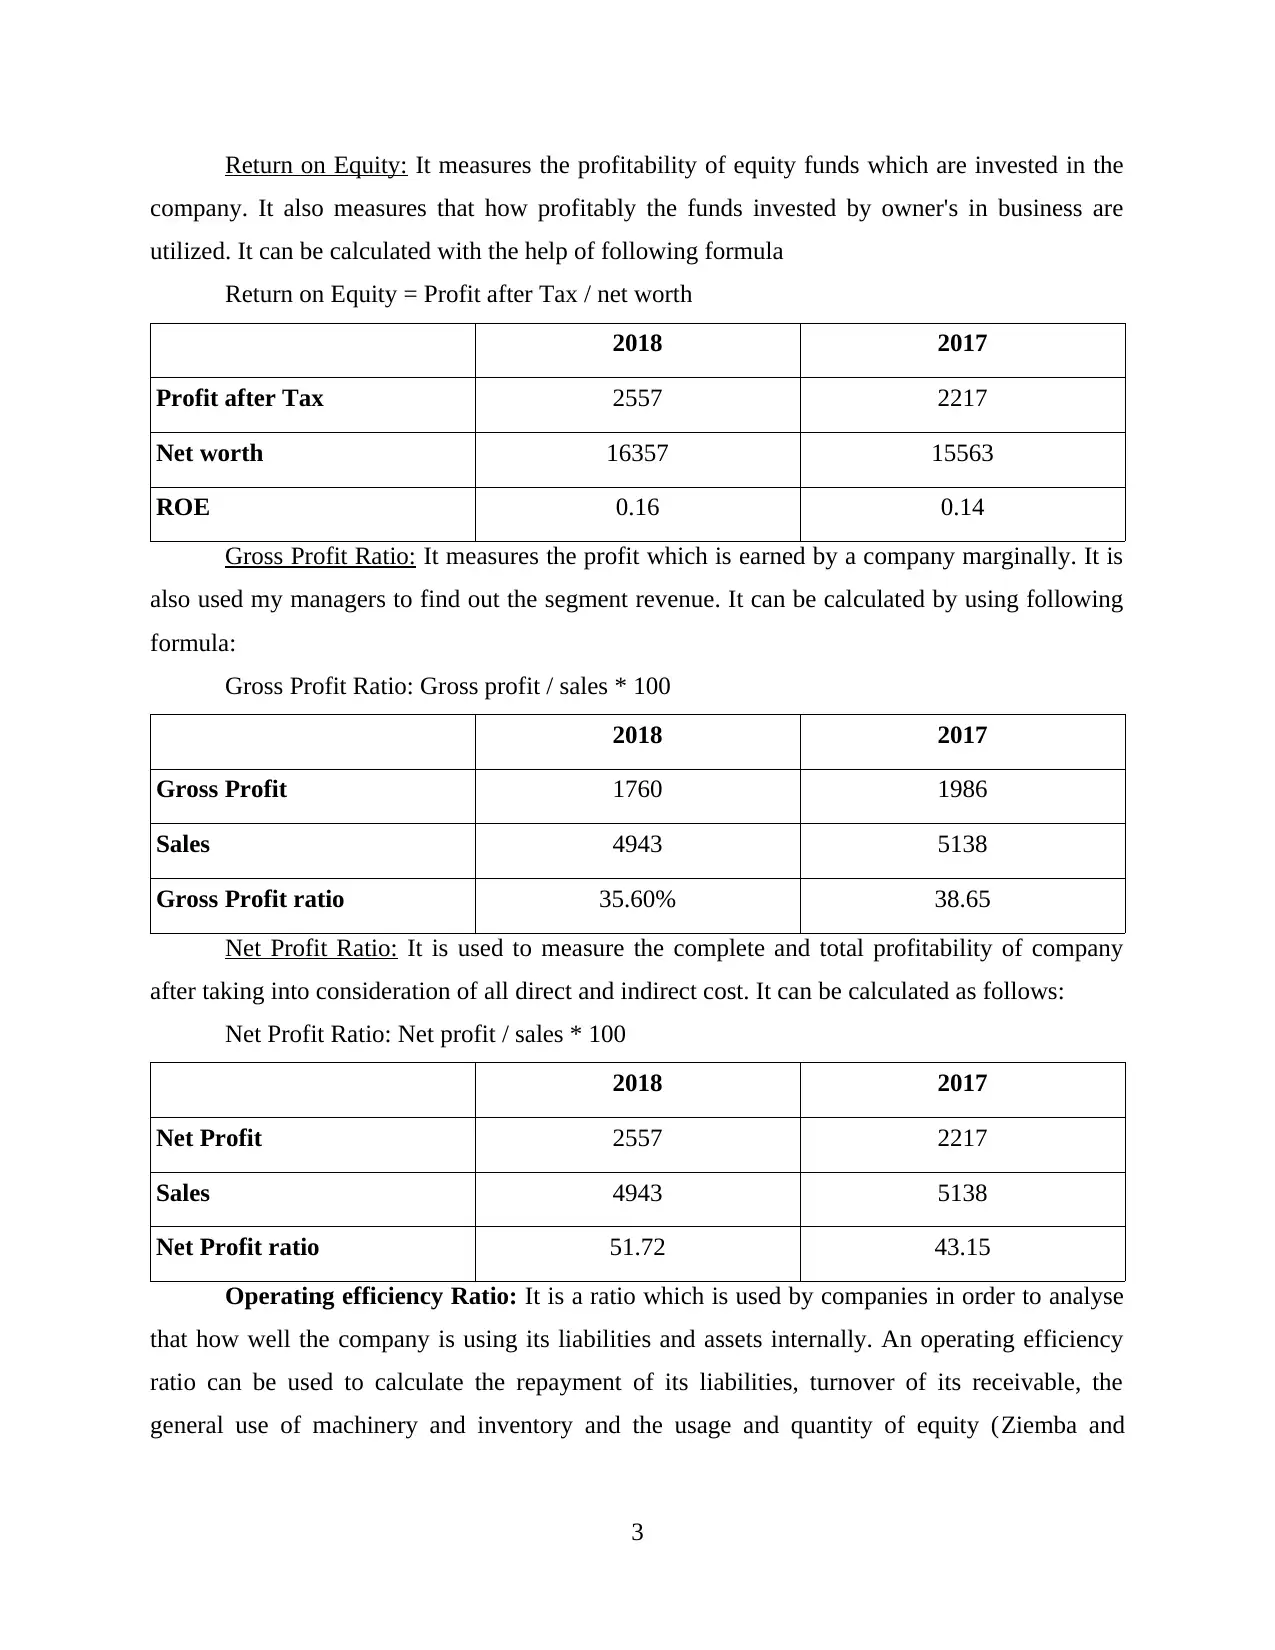
Return on Equity: It measures the profitability of equity funds which are invested in the
company. It also measures that how profitably the funds invested by owner's in business are
utilized. It can be calculated with the help of following formula
Return on Equity = Profit after Tax / net worth
2018 2017
Profit after Tax 2557 2217
Net worth 16357 15563
ROE 0.16 0.14
Gross Profit Ratio: It measures the profit which is earned by a company marginally. It is
also used my managers to find out the segment revenue. It can be calculated by using following
formula:
Gross Profit Ratio: Gross profit / sales * 100
2018 2017
Gross Profit 1760 1986
Sales 4943 5138
Gross Profit ratio 35.60% 38.65
Net Profit Ratio: It is used to measure the complete and total profitability of company
after taking into consideration of all direct and indirect cost. It can be calculated as follows:
Net Profit Ratio: Net profit / sales * 100
2018 2017
Net Profit 2557 2217
Sales 4943 5138
Net Profit ratio 51.72 43.15
Operating efficiency Ratio: It is a ratio which is used by companies in order to analyse
that how well the company is using its liabilities and assets internally. An operating efficiency
ratio can be used to calculate the repayment of its liabilities, turnover of its receivable, the
general use of machinery and inventory and the usage and quantity of equity (Ziemba and
3
⊘ This is a preview!⊘
Do you want full access?
Subscribe today to unlock all pages.
Trusted by 1+ million students worldwide
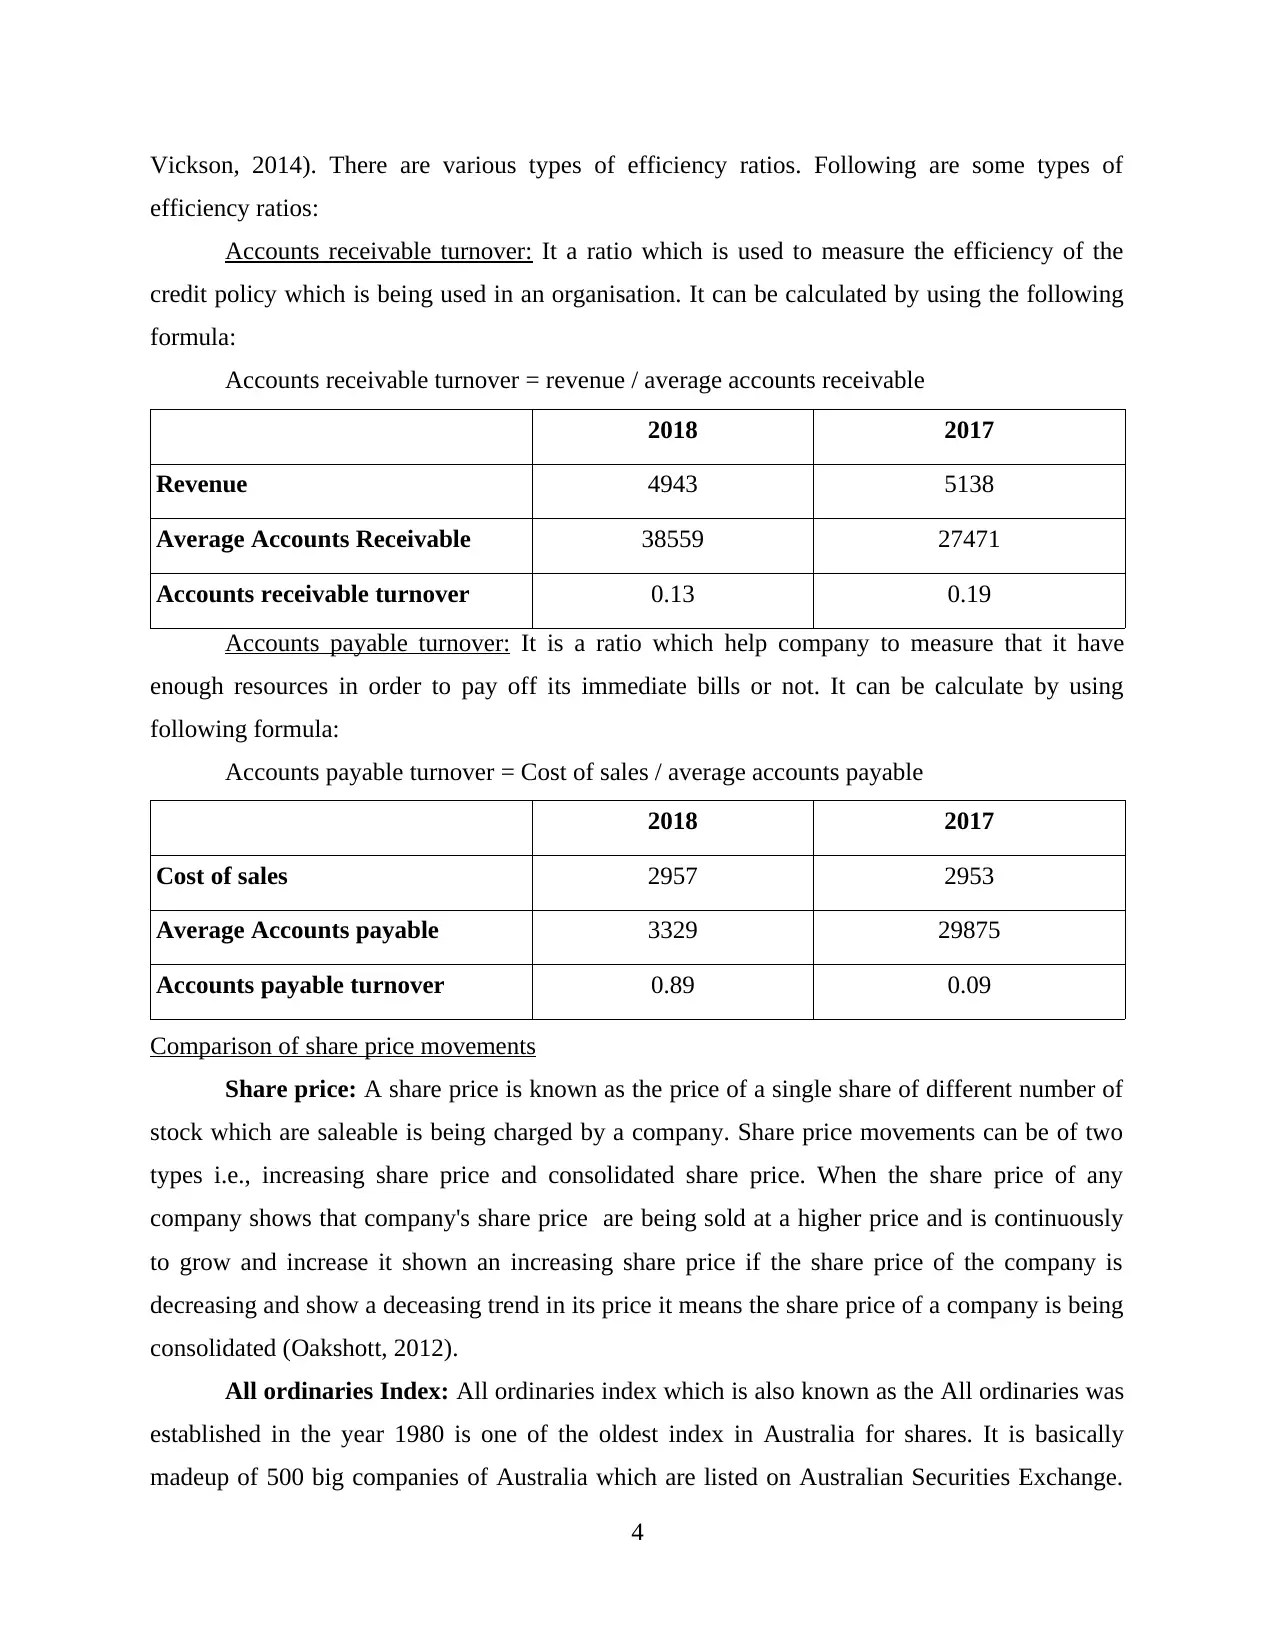
Vickson, 2014). There are various types of efficiency ratios. Following are some types of
efficiency ratios:
Accounts receivable turnover: It a ratio which is used to measure the efficiency of the
credit policy which is being used in an organisation. It can be calculated by using the following
formula:
Accounts receivable turnover = revenue / average accounts receivable
2018 2017
Revenue 4943 5138
Average Accounts Receivable 38559 27471
Accounts receivable turnover 0.13 0.19
Accounts payable turnover: It is a ratio which help company to measure that it have
enough resources in order to pay off its immediate bills or not. It can be calculate by using
following formula:
Accounts payable turnover = Cost of sales / average accounts payable
2018 2017
Cost of sales 2957 2953
Average Accounts payable 3329 29875
Accounts payable turnover 0.89 0.09
Comparison of share price movements
Share price: A share price is known as the price of a single share of different number of
stock which are saleable is being charged by a company. Share price movements can be of two
types i.e., increasing share price and consolidated share price. When the share price of any
company shows that company's share price are being sold at a higher price and is continuously
to grow and increase it shown an increasing share price if the share price of the company is
decreasing and show a deceasing trend in its price it means the share price of a company is being
consolidated (Oakshott, 2012).
All ordinaries Index: All ordinaries index which is also known as the All ordinaries was
established in the year 1980 is one of the oldest index in Australia for shares. It is basically
madeup of 500 big companies of Australia which are listed on Australian Securities Exchange.
4
Paraphrase This Document
Need a fresh take? Get an instant paraphrase of this document with our AI Paraphraser
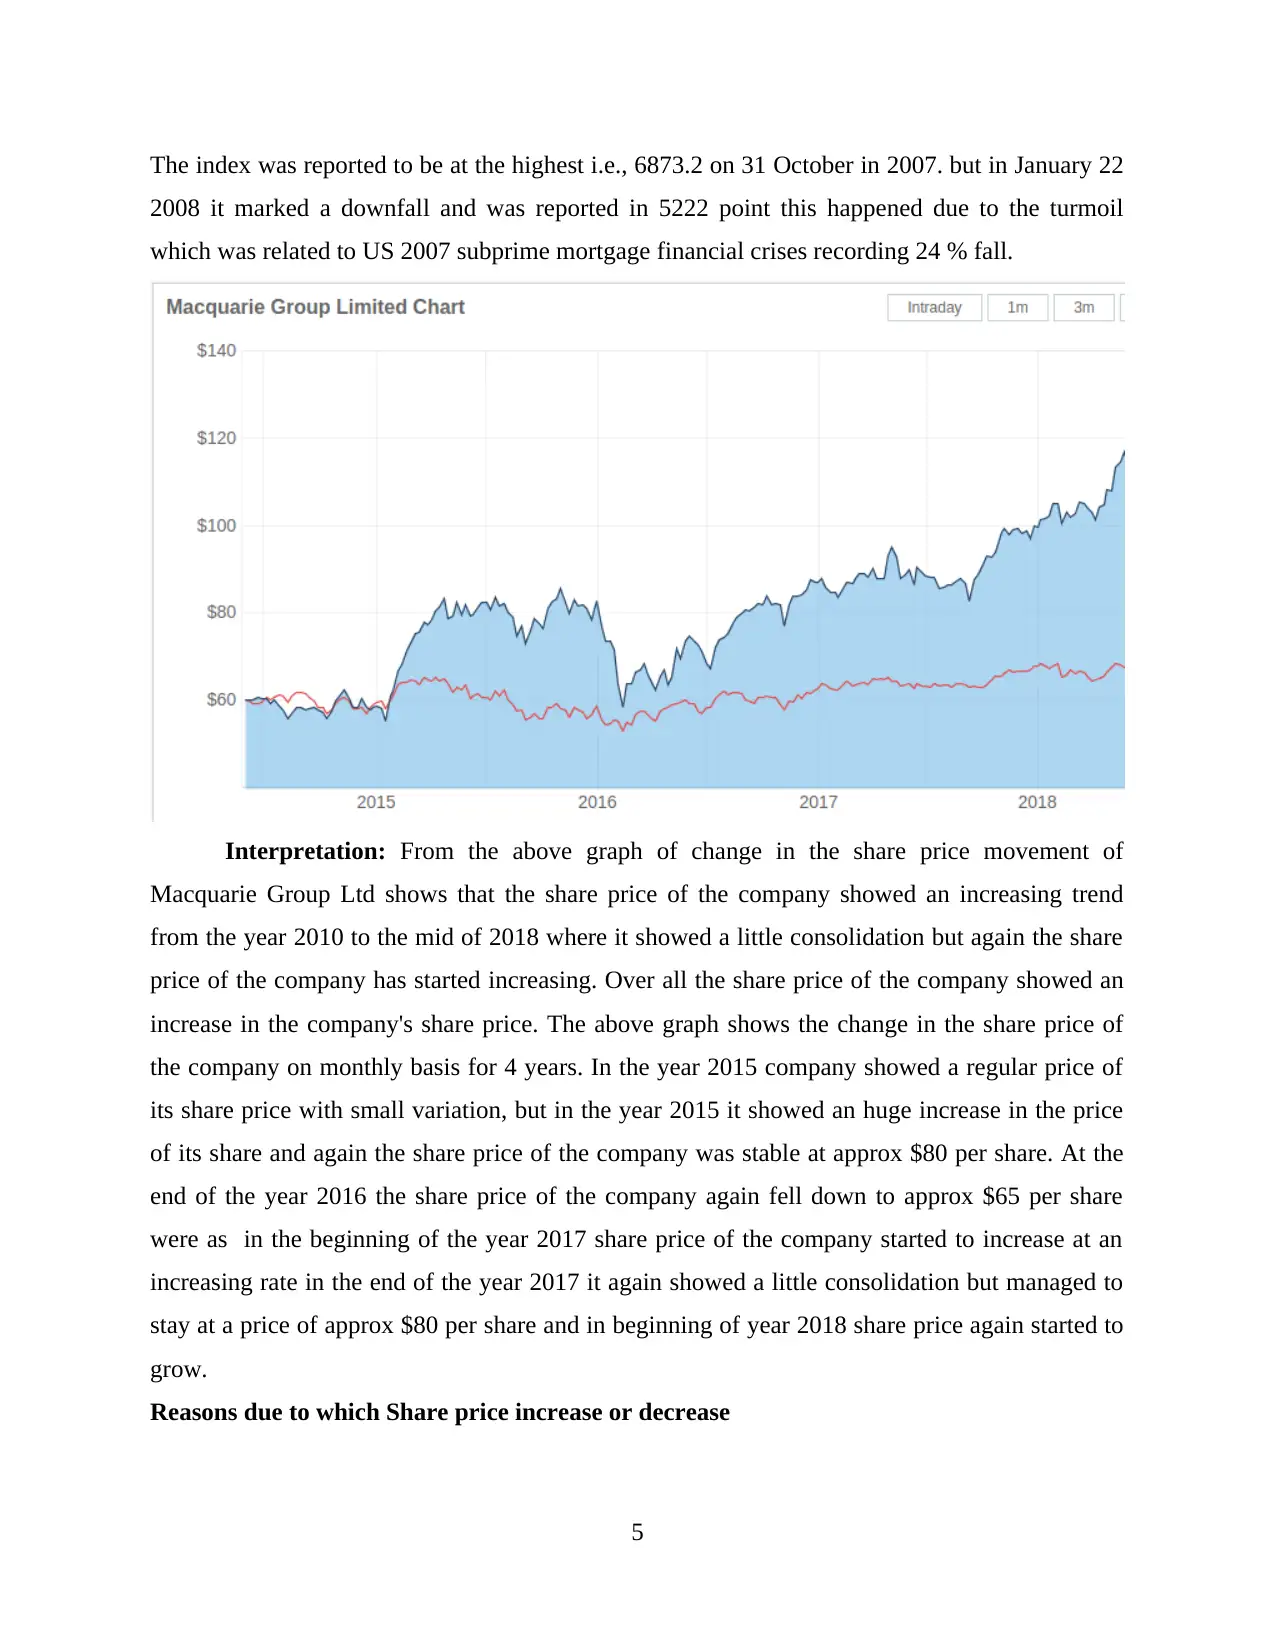
The index was reported to be at the highest i.e., 6873.2 on 31 October in 2007. but in January 22
2008 it marked a downfall and was reported in 5222 point this happened due to the turmoil
which was related to US 2007 subprime mortgage financial crises recording 24 % fall.
Interpretation: From the above graph of change in the share price movement of
Macquarie Group Ltd shows that the share price of the company showed an increasing trend
from the year 2010 to the mid of 2018 where it showed a little consolidation but again the share
price of the company has started increasing. Over all the share price of the company showed an
increase in the company's share price. The above graph shows the change in the share price of
the company on monthly basis for 4 years. In the year 2015 company showed a regular price of
its share price with small variation, but in the year 2015 it showed an huge increase in the price
of its share and again the share price of the company was stable at approx $80 per share. At the
end of the year 2016 the share price of the company again fell down to approx $65 per share
were as in the beginning of the year 2017 share price of the company started to increase at an
increasing rate in the end of the year 2017 it again showed a little consolidation but managed to
stay at a price of approx $80 per share and in beginning of year 2018 share price again started to
grow.
Reasons due to which Share price increase or decrease
5
Share price of any company's stock changes every day due to the market force and this
also works on the concept of demand and supply. If more stock of any company investors wants
to purchase than the stock which are available to b sold the price is likely to go up. The demand
for the share in any company starts to increase if the company provides a good rate of return and
if the company's financial status of the company is good that company will provide a good return
on the investment which increases the demand of the stock of the company in the share market
resulting in the increase of price of the company's share. Total revenue which was generated by
Macquarie Group Ltd in the year 2016 was reported at 5461 and in the year 2017 it fell down to
5138 which resulted in the consolidation of its share price.
Cost of Equity
Cost of equity: It is a return which a company has to require in order to decide if the
investment is met its capital return requirements (Morris, 2012). Companies mostly use it as a
threshold capital budgeting for the required rate of return which a company can provide to its
investors. Company's total cost of equity is a cost which represents to the compensation which
the market demands for the exchange for owning its assets and bearing risk of ownership. It can
be calculated by using the following formula:
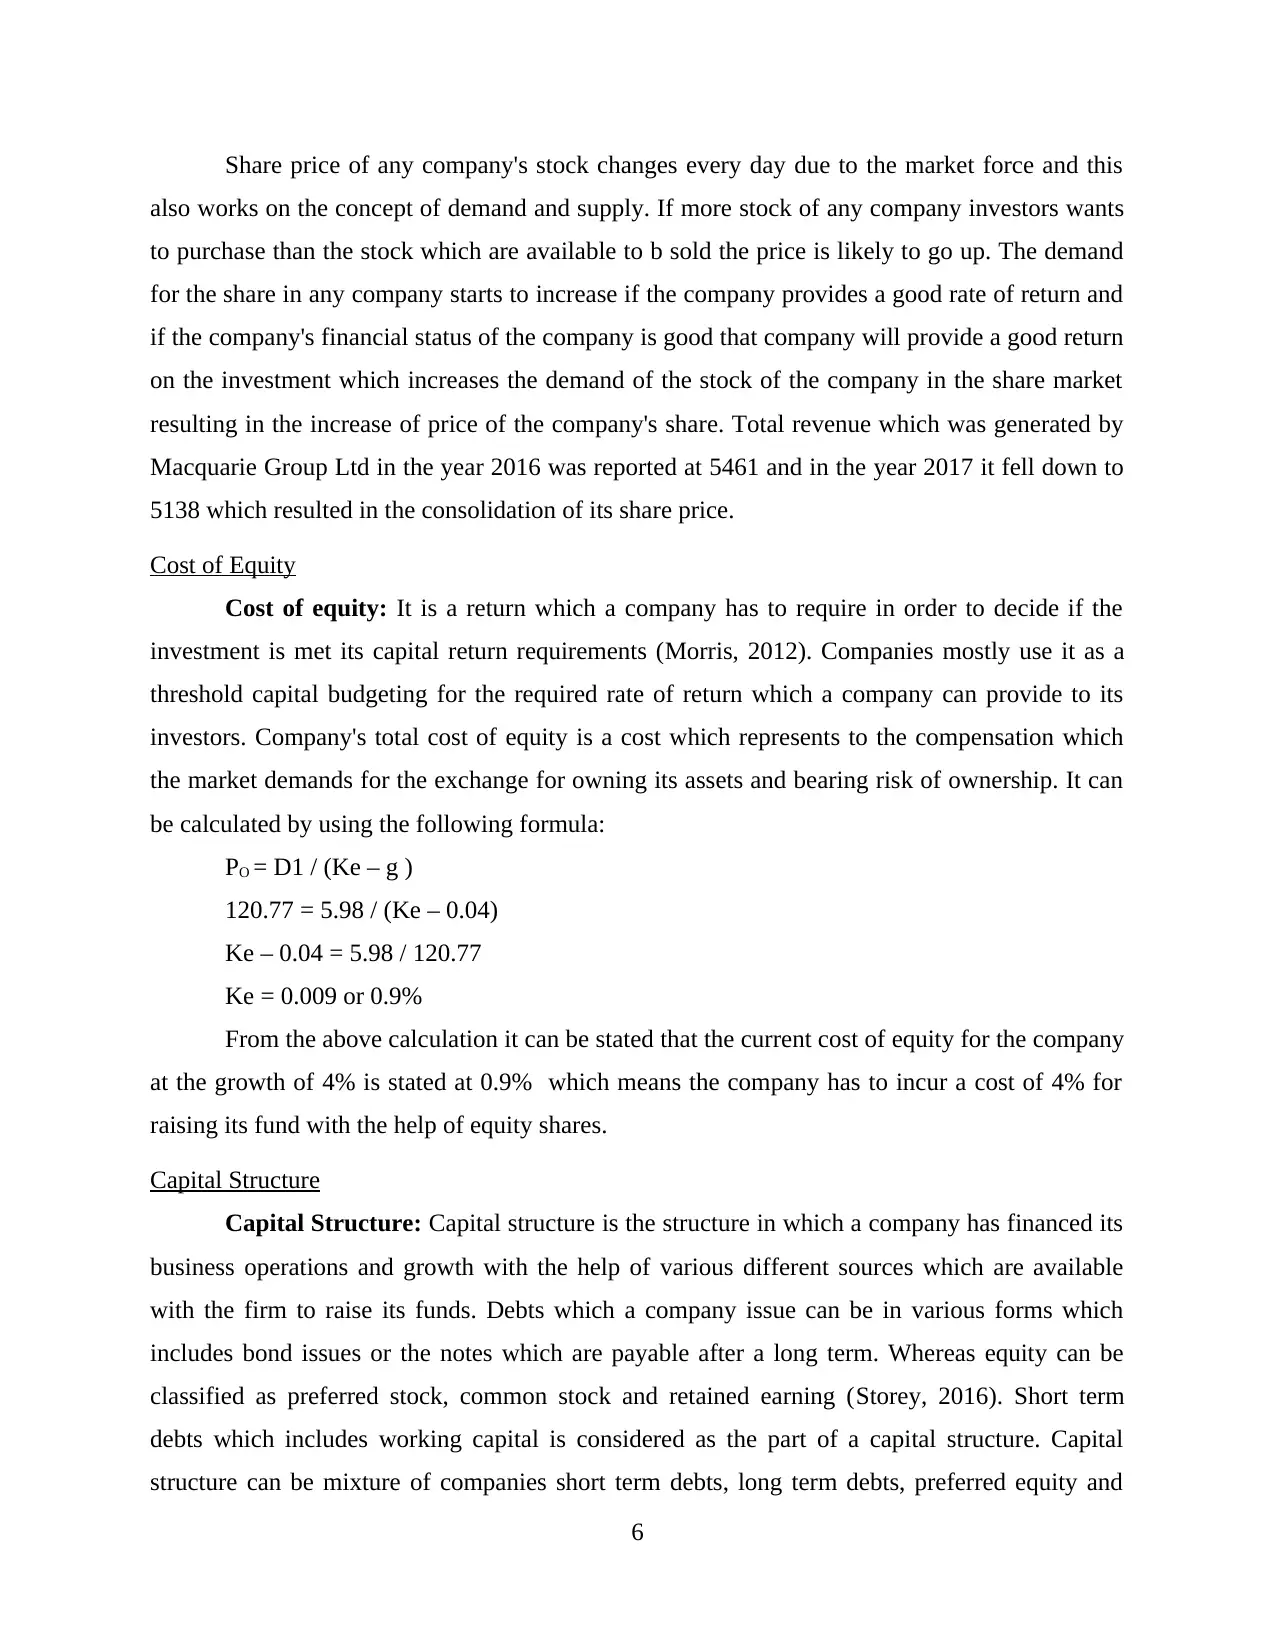
PO = D1 / (Ke – g )
120.77 = 5.98 / (Ke – 0.04)
Ke – 0.04 = 5.98 / 120.77
Ke = 0.009 or 0.9%
From the above calculation it can be stated that the current cost of equity for the company
at the growth of 4% is stated at 0.9% which means the company has to incur a cost of 4% for
raising its fund with the help of equity shares.
Capital Structure
Capital Structure: Capital structure is the structure in which a company has financed its
business operations and growth with the help of various different sources which are available
with the firm to raise its funds. Debts which a company issue can be in various forms which
includes bond issues or the notes which are payable after a long term. Whereas equity can be
classified as preferred stock, common stock and retained earning (Storey, 2016). Short term
debts which includes working capital is considered as the part of a capital structure. Capital
structure can be mixture of companies short term debts, long term debts, preferred equity and
6
also works on the concept of demand and supply. If more stock of any company investors wants
to purchase than the stock which are available to b sold the price is likely to go up. The demand
for the share in any company starts to increase if the company provides a good rate of return and
if the company's financial status of the company is good that company will provide a good return
on the investment which increases the demand of the stock of the company in the share market
resulting in the increase of price of the company's share. Total revenue which was generated by
Macquarie Group Ltd in the year 2016 was reported at 5461 and in the year 2017 it fell down to
5138 which resulted in the consolidation of its share price.
Cost of Equity
Cost of equity: It is a return which a company has to require in order to decide if the
investment is met its capital return requirements (Morris, 2012). Companies mostly use it as a
threshold capital budgeting for the required rate of return which a company can provide to its
investors. Company's total cost of equity is a cost which represents to the compensation which
the market demands for the exchange for owning its assets and bearing risk of ownership. It can
be calculated by using the following formula:
PO = D1 / (Ke – g )
120.77 = 5.98 / (Ke – 0.04)
Ke – 0.04 = 5.98 / 120.77
Ke = 0.009 or 0.9%
From the above calculation it can be stated that the current cost of equity for the company
at the growth of 4% is stated at 0.9% which means the company has to incur a cost of 4% for
raising its fund with the help of equity shares.
Capital Structure
Capital Structure: Capital structure is the structure in which a company has financed its
business operations and growth with the help of various different sources which are available
with the firm to raise its funds. Debts which a company issue can be in various forms which
includes bond issues or the notes which are payable after a long term. Whereas equity can be
classified as preferred stock, common stock and retained earning (Storey, 2016). Short term
debts which includes working capital is considered as the part of a capital structure. Capital
structure can be mixture of companies short term debts, long term debts, preferred equity and
6
⊘ This is a preview!⊘
Do you want full access?
Subscribe today to unlock all pages.
Trusted by 1+ million students worldwide
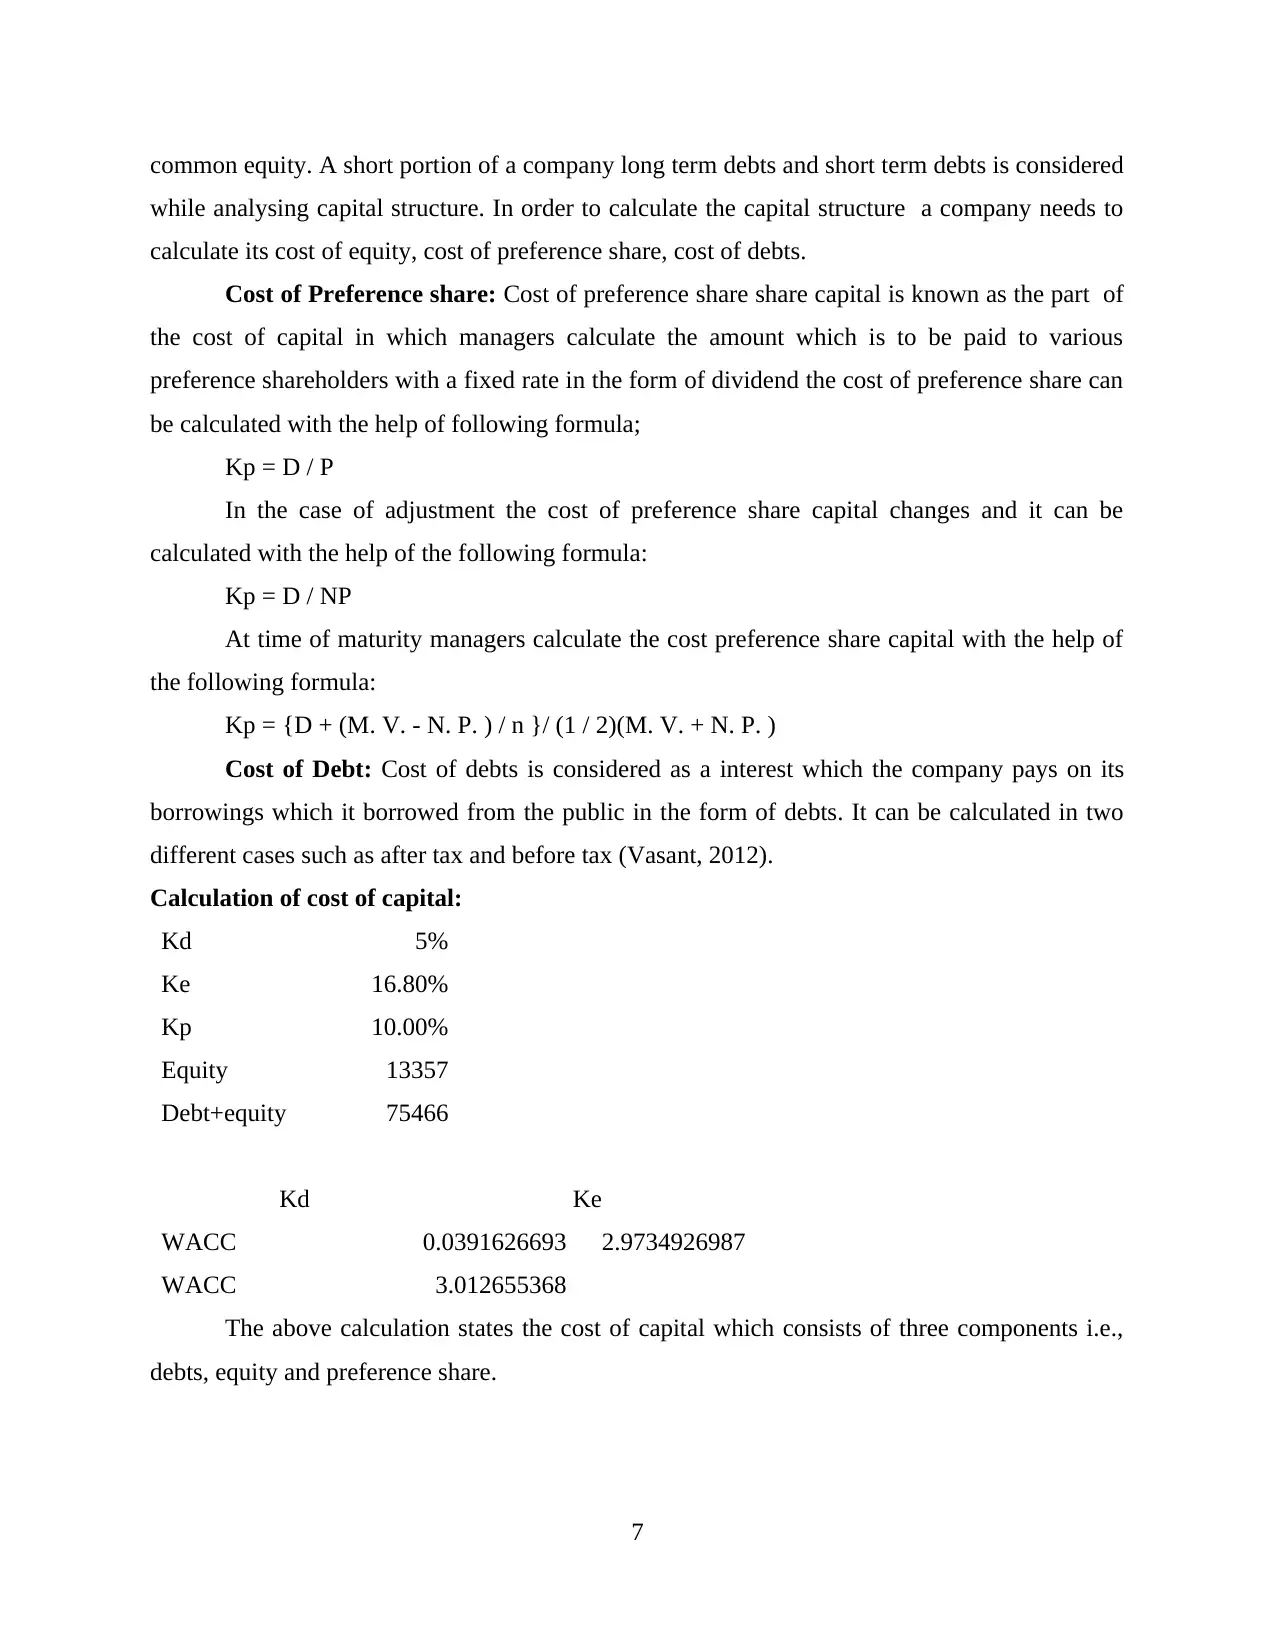
common equity. A short portion of a company long term debts and short term debts is considered
while analysing capital structure. In order to calculate the capital structure a company needs to
calculate its cost of equity, cost of preference share, cost of debts.
Cost of Preference share: Cost of preference share share capital is known as the part of
the cost of capital in which managers calculate the amount which is to be paid to various
preference shareholders with a fixed rate in the form of dividend the cost of preference share can
be calculated with the help of following formula;
Kp = D / P
In the case of adjustment the cost of preference share capital changes and it can be
calculated with the help of the following formula:
Kp = D / NP
At time of maturity managers calculate the cost preference share capital with the help of
the following formula:
Kp = {D + (M. V. - N. P. ) / n }/ (1 / 2)(M. V. + N. P. )
Cost of Debt: Cost of debts is considered as a interest which the company pays on its
borrowings which it borrowed from the public in the form of debts. It can be calculated in two
different cases such as after tax and before tax (Vasant, 2012).
Calculation of cost of capital:
Kd 5%
Ke 16.80%
Kp 10.00%
Equity 13357
Debt+equity 75466
Kd Ke
WACC 0.0391626693 2.9734926987
WACC 3.012655368
The above calculation states the cost of capital which consists of three components i.e.,
debts, equity and preference share.
7
Paraphrase This Document
Need a fresh take? Get an instant paraphrase of this document with our AI Paraphraser
CONCLUSION
From the above file it can be concluded that its is important for a business to manage its
finance and raise it funds from various other resources. The above file states the complete
description of the company which was considered while working. It also states the various
methods and types of ratios which can used in order to analyse the company's performance. It
can be also be concluded that the companies share price can be changed due to the change in the
revenue generated by the company.
8
1 out of 11
Related Documents


Your All-in-One AI-Powered Toolkit for Academic Success.
+13062052269
info@desklib.com
Available 24*7 on WhatsApp / Email
![[object Object]](/_next/static/media/star-bottom.7253800d.svg)
Unlock your academic potential
Copyright © 2020–2026 A2Z Services. All Rights Reserved. Developed and managed by ZUCOL.