Finance Management Report - Analysis of Secondary Sector

Verified

Added on  2022/12/28

|3
|338
|38
Report
AI Summary
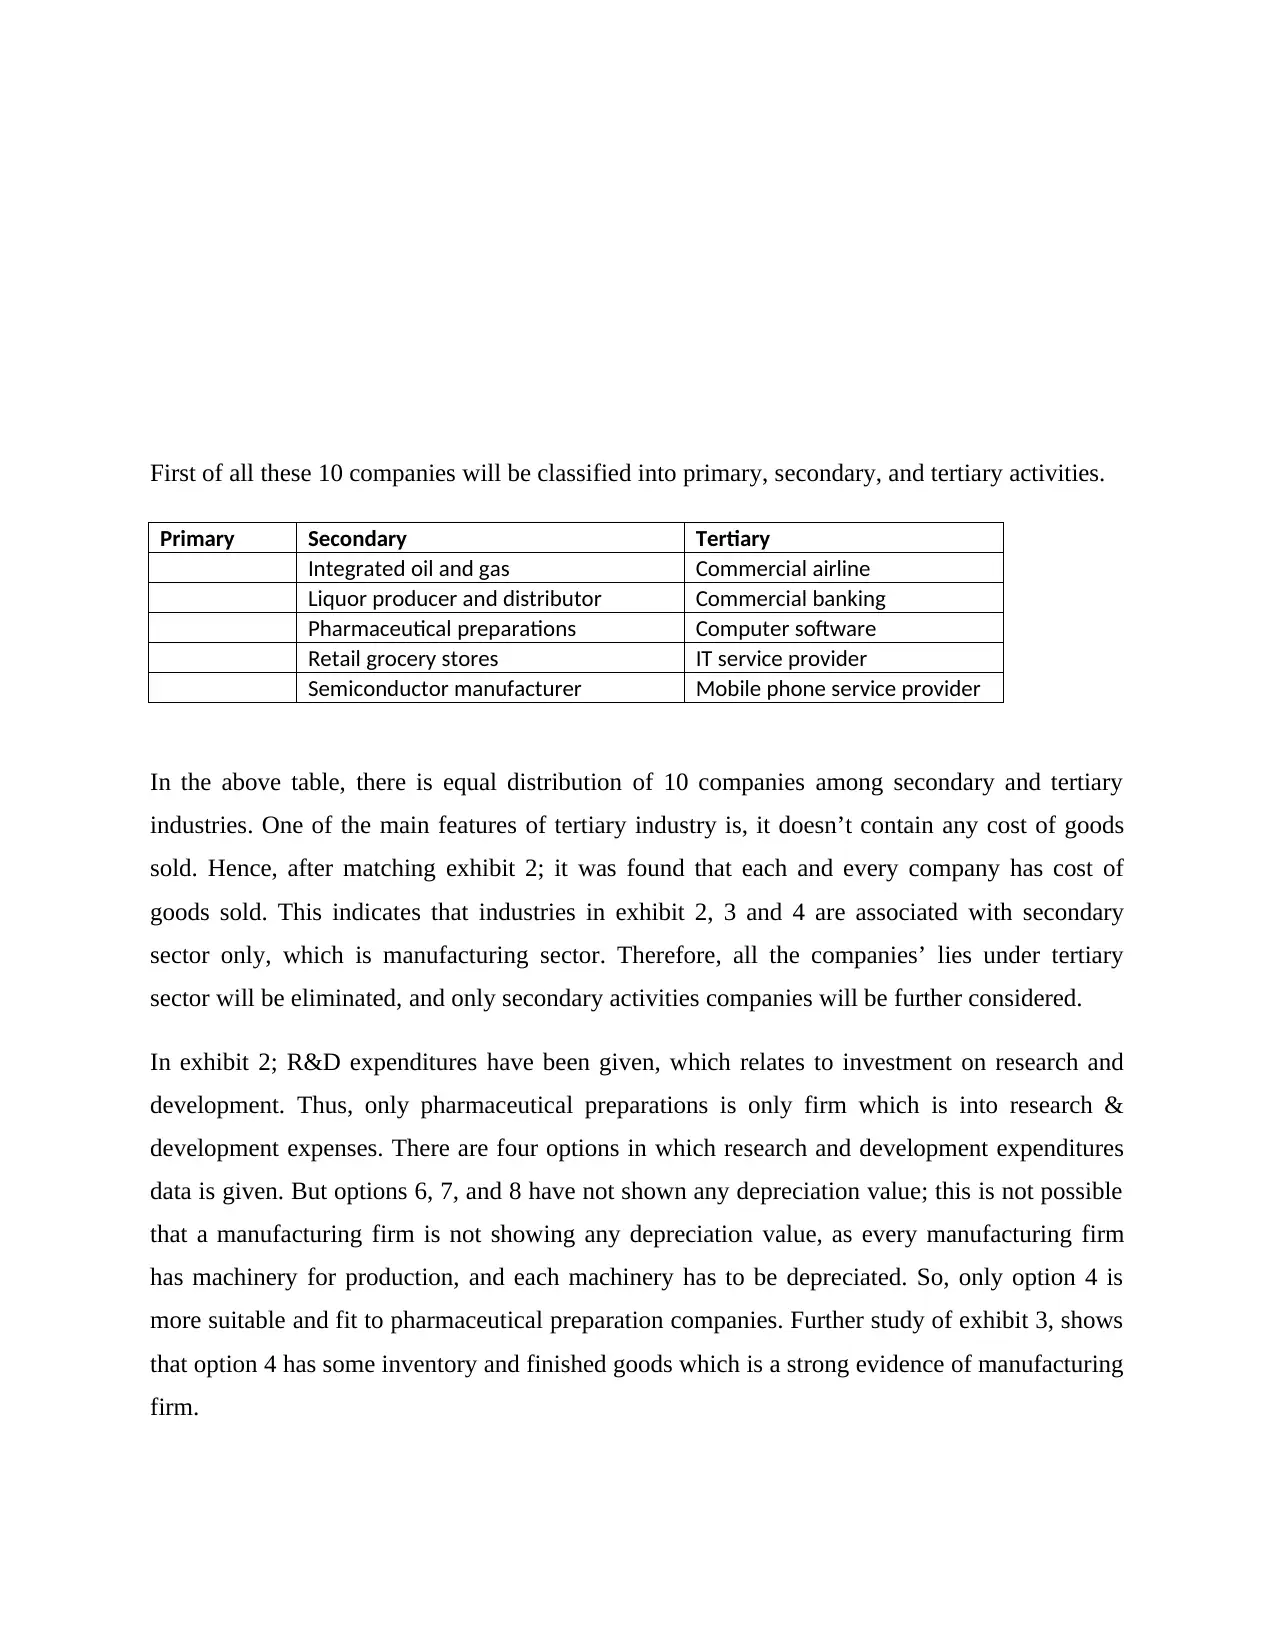
This report focuses on the financial management of companies, specifically analyzing those within the secondary sector. The analysis begins by classifying companies into primary, secondary, and tertiary sectors. The report then concentrates on the secondary sector due to the presence of cost of goods sold and manufacturing activities. The analysis further delves into research and development expenditures, identifying pharmaceutical preparations as a key area. The report examines various financial data options, selecting the most suitable one based on depreciation values, inventory, and financial ratios like the acid test ratio and current ratio. The conclusion is that the chosen option aligns with the characteristics of a manufacturing firm, highlighting the importance of inventory management in the analysis.
Document Page
Finance
Management
tabler-icon-diamond-filled.svg

Paraphrase This Document

Need a fresh take? Get an instant paraphrase of this document with our AI Paraphraser
Document Page
First of all these 10 companies will be classified into primary, secondary, and tertiary activities.
Primary Secondary Tertiary
Integrated oil and gas Commercial airline
Liquor producer and distributor Commercial banking
Pharmaceutical preparations Computer software
Retail grocery stores IT service provider
Semiconductor manufacturer Mobile phone service provider
In the above table, there is equal distribution of 10 companies among secondary and tertiary
industries. One of the main features of tertiary industry is, it doesn’t contain any cost of goods
sold. Hence, after matching exhibit 2; it was found that each and every company has cost of
goods sold. This indicates that industries in exhibit 2, 3 and 4 are associated with secondary
sector only, which is manufacturing sector. Therefore, all the companies’ lies under tertiary
sector will be eliminated, and only secondary activities companies will be further considered.
In exhibit 2; R&D expenditures have been given, which relates to investment on research and
development. Thus, only pharmaceutical preparations is only firm which is into research &
development expenses. There are four options in which research and development expenditures
data is given. But options 6, 7, and 8 have not shown any depreciation value; this is not possible
that a manufacturing firm is not showing any depreciation value, as every manufacturing firm
has machinery for production, and each machinery has to be depreciated. So, only option 4 is
more suitable and fit to pharmaceutical preparation companies. Further study of exhibit 3, shows
that option 4 has some inventory and finished goods which is a strong evidence of manufacturing
firm.
Document Page
In exhibit 4; the difference between acid test ratio and current ratio in option 4, is the indication
of the fact that there is inventory maintained by the industry due to which difference arises
between both financial ratio types.
chevron_up_icon
1 out of 3
circle_padding
hide_on_mobile
zoom_out_icon
[object Object]