University Finance: Accounting and Finance for Managers Homework
VerifiedAdded on 2022/09/01
|14
|1304
|16
Homework Assignment
AI Summary
This document presents a comprehensive solution to an accounting and finance assignment designed for managers. The assignment covers a range of critical topics including the role of financial managers, capital requirements, and optimal financing sources. It delves into the application of ratio analysis for financial statement interpretation, the concept of annuity and time value of money. The solution further addresses investment decisions, capital budgeting techniques (NPV, IRR, payback period), and capital structure decisions. The assignment also explores cost of capital, cash management strategies, and break-even analysis. It concludes with a comparison of income statements and cash flow statements, along with the application of time value of money in capital budgeting.
Running head: ACCOUNITNG AND FINANCE FOR MANAGERS
Accounting and Finance for Managers
Name of the Student:
Name of the University:
Author’s Note:
Accounting and Finance for Managers
Name of the Student:
Name of the University:
Author’s Note:
Paraphrase This Document
Need a fresh take? Get an instant paraphrase of this document with our AI Paraphraser
1
ACCOUNTING AND FINANCE FOR MANAGERS
Table of Contents
Answer to question 1:......................................................................................................................3
Part a:...........................................................................................................................................3
Part b:...........................................................................................................................................3
Part c:...........................................................................................................................................3
Answer to question 2:......................................................................................................................4
Part a:...........................................................................................................................................4
Part b:...........................................................................................................................................5
Answer to question 3:......................................................................................................................7
Answer to question 4:......................................................................................................................8
Part a:...........................................................................................................................................8
Part b:...........................................................................................................................................8
Answer to question 5:......................................................................................................................9
Part a:...........................................................................................................................................9
Part b:.........................................................................................................................................10
Answer to question 6:....................................................................................................................10
Part a:.........................................................................................................................................10
Part b:.........................................................................................................................................10
Part c:.........................................................................................................................................10
Part d:.........................................................................................................................................11
2
ACCOUNTING AND FINANCE FOR MANAGERS
Part e:.........................................................................................................................................11
Answer to question 7:....................................................................................................................11
Part 1:.........................................................................................................................................11
Part 2:.........................................................................................................................................11
References and bibliography:........................................................................................................13
⊘ This is a preview!⊘
Do you want full access?
Subscribe today to unlock all pages.
Trusted by 1+ million students worldwide
3
ACCOUNTING AND FINANCE FOR MANAGERS
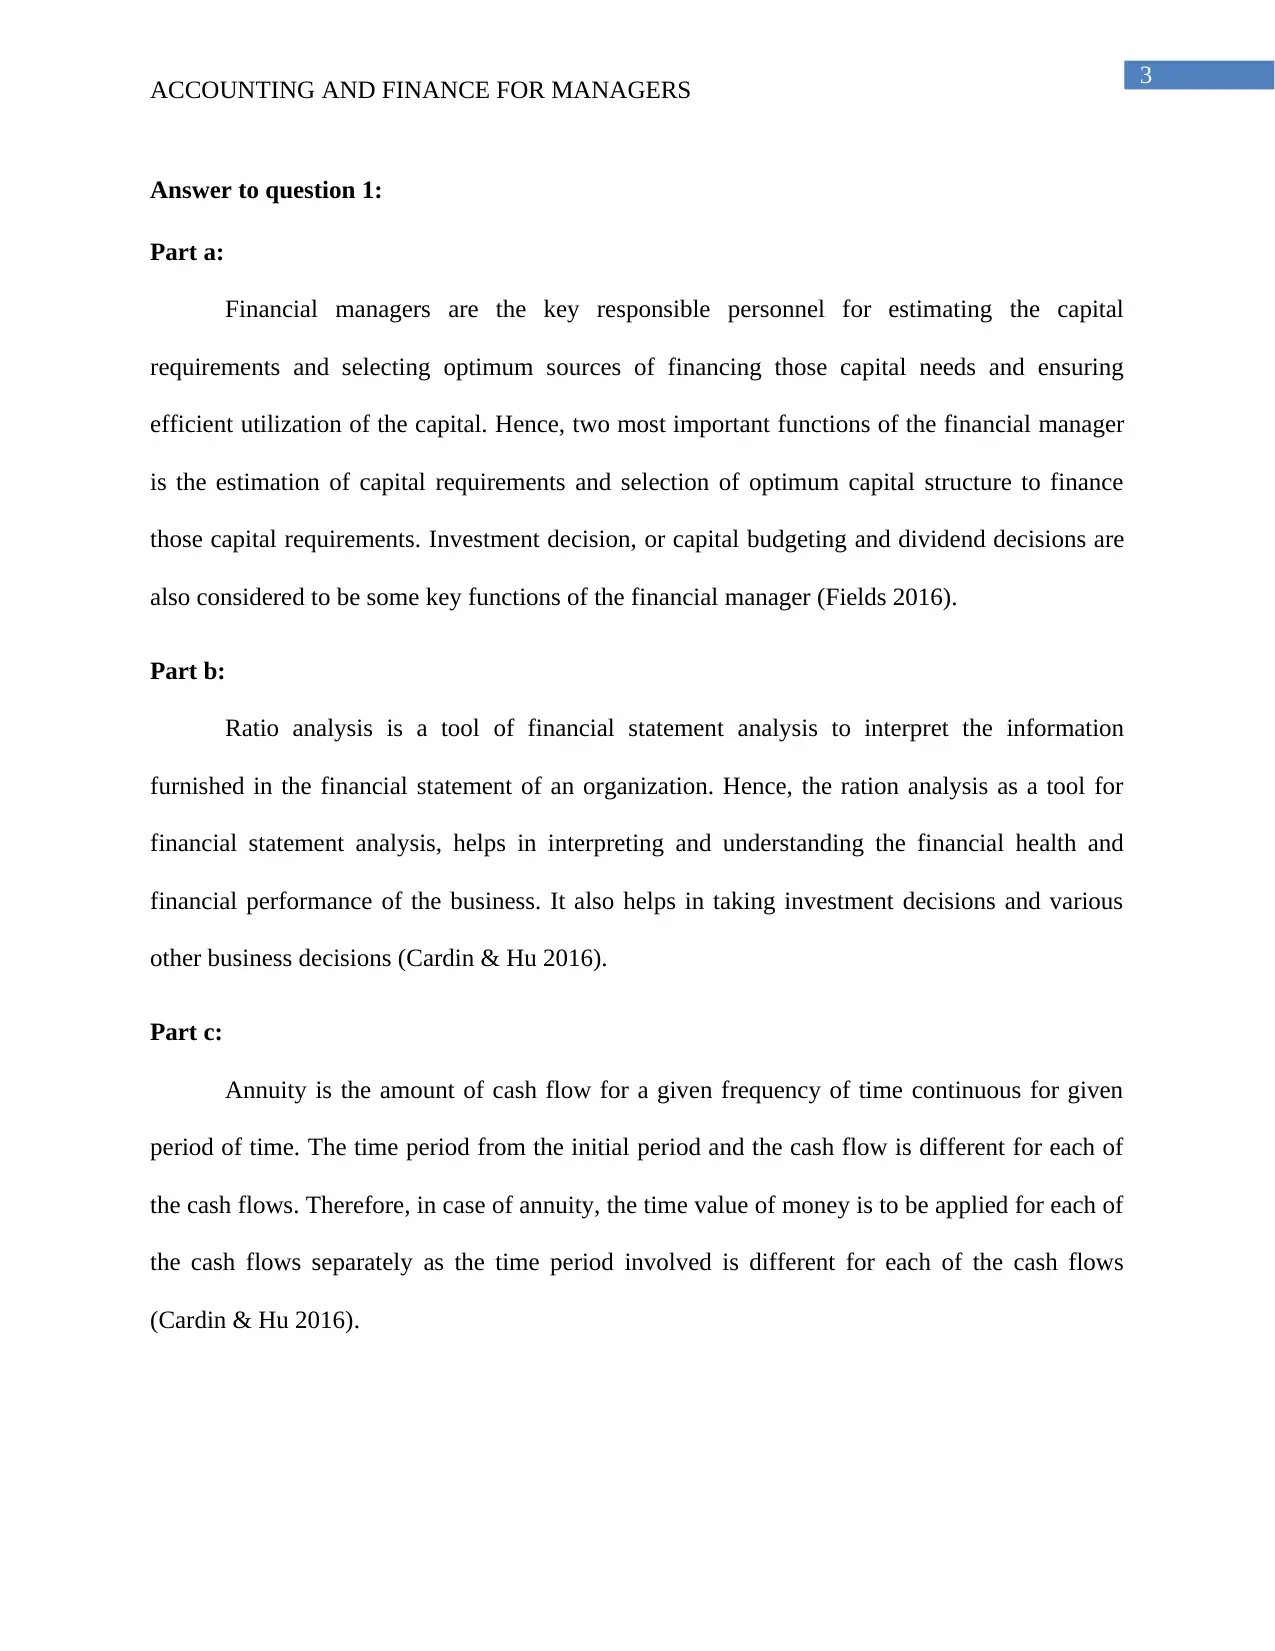
Answer to question 1:
Part a:
Financial managers are the key responsible personnel for estimating the capital
requirements and selecting optimum sources of financing those capital needs and ensuring
efficient utilization of the capital. Hence, two most important functions of the financial manager
is the estimation of capital requirements and selection of optimum capital structure to finance
those capital requirements. Investment decision, or capital budgeting and dividend decisions are
also considered to be some key functions of the financial manager (Fields 2016).
Part b:
Ratio analysis is a tool of financial statement analysis to interpret the information
furnished in the financial statement of an organization. Hence, the ration analysis as a tool for
financial statement analysis, helps in interpreting and understanding the financial health and
financial performance of the business. It also helps in taking investment decisions and various
other business decisions (Cardin & Hu 2016).
Part c:
Annuity is the amount of cash flow for a given frequency of time continuous for given
period of time. The time period from the initial period and the cash flow is different for each of
the cash flows. Therefore, in case of annuity, the time value of money is to be applied for each of
the cash flows separately as the time period involved is different for each of the cash flows
(Cardin & Hu 2016).
ACCOUNTING AND FINANCE FOR MANAGERS
Answer to question 1:
Part a:
Financial managers are the key responsible personnel for estimating the capital
requirements and selecting optimum sources of financing those capital needs and ensuring
efficient utilization of the capital. Hence, two most important functions of the financial manager
is the estimation of capital requirements and selection of optimum capital structure to finance
those capital requirements. Investment decision, or capital budgeting and dividend decisions are
also considered to be some key functions of the financial manager (Fields 2016).
Part b:
Ratio analysis is a tool of financial statement analysis to interpret the information
furnished in the financial statement of an organization. Hence, the ration analysis as a tool for
financial statement analysis, helps in interpreting and understanding the financial health and
financial performance of the business. It also helps in taking investment decisions and various
other business decisions (Cardin & Hu 2016).
Part c:
Annuity is the amount of cash flow for a given frequency of time continuous for given
period of time. The time period from the initial period and the cash flow is different for each of
the cash flows. Therefore, in case of annuity, the time value of money is to be applied for each of
the cash flows separately as the time period involved is different for each of the cash flows
(Cardin & Hu 2016).
Paraphrase This Document
Need a fresh take? Get an instant paraphrase of this document with our AI Paraphraser
4
ACCOUNTING AND FINANCE FOR MANAGERS
Answer to question 2:
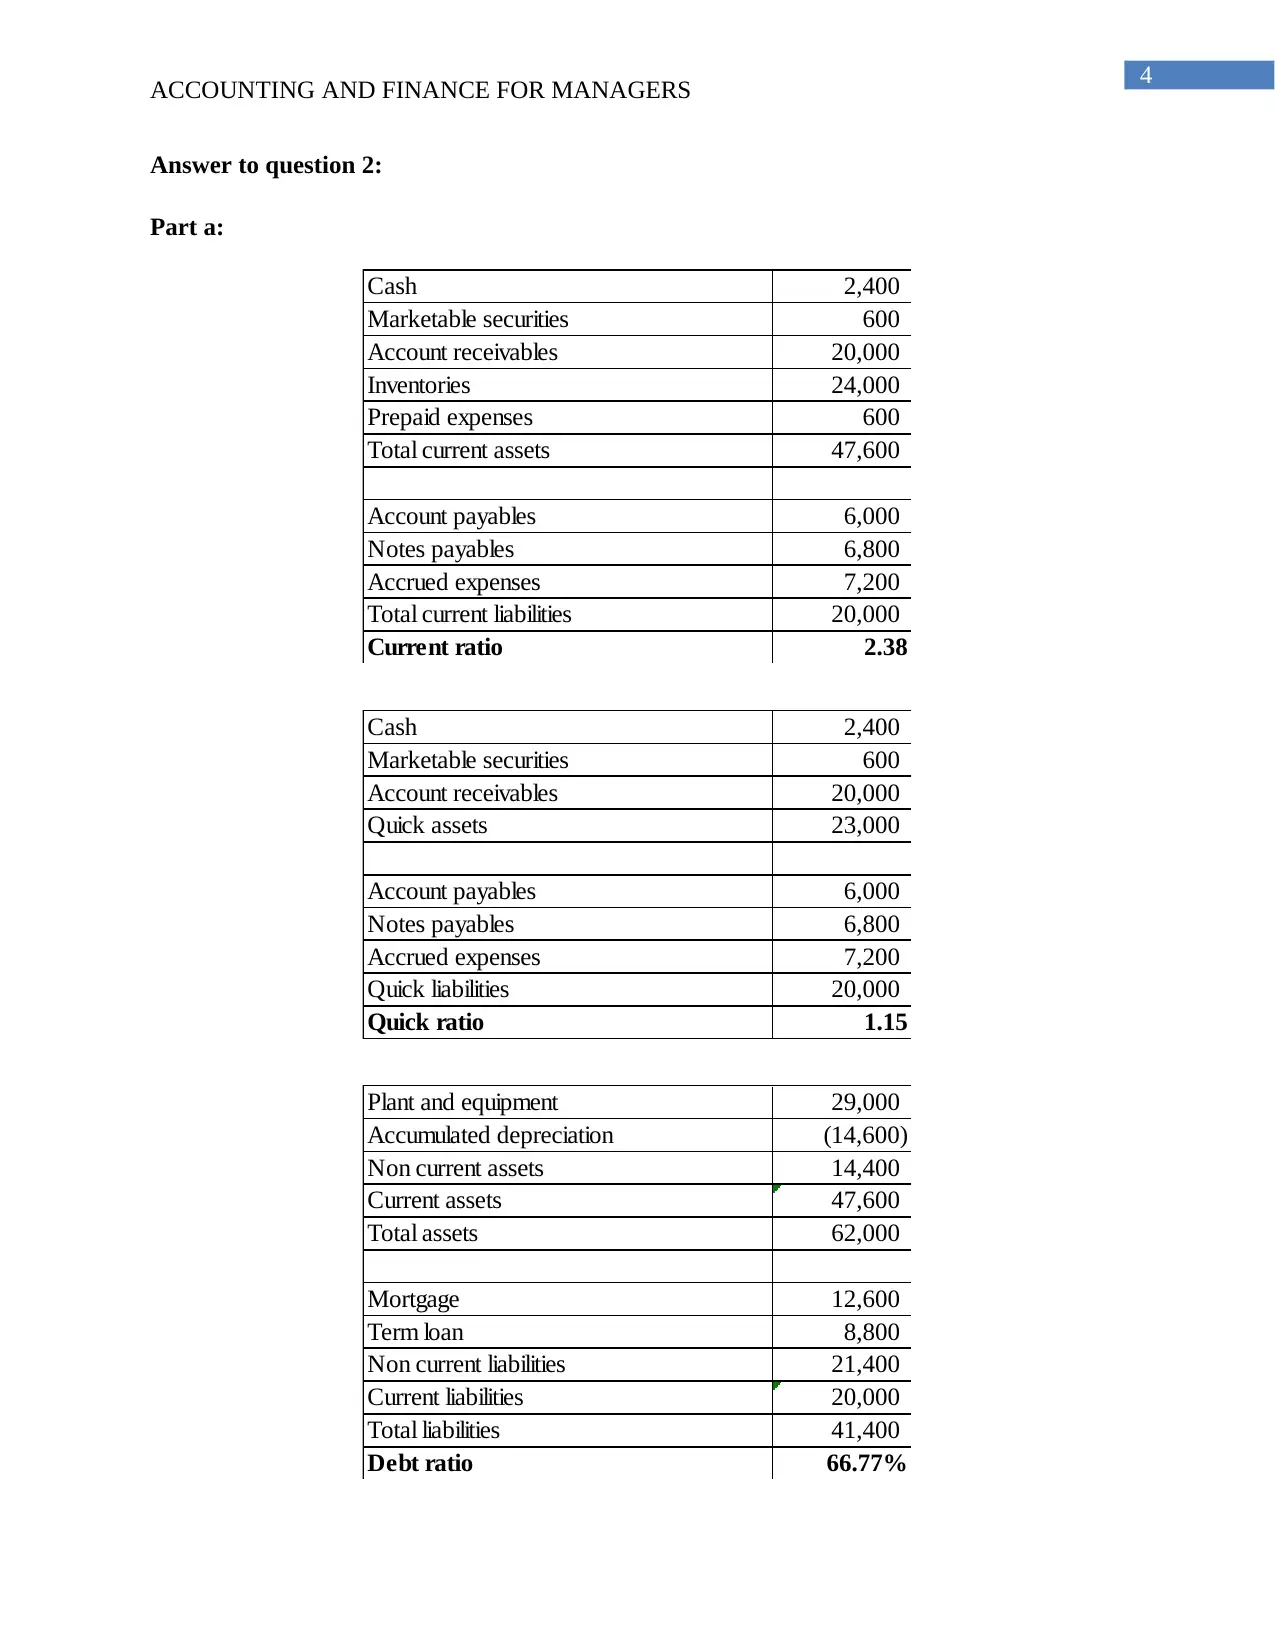
Part a:
Cash 2,400
Marketable securities 600
Account receivables 20,000
Inventories 24,000
Prepaid expenses 600
Total current assets 47,600
Account payables 6,000
Notes payables 6,800
Accrued expenses 7,200
Total current liabilities 20,000
Current ratio 2.38
Cash 2,400
Marketable securities 600
Account receivables 20,000
Quick assets 23,000
Account payables 6,000
Notes payables 6,800
Accrued expenses 7,200
Quick liabilities 20,000
Quick ratio 1.15
Plant and equipment 29,000
Accumulated depreciation (14,600)
Non current assets 14,400
Current assets 47,600
Total assets 62,000
Mortgage 12,600
Term loan 8,800
Non current liabilities 21,400
Current liabilities 20,000
Total liabilities 41,400
Debt ratio 66.77%
ACCOUNTING AND FINANCE FOR MANAGERS
Answer to question 2:
Part a:
Cash 2,400
Marketable securities 600
Account receivables 20,000
Inventories 24,000
Prepaid expenses 600
Total current assets 47,600
Account payables 6,000
Notes payables 6,800
Accrued expenses 7,200
Total current liabilities 20,000
Current ratio 2.38
Cash 2,400
Marketable securities 600
Account receivables 20,000
Quick assets 23,000
Account payables 6,000
Notes payables 6,800
Accrued expenses 7,200
Quick liabilities 20,000
Quick ratio 1.15
Plant and equipment 29,000
Accumulated depreciation (14,600)
Non current assets 14,400
Current assets 47,600
Total assets 62,000
Mortgage 12,600
Term loan 8,800
Non current liabilities 21,400
Current liabilities 20,000
Total liabilities 41,400
Debt ratio 66.77%
5
ACCOUNTING AND FINANCE FOR MANAGERS
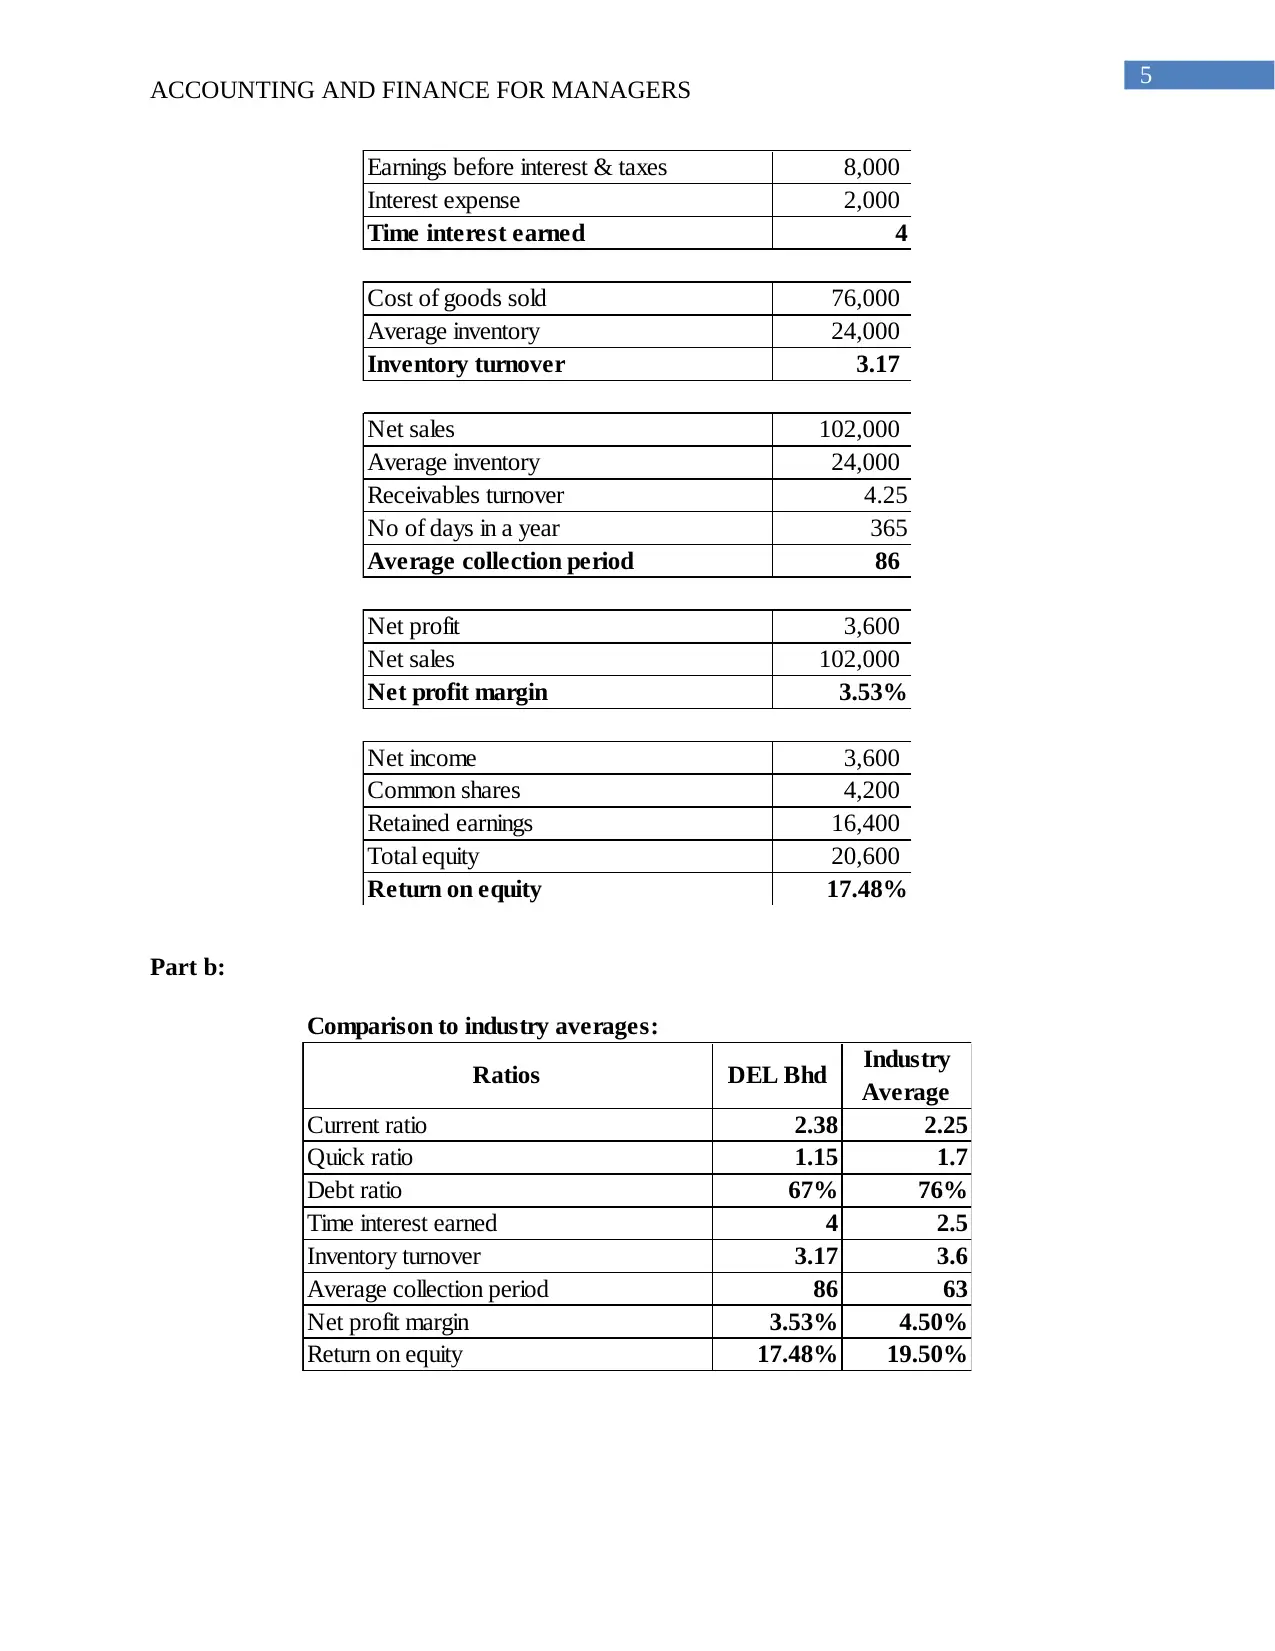
Earnings before interest & taxes 8,000
Interest expense 2,000
Time interest earned 4
Cost of goods sold 76,000
Average inventory 24,000
Inventory turnover 3.17
Net sales 102,000
Average inventory 24,000
Receivables turnover 4.25
No of days in a year 365
Average collection period 86
Net profit 3,600
Net sales 102,000
Net profit margin 3.53%
Net income 3,600
Common shares 4,200
Retained earnings 16,400
Total equity 20,600
Return on equity 17.48%
Part b:
Comparison to industry averages:
Ratios DEL Bhd Industry
Average
Current ratio 2.38 2.25
Quick ratio 1.15 1.7
Debt ratio 67% 76%
Time interest earned 4 2.5
Inventory turnover 3.17 3.6
Average collection period 86 63
Net profit margin 3.53% 4.50%
Return on equity 17.48% 19.50%
ACCOUNTING AND FINANCE FOR MANAGERS
Earnings before interest & taxes 8,000
Interest expense 2,000
Time interest earned 4
Cost of goods sold 76,000
Average inventory 24,000
Inventory turnover 3.17
Net sales 102,000
Average inventory 24,000
Receivables turnover 4.25
No of days in a year 365
Average collection period 86
Net profit 3,600
Net sales 102,000
Net profit margin 3.53%
Net income 3,600
Common shares 4,200
Retained earnings 16,400
Total equity 20,600
Return on equity 17.48%
Part b:
Comparison to industry averages:
Ratios DEL Bhd Industry
Average
Current ratio 2.38 2.25
Quick ratio 1.15 1.7
Debt ratio 67% 76%
Time interest earned 4 2.5
Inventory turnover 3.17 3.6
Average collection period 86 63
Net profit margin 3.53% 4.50%
Return on equity 17.48% 19.50%
⊘ This is a preview!⊘
Do you want full access?
Subscribe today to unlock all pages.
Trusted by 1+ million students worldwide
6
ACCOUNTING AND FINANCE FOR MANAGERS
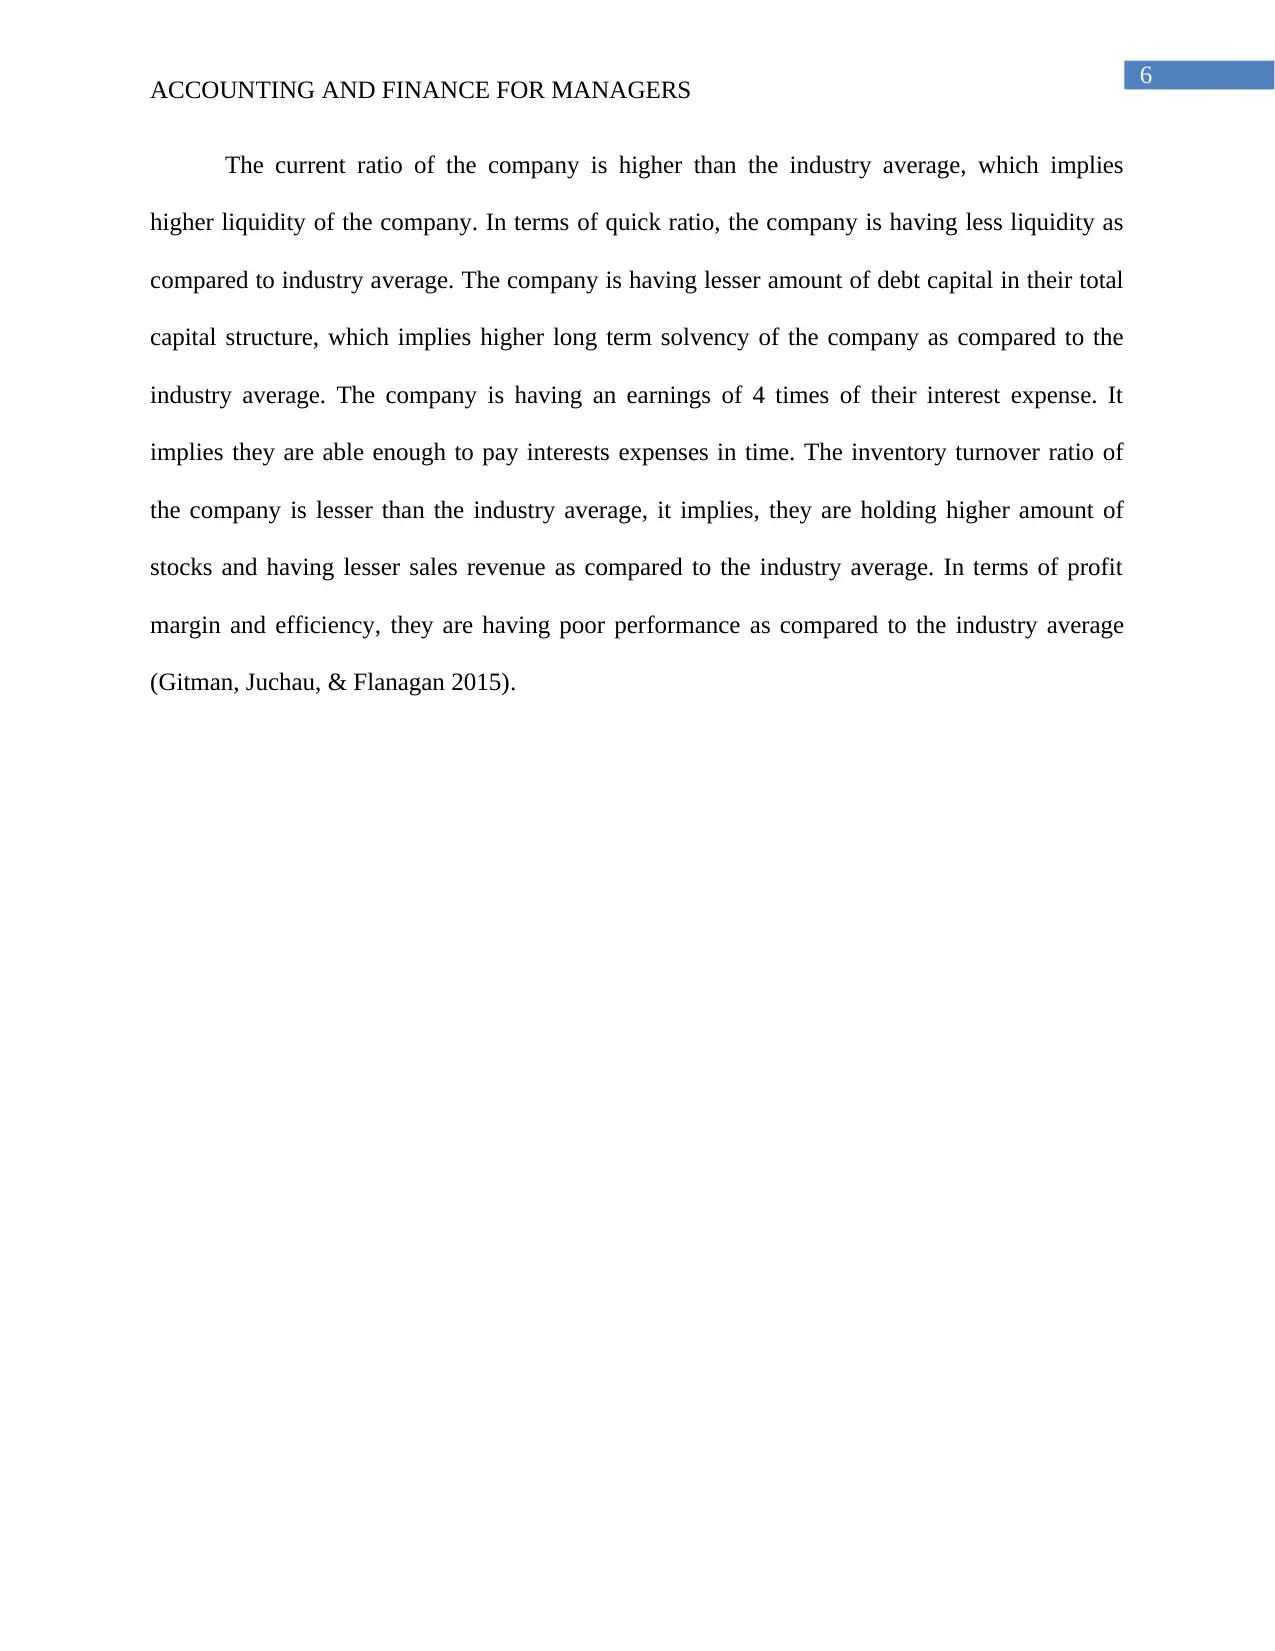
The current ratio of the company is higher than the industry average, which implies
higher liquidity of the company. In terms of quick ratio, the company is having less liquidity as
compared to industry average. The company is having lesser amount of debt capital in their total
capital structure, which implies higher long term solvency of the company as compared to the
industry average. The company is having an earnings of 4 times of their interest expense. It
implies they are able enough to pay interests expenses in time. The inventory turnover ratio of
the company is lesser than the industry average, it implies, they are holding higher amount of
stocks and having lesser sales revenue as compared to the industry average. In terms of profit
margin and efficiency, they are having poor performance as compared to the industry average
(Gitman, Juchau, & Flanagan 2015).
ACCOUNTING AND FINANCE FOR MANAGERS
The current ratio of the company is higher than the industry average, which implies
higher liquidity of the company. In terms of quick ratio, the company is having less liquidity as
compared to industry average. The company is having lesser amount of debt capital in their total
capital structure, which implies higher long term solvency of the company as compared to the
industry average. The company is having an earnings of 4 times of their interest expense. It
implies they are able enough to pay interests expenses in time. The inventory turnover ratio of
the company is lesser than the industry average, it implies, they are holding higher amount of
stocks and having lesser sales revenue as compared to the industry average. In terms of profit
margin and efficiency, they are having poor performance as compared to the industry average
(Gitman, Juchau, & Flanagan 2015).
Paraphrase This Document
Need a fresh take? Get an instant paraphrase of this document with our AI Paraphraser
7
ACCOUNTING AND FINANCE FOR MANAGERS
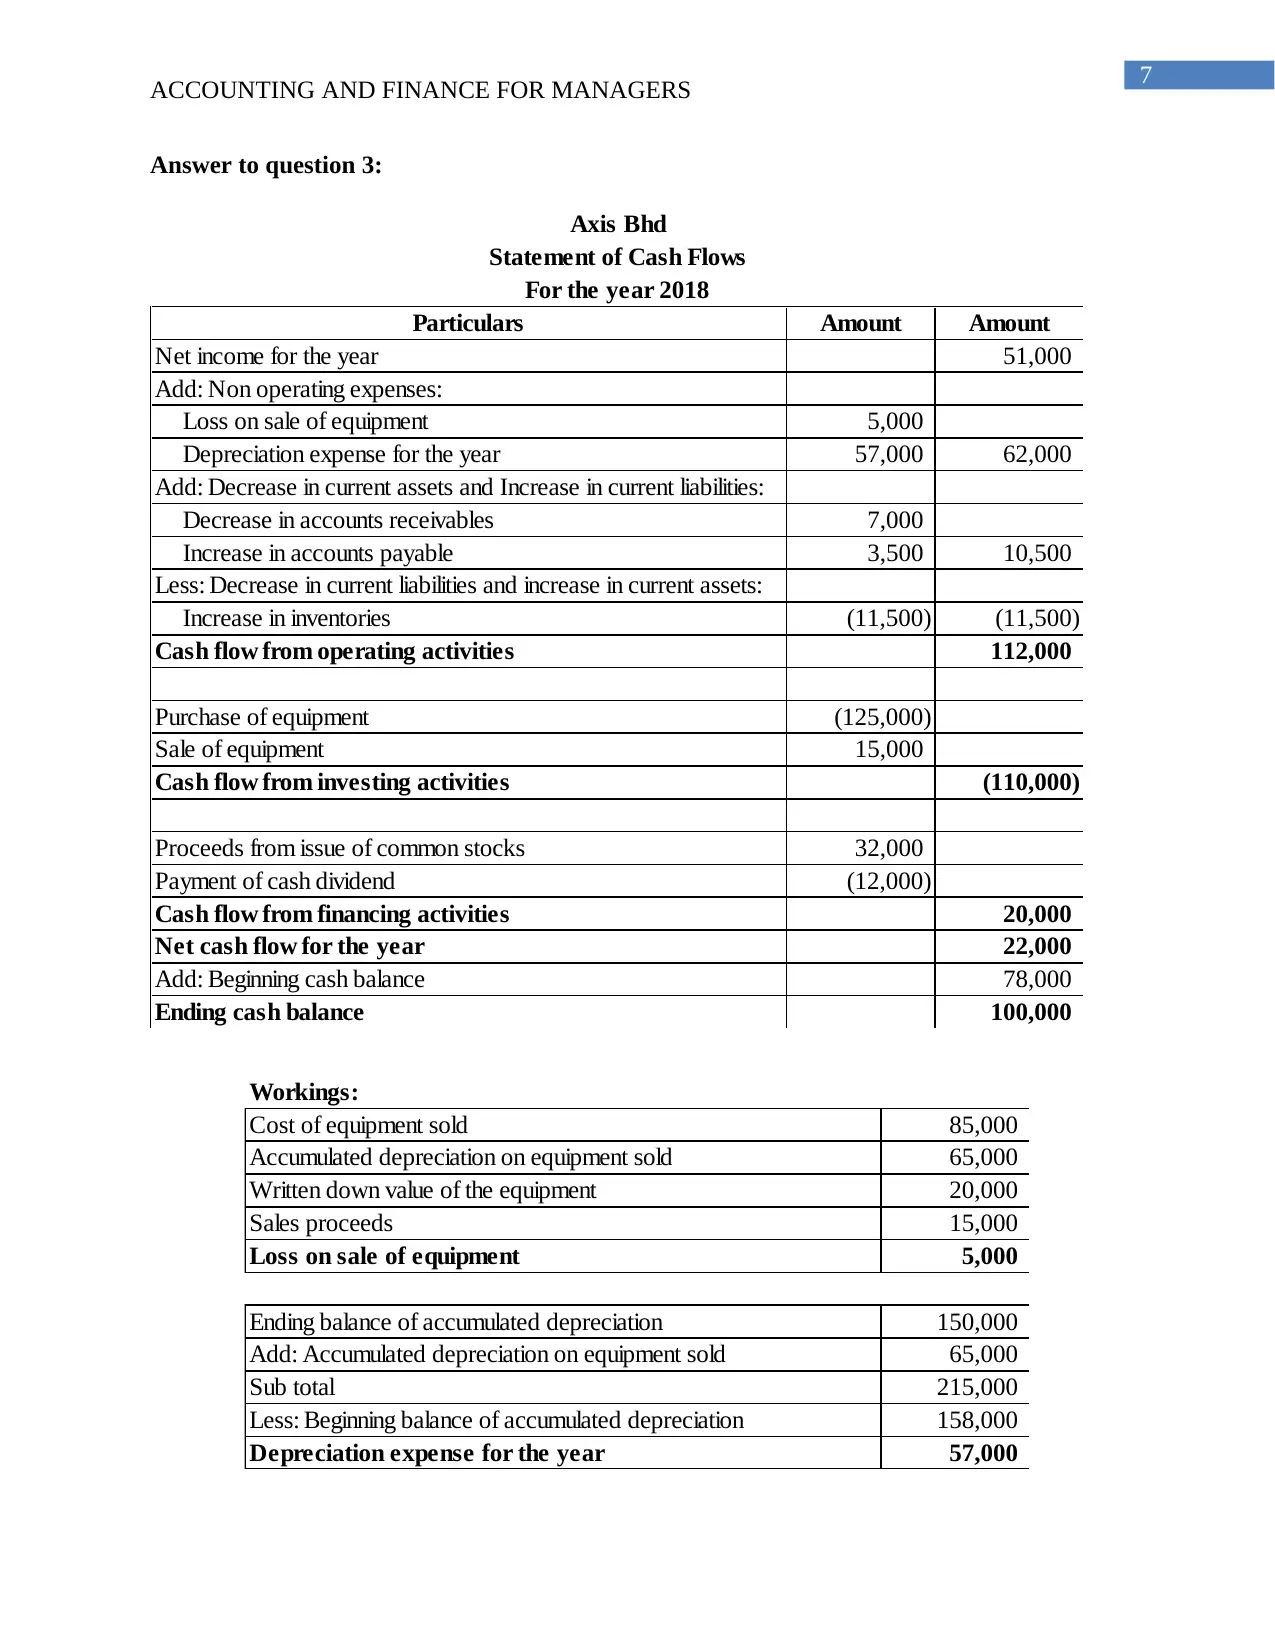
Answer to question 3:
Particulars Amount Amount
Net income for the year 51,000
Add: Non operating expenses:
Loss on sale of equipment 5,000
Depreciation expense for the year 57,000 62,000
Add: Decrease in current assets and Increase in current liabilities:
Decrease in accounts receivables 7,000
Increase in accounts payable 3,500 10,500
Less: Decrease in current liabilities and increase in current assets:
Increase in inventories (11,500) (11,500)
Cash flow from operating activities 112,000
Purchase of equipment (125,000)
Sale of equipment 15,000
Cash flow from investing activities (110,000)
Proceeds from issue of common stocks 32,000
Payment of cash dividend (12,000)
Cash flow from financing activities 20,000
Net cash flow for the year 22,000
Add: Beginning cash balance 78,000
Ending cash balance 100,000
Axis Bhd
Statement of Cash Flows
For the year 2018
Workings:
Cost of equipment sold 85,000
Accumulated depreciation on equipment sold 65,000
Written down value of the equipment 20,000
Sales proceeds 15,000
Loss on sale of equipment 5,000
Ending balance of accumulated depreciation 150,000
Add: Accumulated depreciation on equipment sold 65,000
Sub total 215,000
Less: Beginning balance of accumulated depreciation 158,000
Depreciation expense for the year 57,000
ACCOUNTING AND FINANCE FOR MANAGERS
Answer to question 3:
Particulars Amount Amount
Net income for the year 51,000
Add: Non operating expenses:
Loss on sale of equipment 5,000
Depreciation expense for the year 57,000 62,000
Add: Decrease in current assets and Increase in current liabilities:
Decrease in accounts receivables 7,000
Increase in accounts payable 3,500 10,500
Less: Decrease in current liabilities and increase in current assets:
Increase in inventories (11,500) (11,500)
Cash flow from operating activities 112,000
Purchase of equipment (125,000)
Sale of equipment 15,000
Cash flow from investing activities (110,000)
Proceeds from issue of common stocks 32,000
Payment of cash dividend (12,000)
Cash flow from financing activities 20,000
Net cash flow for the year 22,000
Add: Beginning cash balance 78,000
Ending cash balance 100,000
Axis Bhd
Statement of Cash Flows
For the year 2018
Workings:
Cost of equipment sold 85,000
Accumulated depreciation on equipment sold 65,000
Written down value of the equipment 20,000
Sales proceeds 15,000
Loss on sale of equipment 5,000
Ending balance of accumulated depreciation 150,000
Add: Accumulated depreciation on equipment sold 65,000
Sub total 215,000
Less: Beginning balance of accumulated depreciation 158,000
Depreciation expense for the year 57,000
8
ACCOUNTING AND FINANCE FOR MANAGERS
Answer to question 4:
Part a:
AB (RM):
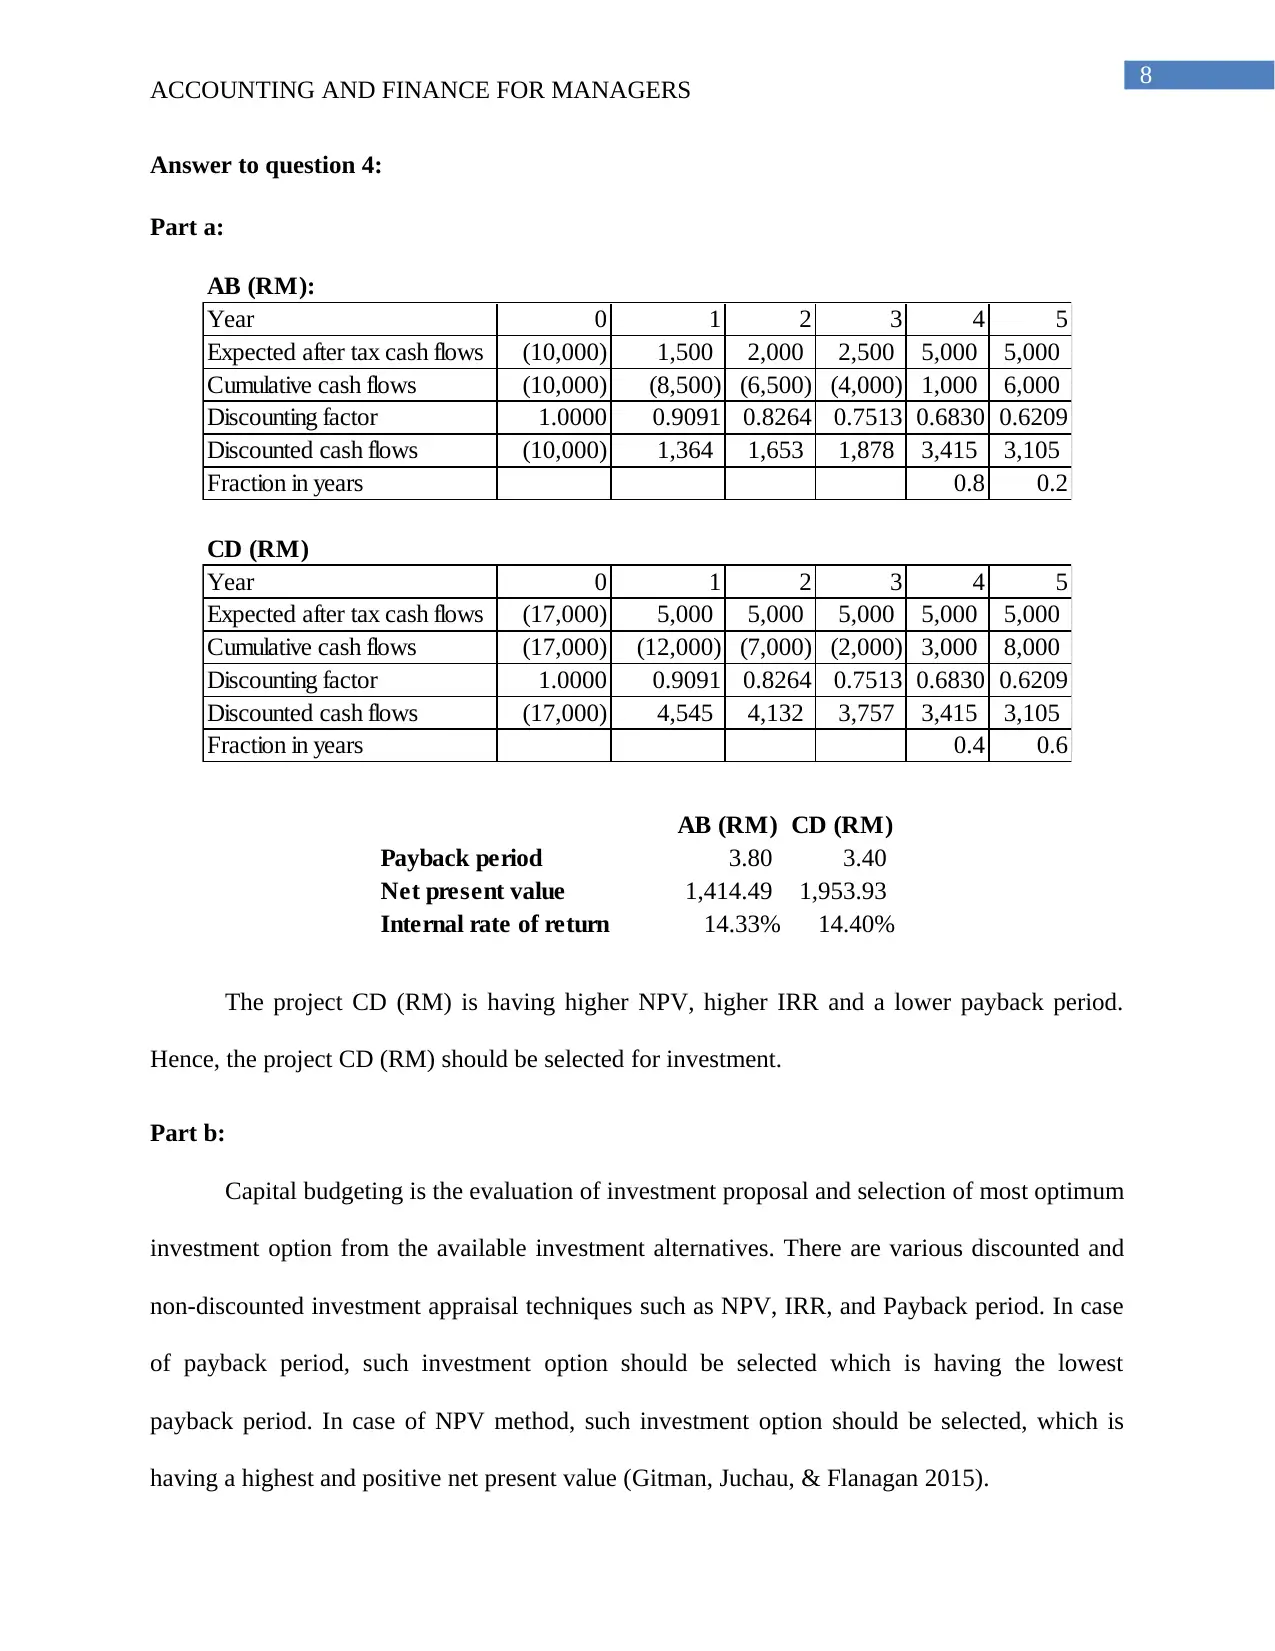
Year 0 1 2 3 4 5
Expected after tax cash flows (10,000) 1,500 2,000 2,500 5,000 5,000
Cumulative cash flows (10,000) (8,500) (6,500) (4,000) 1,000 6,000
Discounting factor 1.0000 0.9091 0.8264 0.7513 0.6830 0.6209
Discounted cash flows (10,000) 1,364 1,653 1,878 3,415 3,105
Fraction in years 0.8 0.2
CD (RM)
Year 0 1 2 3 4 5
Expected after tax cash flows (17,000) 5,000 5,000 5,000 5,000 5,000
Cumulative cash flows (17,000) (12,000) (7,000) (2,000) 3,000 8,000
Discounting factor 1.0000 0.9091 0.8264 0.7513 0.6830 0.6209
Discounted cash flows (17,000) 4,545 4,132 3,757 3,415 3,105
Fraction in years 0.4 0.6
AB (RM) CD (RM)
Payback period 3.80 3.40
Net present value 1,414.49 1,953.93
Internal rate of return 14.33% 14.40%
The project CD (RM) is having higher NPV, higher IRR and a lower payback period.
Hence, the project CD (RM) should be selected for investment.
Part b:
Capital budgeting is the evaluation of investment proposal and selection of most optimum
investment option from the available investment alternatives. There are various discounted and
non-discounted investment appraisal techniques such as NPV, IRR, and Payback period. In case
of payback period, such investment option should be selected which is having the lowest
payback period. In case of NPV method, such investment option should be selected, which is
having a highest and positive net present value (Gitman, Juchau, & Flanagan 2015).
ACCOUNTING AND FINANCE FOR MANAGERS
Answer to question 4:
Part a:
AB (RM):
Year 0 1 2 3 4 5
Expected after tax cash flows (10,000) 1,500 2,000 2,500 5,000 5,000
Cumulative cash flows (10,000) (8,500) (6,500) (4,000) 1,000 6,000
Discounting factor 1.0000 0.9091 0.8264 0.7513 0.6830 0.6209
Discounted cash flows (10,000) 1,364 1,653 1,878 3,415 3,105
Fraction in years 0.8 0.2
CD (RM)
Year 0 1 2 3 4 5
Expected after tax cash flows (17,000) 5,000 5,000 5,000 5,000 5,000
Cumulative cash flows (17,000) (12,000) (7,000) (2,000) 3,000 8,000
Discounting factor 1.0000 0.9091 0.8264 0.7513 0.6830 0.6209
Discounted cash flows (17,000) 4,545 4,132 3,757 3,415 3,105
Fraction in years 0.4 0.6
AB (RM) CD (RM)
Payback period 3.80 3.40
Net present value 1,414.49 1,953.93
Internal rate of return 14.33% 14.40%
The project CD (RM) is having higher NPV, higher IRR and a lower payback period.
Hence, the project CD (RM) should be selected for investment.
Part b:
Capital budgeting is the evaluation of investment proposal and selection of most optimum
investment option from the available investment alternatives. There are various discounted and
non-discounted investment appraisal techniques such as NPV, IRR, and Payback period. In case
of payback period, such investment option should be selected which is having the lowest
payback period. In case of NPV method, such investment option should be selected, which is
having a highest and positive net present value (Gitman, Juchau, & Flanagan 2015).
⊘ This is a preview!⊘
Do you want full access?
Subscribe today to unlock all pages.
Trusted by 1+ million students worldwide
9
ACCOUNTING AND FINANCE FOR MANAGERS
Answer to question 5:
Part a:
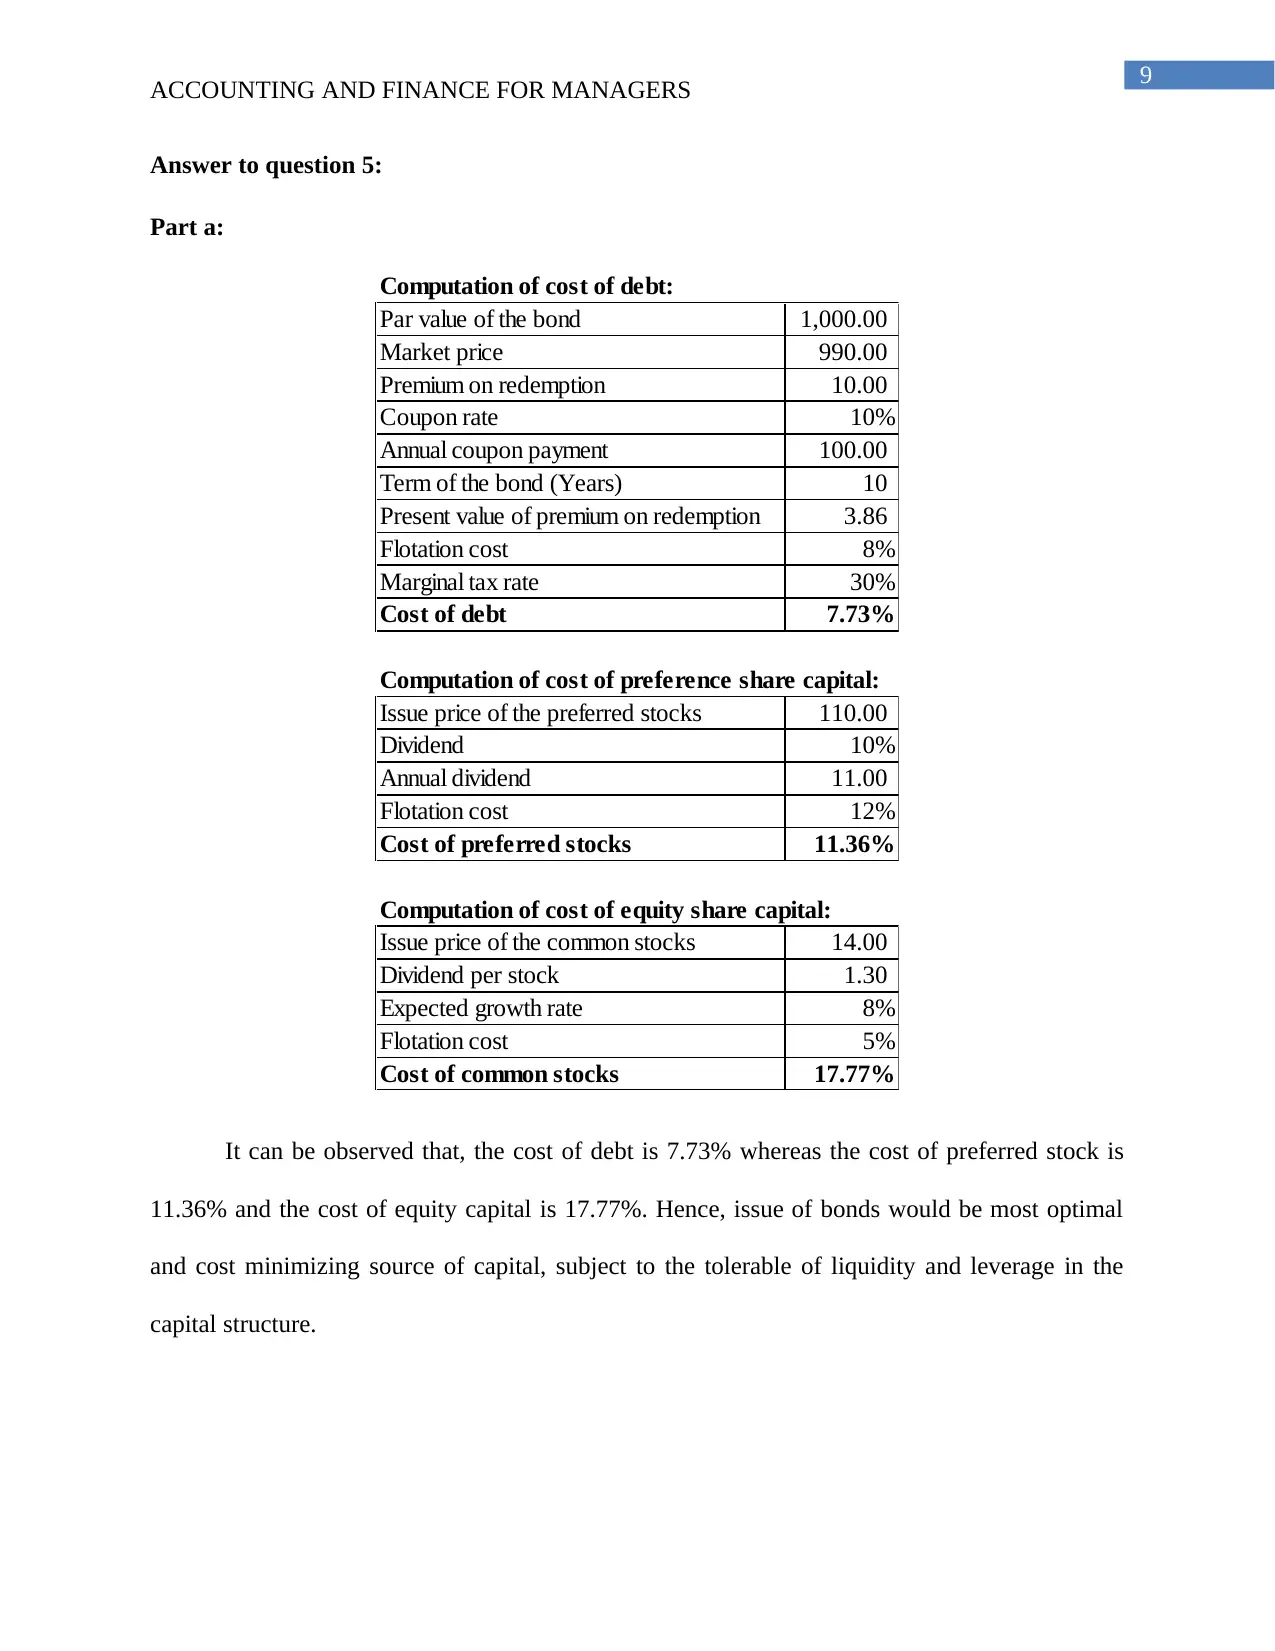
Computation of cost of debt:
Par value of the bond 1,000.00
Market price 990.00
Premium on redemption 10.00
Coupon rate 10%
Annual coupon payment 100.00
Term of the bond (Years) 10
Present value of premium on redemption 3.86
Flotation cost 8%
Marginal tax rate 30%
Cost of debt 7.73%
Computation of cost of preference share capital:
Issue price of the preferred stocks 110.00
Dividend 10%
Annual dividend 11.00
Flotation cost 12%
Cost of preferred stocks 11.36%
Computation of cost of equity share capital:
Issue price of the common stocks 14.00
Dividend per stock 1.30
Expected growth rate 8%
Flotation cost 5%
Cost of common stocks 17.77%
It can be observed that, the cost of debt is 7.73% whereas the cost of preferred stock is
11.36% and the cost of equity capital is 17.77%. Hence, issue of bonds would be most optimal
and cost minimizing source of capital, subject to the tolerable of liquidity and leverage in the
capital structure.
ACCOUNTING AND FINANCE FOR MANAGERS
Answer to question 5:
Part a:
Computation of cost of debt:
Par value of the bond 1,000.00
Market price 990.00
Premium on redemption 10.00
Coupon rate 10%
Annual coupon payment 100.00
Term of the bond (Years) 10
Present value of premium on redemption 3.86
Flotation cost 8%
Marginal tax rate 30%
Cost of debt 7.73%
Computation of cost of preference share capital:
Issue price of the preferred stocks 110.00
Dividend 10%
Annual dividend 11.00
Flotation cost 12%
Cost of preferred stocks 11.36%
Computation of cost of equity share capital:
Issue price of the common stocks 14.00
Dividend per stock 1.30
Expected growth rate 8%
Flotation cost 5%
Cost of common stocks 17.77%
It can be observed that, the cost of debt is 7.73% whereas the cost of preferred stock is
11.36% and the cost of equity capital is 17.77%. Hence, issue of bonds would be most optimal
and cost minimizing source of capital, subject to the tolerable of liquidity and leverage in the
capital structure.
Paraphrase This Document
Need a fresh take? Get an instant paraphrase of this document with our AI Paraphraser
10
ACCOUNTING AND FINANCE FOR MANAGERS
Part b:
Cash management or cash flow management is a key responsibility of the financial
managers. To manage cash flows, they should ensure the timely collection of receivables and
credit policies. On the other hand, they need to ensure cost efficient short term financing to
manage the cash flow problems (Fields 2016).
Answer to question 6:
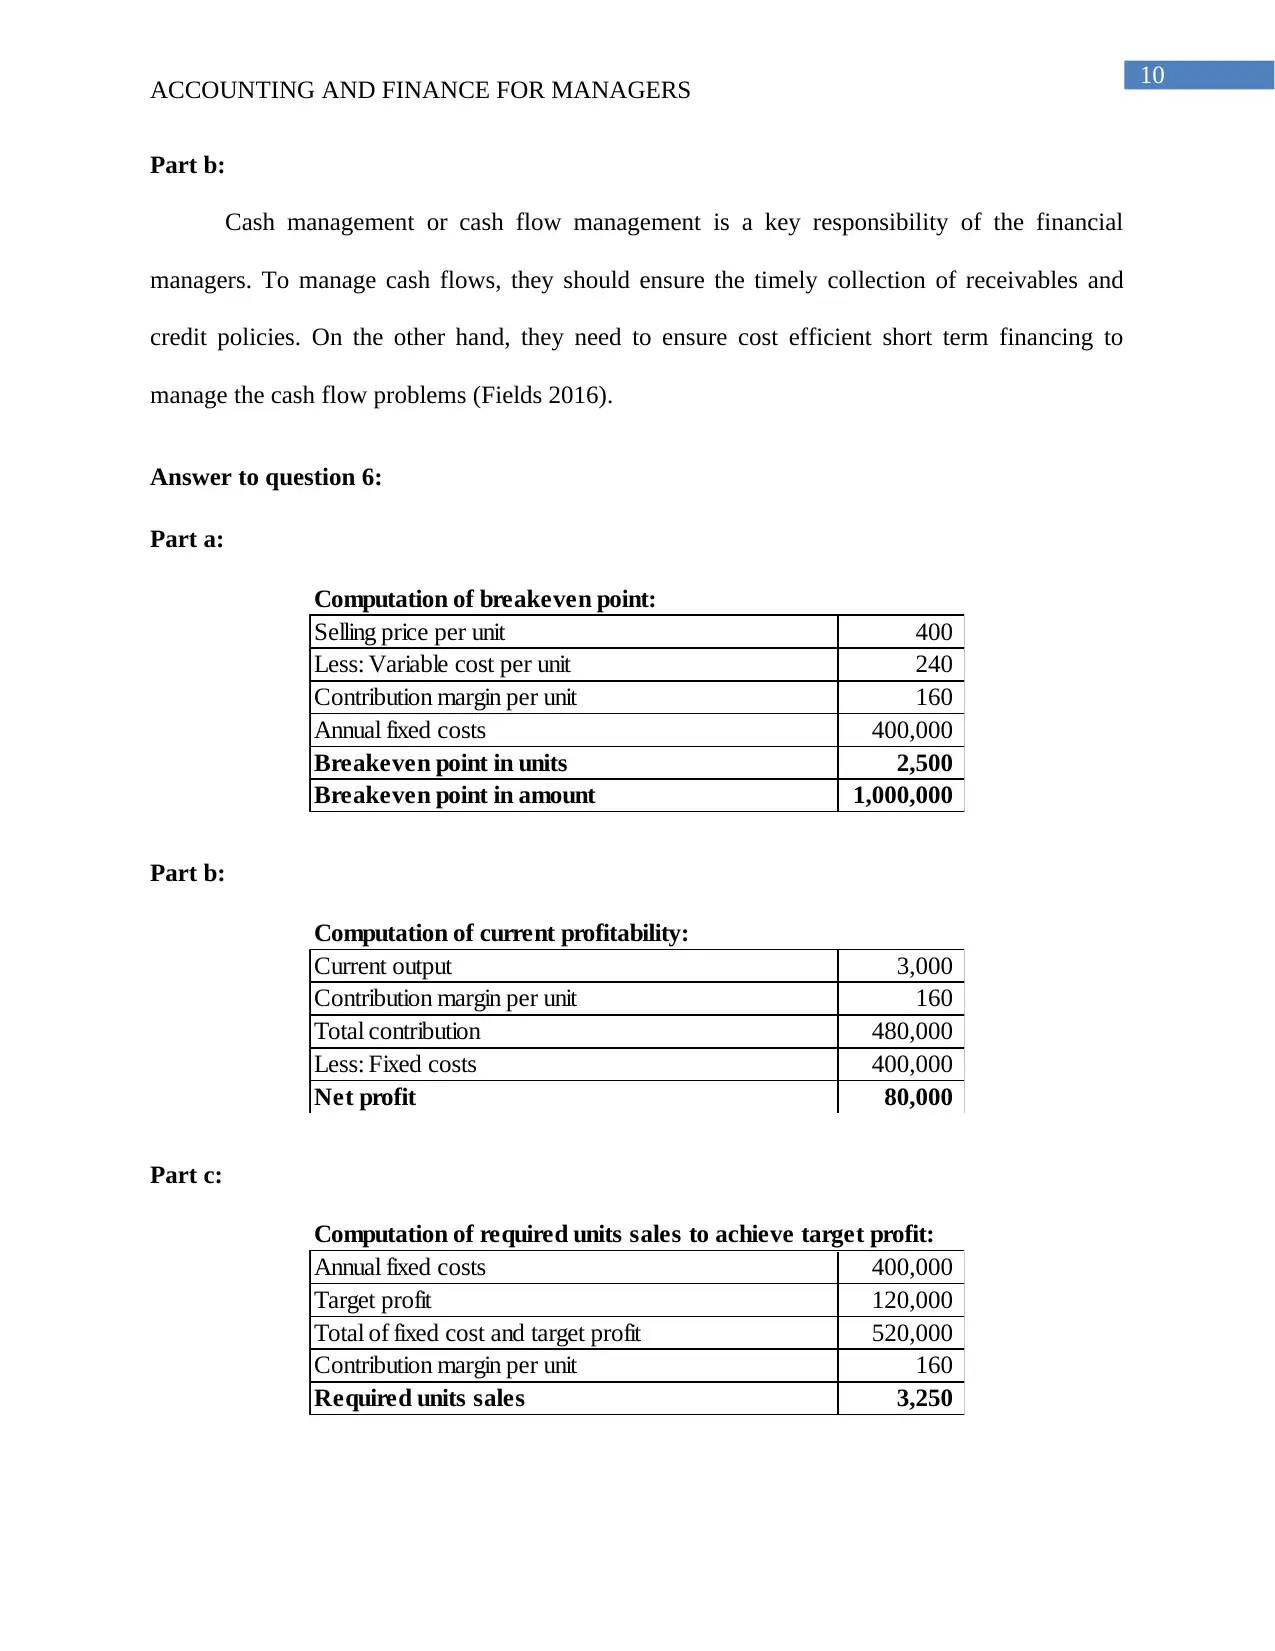
Part a:
Computation of breakeven point:
Selling price per unit 400
Less: Variable cost per unit 240
Contribution margin per unit 160
Annual fixed costs 400,000
Breakeven point in units 2,500
Breakeven point in amount 1,000,000
Part b:
Computation of current profitability:
Current output 3,000
Contribution margin per unit 160
Total contribution 480,000
Less: Fixed costs 400,000
Net profit 80,000
Part c:
Computation of required units sales to achieve target profit:
Annual fixed costs 400,000
Target profit 120,000
Total of fixed cost and target profit 520,000
Contribution margin per unit 160
Required units sales 3,250
ACCOUNTING AND FINANCE FOR MANAGERS
Part b:
Cash management or cash flow management is a key responsibility of the financial
managers. To manage cash flows, they should ensure the timely collection of receivables and
credit policies. On the other hand, they need to ensure cost efficient short term financing to
manage the cash flow problems (Fields 2016).
Answer to question 6:
Part a:
Computation of breakeven point:
Selling price per unit 400
Less: Variable cost per unit 240
Contribution margin per unit 160
Annual fixed costs 400,000
Breakeven point in units 2,500
Breakeven point in amount 1,000,000
Part b:
Computation of current profitability:
Current output 3,000
Contribution margin per unit 160
Total contribution 480,000
Less: Fixed costs 400,000
Net profit 80,000
Part c:
Computation of required units sales to achieve target profit:
Annual fixed costs 400,000
Target profit 120,000
Total of fixed cost and target profit 520,000
Contribution margin per unit 160
Required units sales 3,250
11
ACCOUNTING AND FINANCE FOR MANAGERS
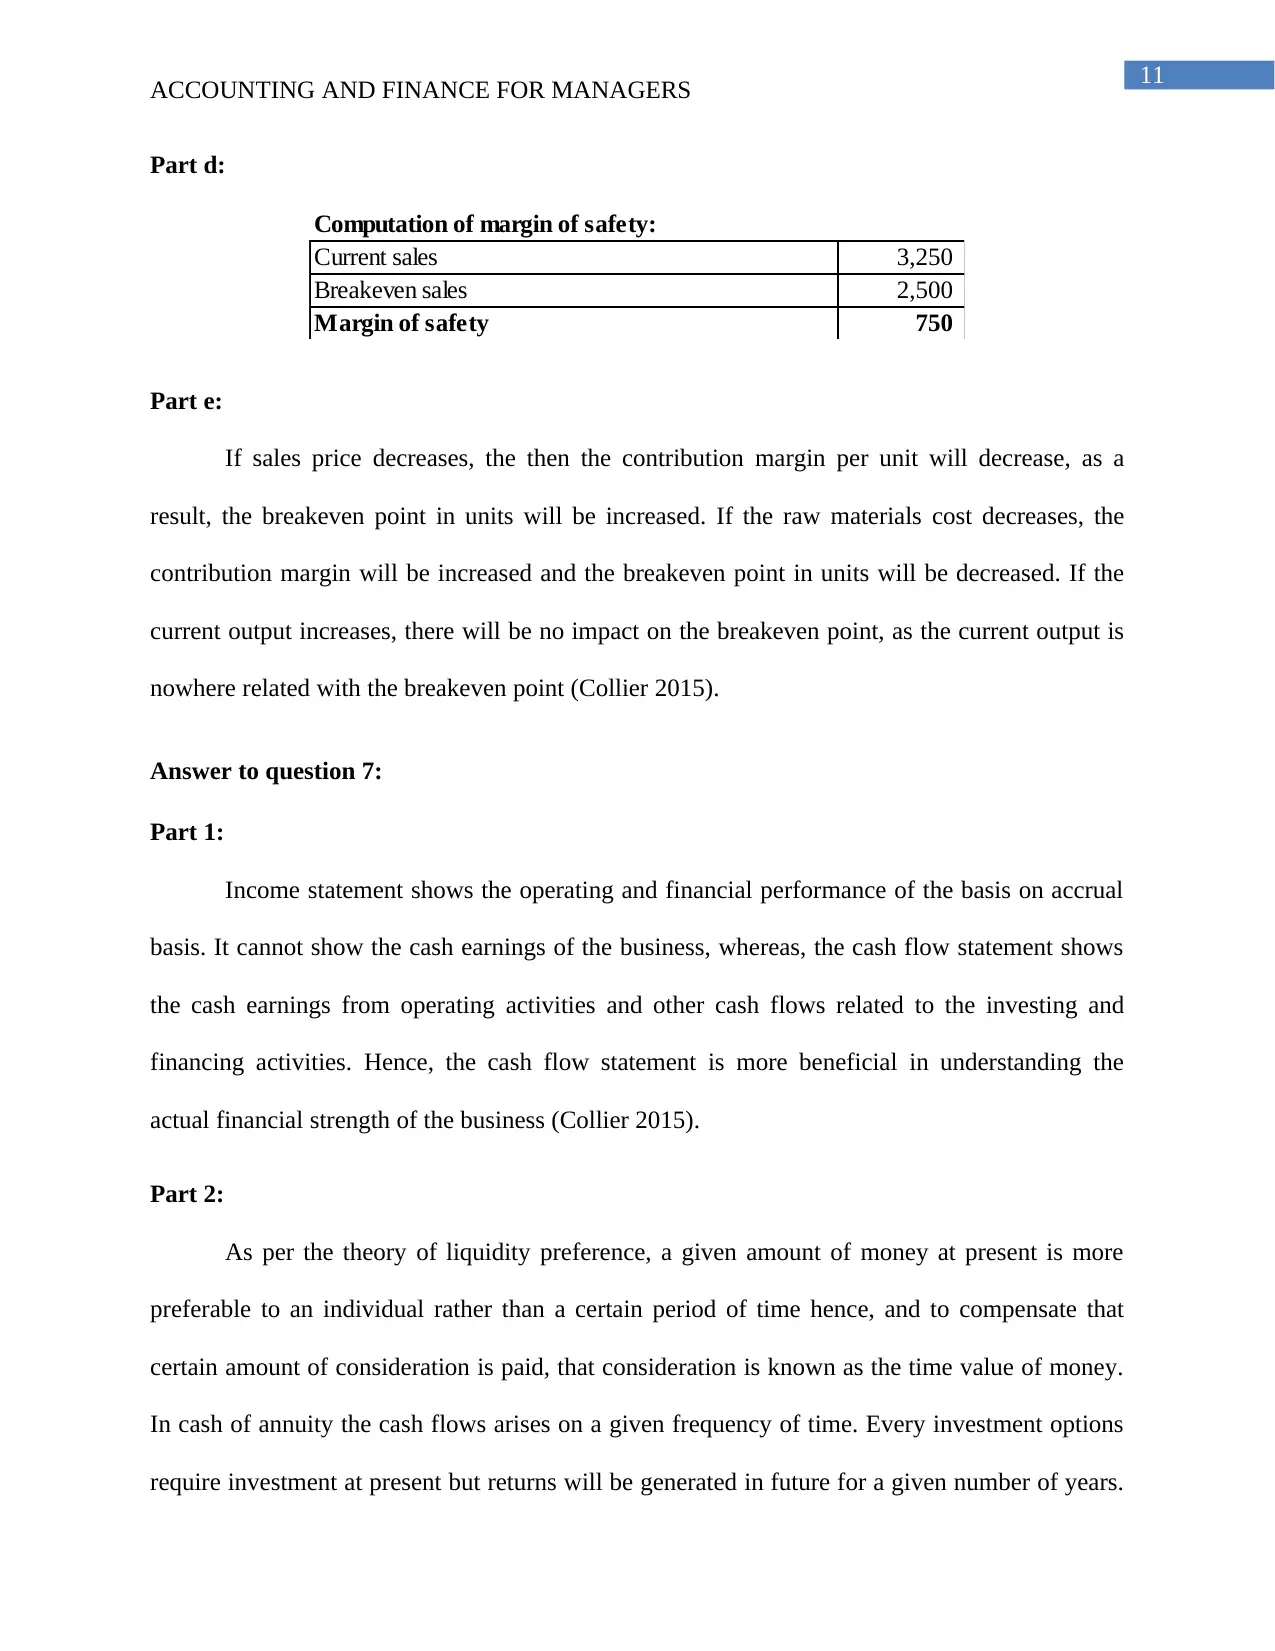
Part d:
Computation of margin of safety:
Current sales 3,250
Breakeven sales 2,500
Margin of safety 750
Part e:
If sales price decreases, the then the contribution margin per unit will decrease, as a
result, the breakeven point in units will be increased. If the raw materials cost decreases, the
contribution margin will be increased and the breakeven point in units will be decreased. If the
current output increases, there will be no impact on the breakeven point, as the current output is
nowhere related with the breakeven point (Collier 2015).
Answer to question 7:
Part 1:
Income statement shows the operating and financial performance of the basis on accrual
basis. It cannot show the cash earnings of the business, whereas, the cash flow statement shows
the cash earnings from operating activities and other cash flows related to the investing and
financing activities. Hence, the cash flow statement is more beneficial in understanding the
actual financial strength of the business (Collier 2015).
Part 2:
As per the theory of liquidity preference, a given amount of money at present is more
preferable to an individual rather than a certain period of time hence, and to compensate that
certain amount of consideration is paid, that consideration is known as the time value of money.
In cash of annuity the cash flows arises on a given frequency of time. Every investment options
require investment at present but returns will be generated in future for a given number of years.
ACCOUNTING AND FINANCE FOR MANAGERS
Part d:
Computation of margin of safety:
Current sales 3,250
Breakeven sales 2,500
Margin of safety 750
Part e:
If sales price decreases, the then the contribution margin per unit will decrease, as a
result, the breakeven point in units will be increased. If the raw materials cost decreases, the
contribution margin will be increased and the breakeven point in units will be decreased. If the
current output increases, there will be no impact on the breakeven point, as the current output is
nowhere related with the breakeven point (Collier 2015).
Answer to question 7:
Part 1:
Income statement shows the operating and financial performance of the basis on accrual
basis. It cannot show the cash earnings of the business, whereas, the cash flow statement shows
the cash earnings from operating activities and other cash flows related to the investing and
financing activities. Hence, the cash flow statement is more beneficial in understanding the
actual financial strength of the business (Collier 2015).
Part 2:
As per the theory of liquidity preference, a given amount of money at present is more
preferable to an individual rather than a certain period of time hence, and to compensate that
certain amount of consideration is paid, that consideration is known as the time value of money.
In cash of annuity the cash flows arises on a given frequency of time. Every investment options
require investment at present but returns will be generated in future for a given number of years.
⊘ This is a preview!⊘
Do you want full access?
Subscribe today to unlock all pages.
Trusted by 1+ million students worldwide
1 out of 14
Related Documents


Your All-in-One AI-Powered Toolkit for Academic Success.
+13062052269
info@desklib.com
Available 24*7 on WhatsApp / Email
![[object Object]](/_next/static/media/star-bottom.7253800d.svg)
Unlock your academic potential
Copyright © 2020–2026 A2Z Services. All Rights Reserved. Developed and managed by ZUCOL.