ACC91210 Finance for Managers: Investment Risk & Return Case Study

Verified

Added on  2023/04/04

|6
|1178
|391
Case Study
AI Summary
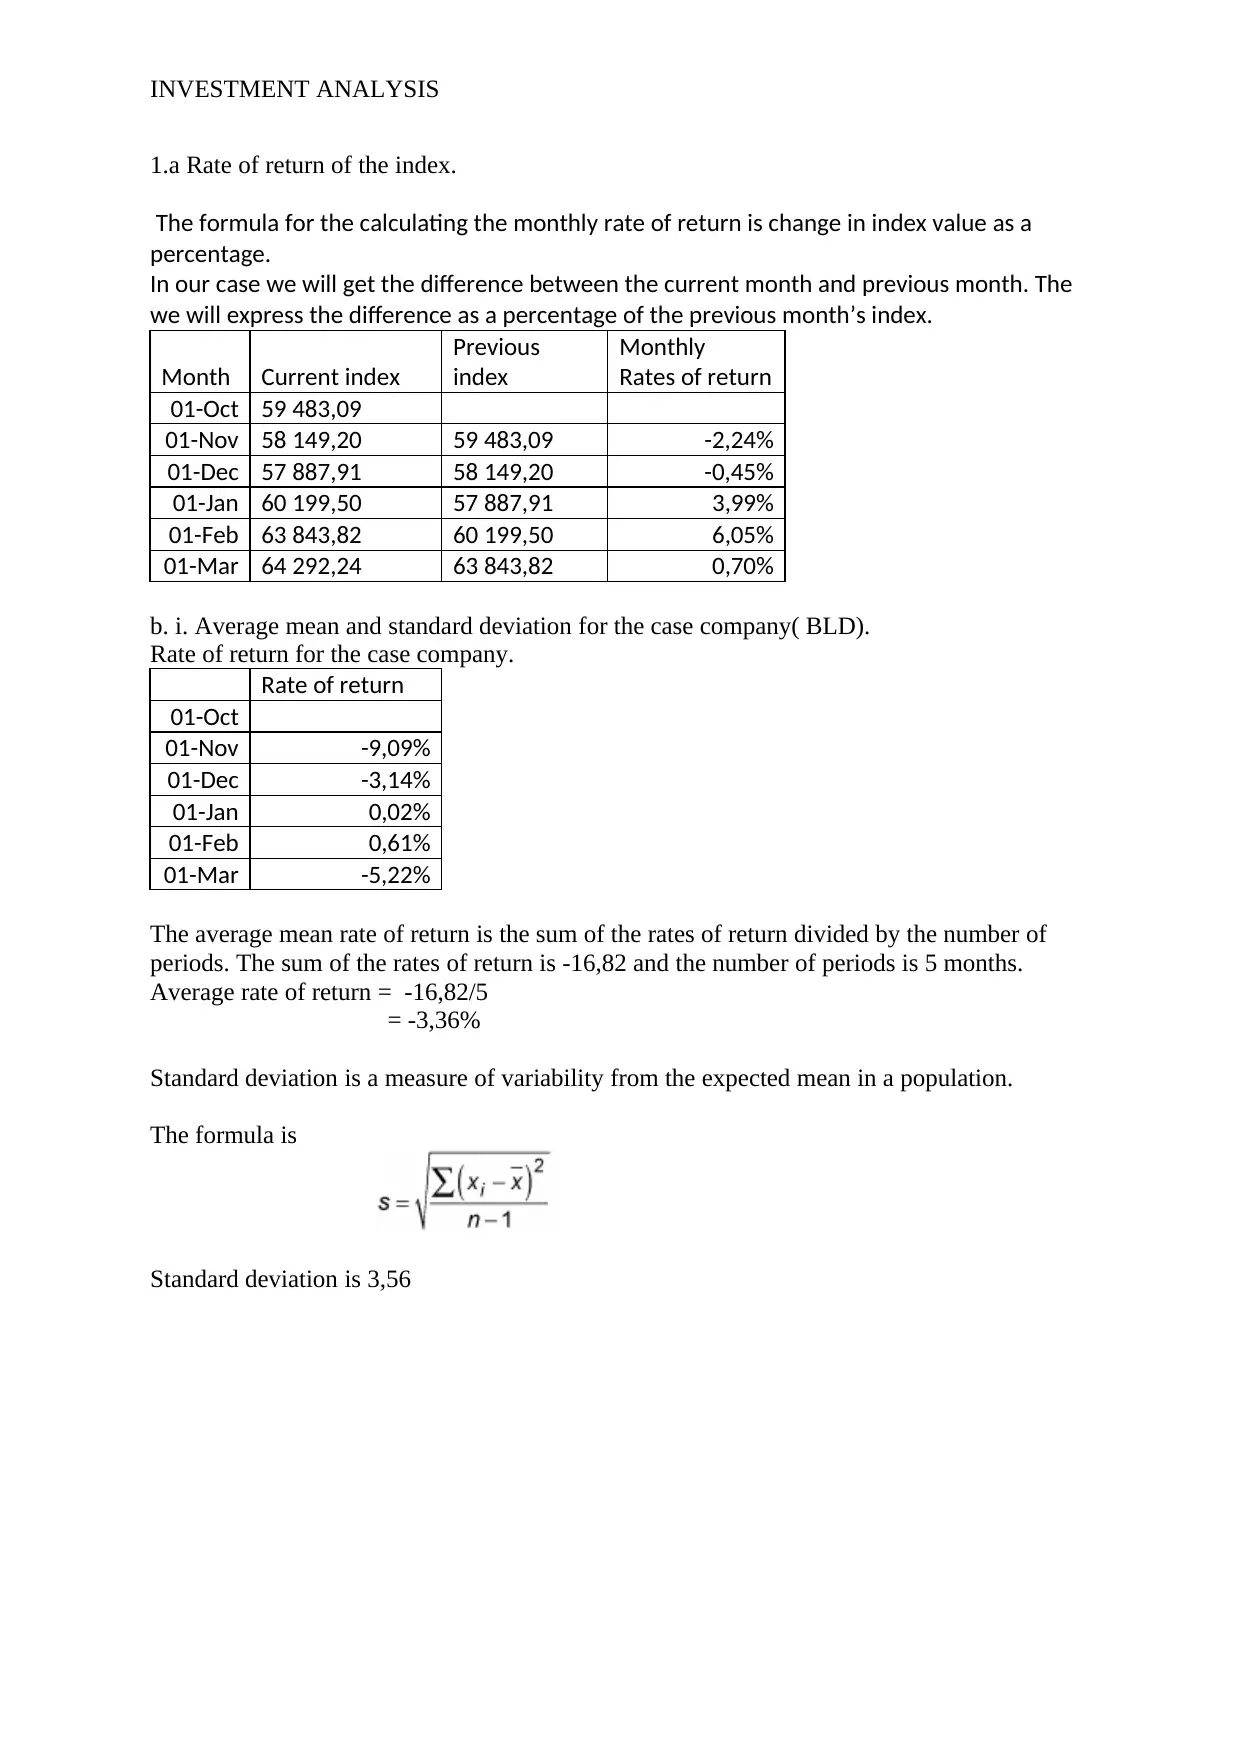
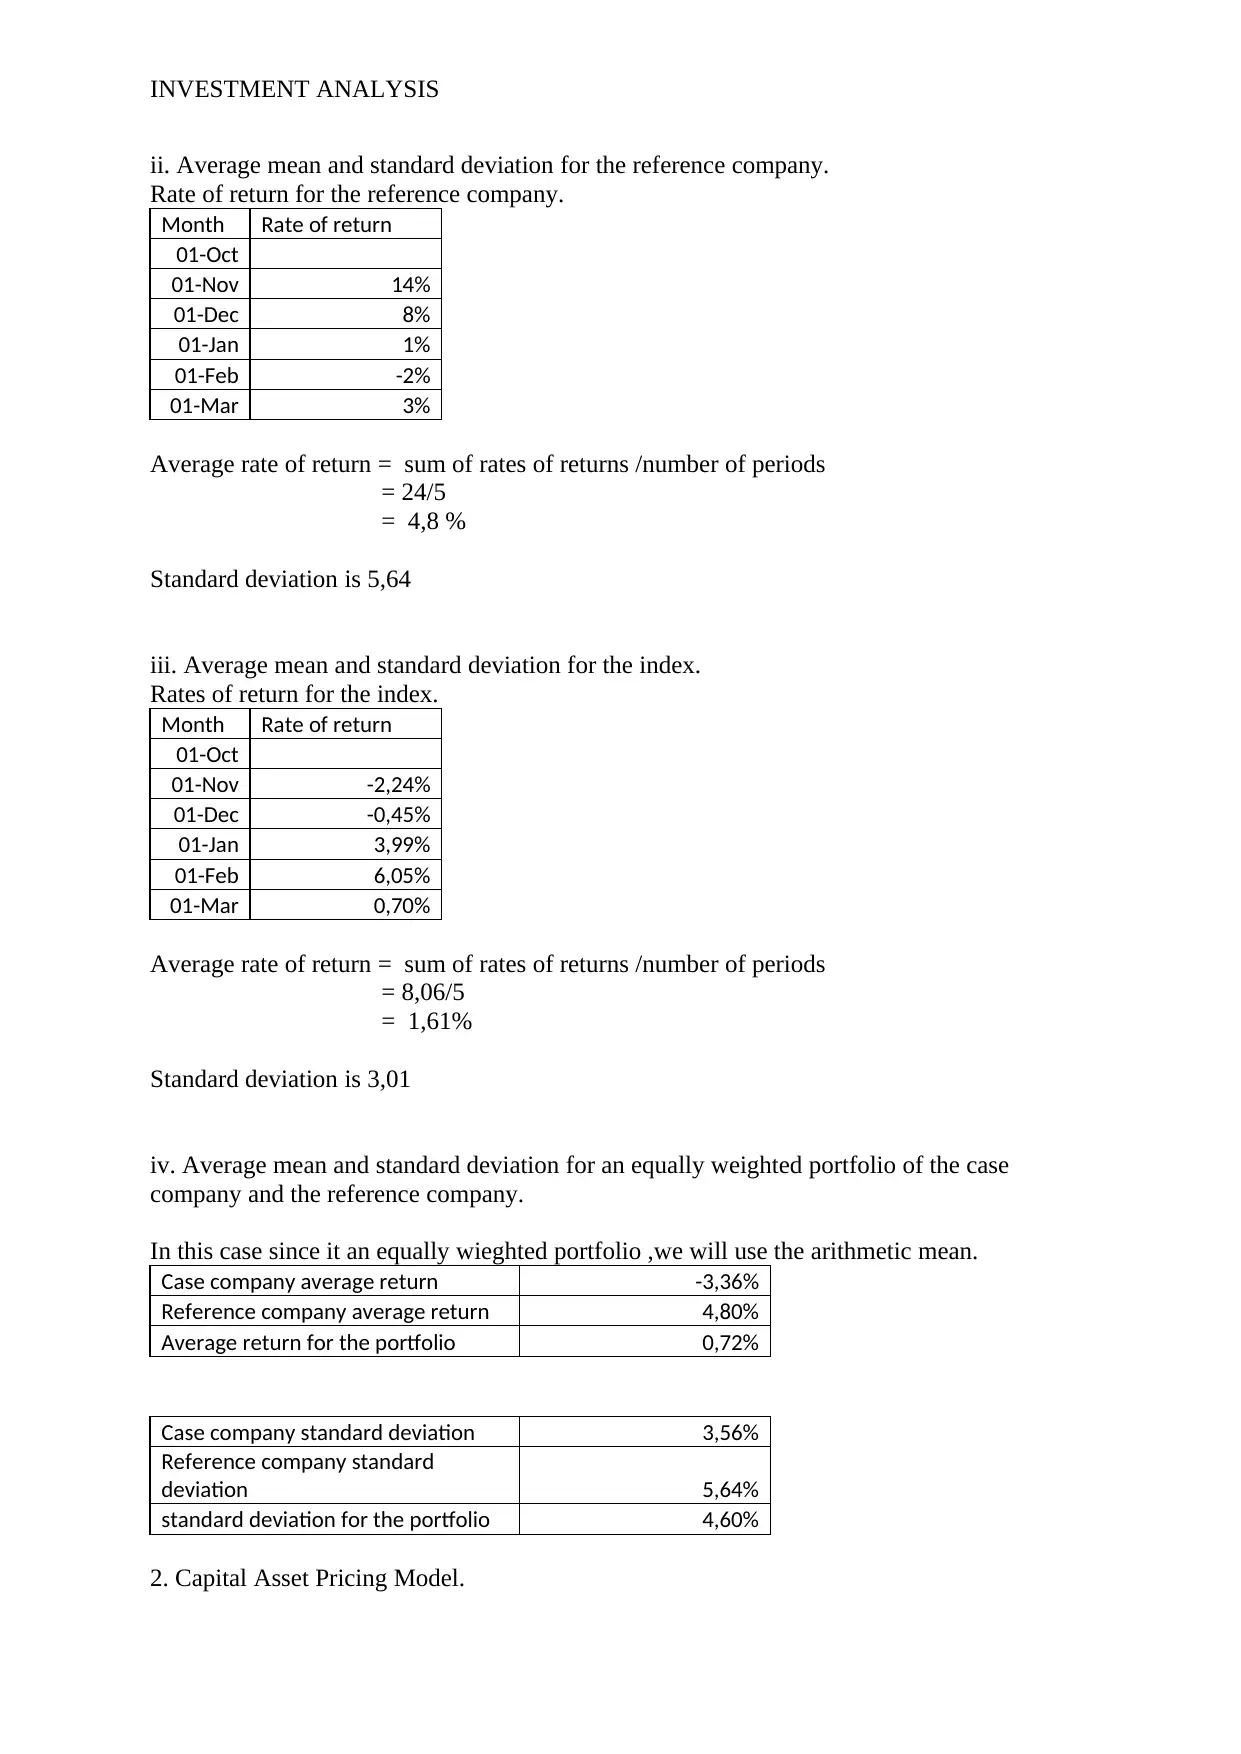
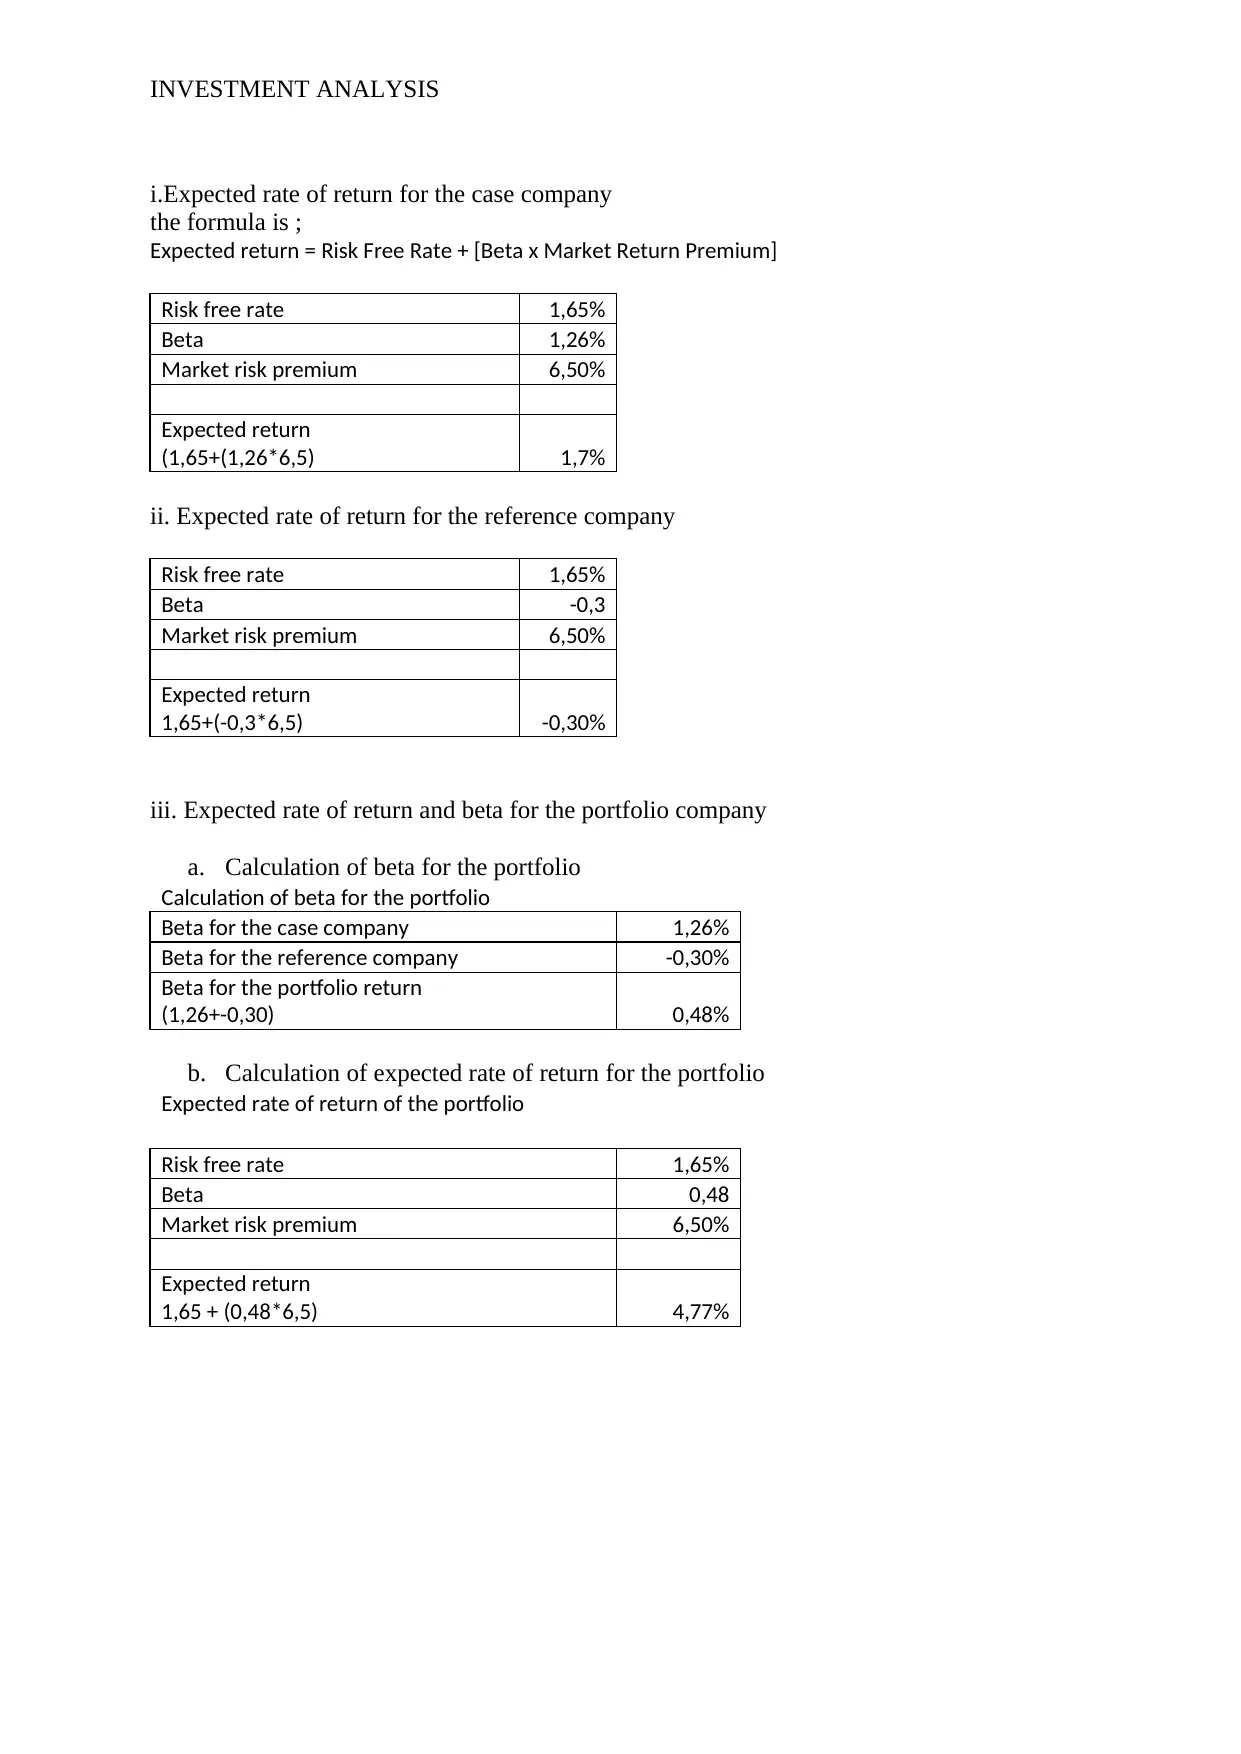
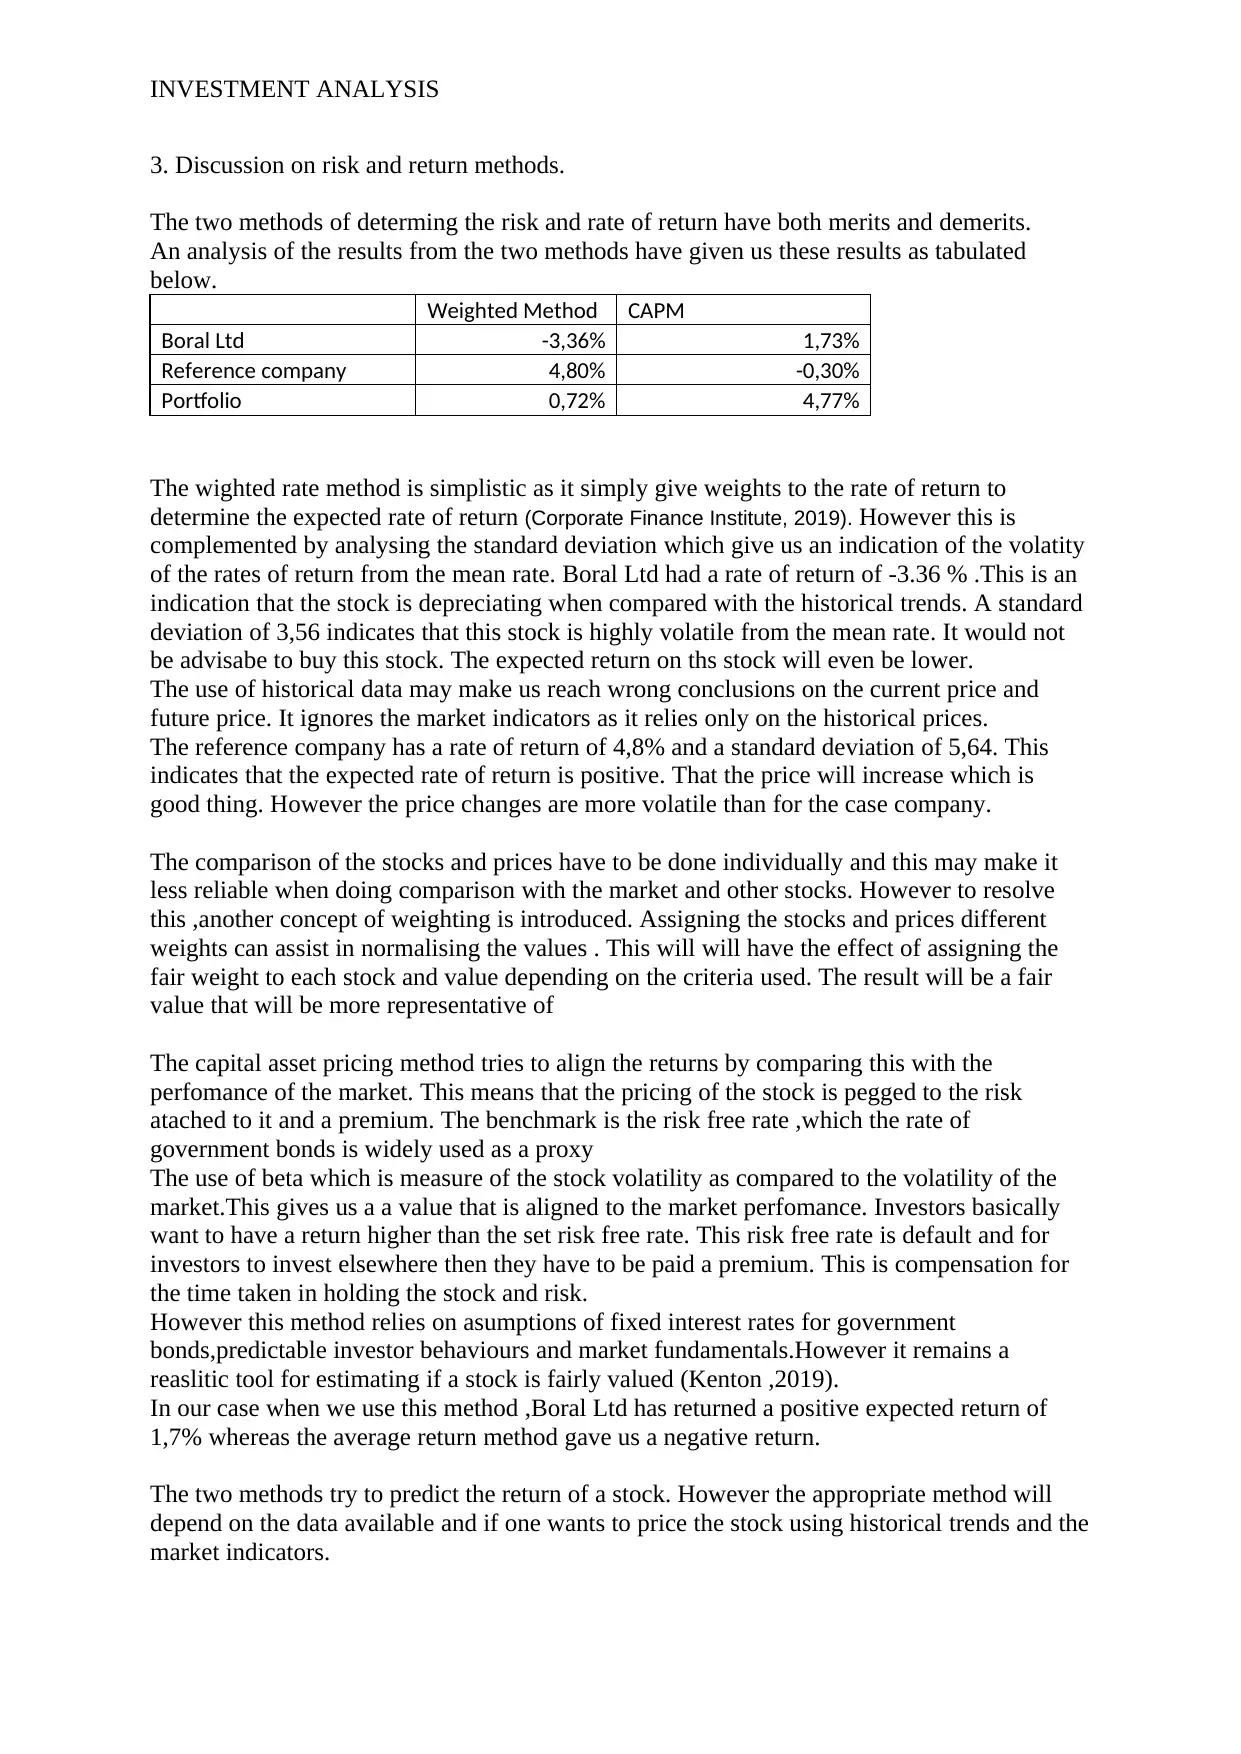
This case study provides an investment analysis of a case company (Boral Ltd) and a reference company, employing both weighted rate and Capital Asset Pricing Model (CAPM) methods to determine risk and expected rates of return. The analysis involves calculating monthly rates of return, average mean rates, and standard deviations for each company and a weighted portfolio. The CAPM is used to calculate expected rates of return based on risk-free rates, beta, and market risk premium. The study discusses the merits and demerits of both methods, highlighting that the weighted rate method is simplistic, while CAPM relies on assumptions of fixed interest rates and predictable market behavior. The results from both methods are compared, and the study concludes that the appropriate method depends on the available data and whether one wants to price the stock using historical trends or market indicators. Desklib provides access to similar solved assignments and resources for students.
tabler-icon-diamond-filled.svg

Contribute Materials

Your contribution can guide someone’s learning journey. Share your documents today.
Document Page
INVESTMENT ANALYSIS
INVESTMENT ANALYSIS
NAME OF STUDENT
NAME OF UNIVERSITY
tabler-icon-diamond-filled.svg

Secure Best Marks with AI Grader

Need help grading? Try our AI Grader for instant feedback on your assignments.
Document Page
INVESTMENT ANALYSIS
1.a Rate of return of the index.
The formula for the calculating the monthly rate of return is change in index value as a
percentage.
In our case we will get the difference between the current month and previous month. The
we will express the difference as a percentage of the previous month’s index.
Month Current index
Previous
index
Monthly
Rates of return
01-Oct 59 483,09
01-Nov 58 149,20 59 483,09 -2,24%
01-Dec 57 887,91 58 149,20 -0,45%
01-Jan 60 199,50 57 887,91 3,99%
01-Feb 63 843,82 60 199,50 6,05%
01-Mar 64 292,24 63 843,82 0,70%
b. i. Average mean and standard deviation for the case company( BLD).
Rate of return for the case company.
Rate of return
01-Oct
01-Nov -9,09%
01-Dec -3,14%
01-Jan 0,02%
01-Feb 0,61%
01-Mar -5,22%
The average mean rate of return is the sum of the rates of return divided by the number of
periods. The sum of the rates of return is -16,82 and the number of periods is 5 months.
Average rate of return = -16,82/5
= -3,36%
Standard deviation is a measure of variability from the expected mean in a population.
The formula is
Standard deviation is 3,56
Document Page
INVESTMENT ANALYSIS
ii. Average mean and standard deviation for the reference company.
Rate of return for the reference company.
Month Rate of return
01-Oct
01-Nov 14%
01-Dec 8%
01-Jan 1%
01-Feb -2%
01-Mar 3%
Average rate of return = sum of rates of returns /number of periods
= 24/5
= 4,8 %
Standard deviation is 5,64
iii. Average mean and standard deviation for the index.
Rates of return for the index.
Month Rate of return
01-Oct
01-Nov -2,24%
01-Dec -0,45%
01-Jan 3,99%
01-Feb 6,05%
01-Mar 0,70%
Average rate of return = sum of rates of returns /number of periods
= 8,06/5
= 1,61%
Standard deviation is 3,01
iv. Average mean and standard deviation for an equally weighted portfolio of the case
company and the reference company.
In this case since it an equally wieghted portfolio ,we will use the arithmetic mean.
Case company average return -3,36%
Reference company average return 4,80%
Average return for the portfolio 0,72%
Case company standard deviation 3,56%
Reference company standard
deviation 5,64%
standard deviation for the portfolio 4,60%
2. Capital Asset Pricing Model.
Document Page
INVESTMENT ANALYSIS
i.Expected rate of return for the case company
the formula is ;
Expected return = Risk Free Rate + [Beta x Market Return Premium]
Risk free rate 1,65%
Beta 1,26%
Market risk premium 6,50%
Expected return
(1,65+(1,26*6,5) 1,7%
ii. Expected rate of return for the reference company
Risk free rate 1,65%
Beta -0,3
Market risk premium 6,50%
Expected return
1,65+(-0,3*6,5) -0,30%
iii. Expected rate of return and beta for the portfolio company
a. Calculation of beta for the portfolio
Calculation of beta for the portfolio
Beta for the case company 1,26%
Beta for the reference company -0,30%
Beta for the portfolio return
(1,26+-0,30) 0,48%
b. Calculation of expected rate of return for the portfolio
Expected rate of return of the portfolio
Risk free rate 1,65%
Beta 0,48
Market risk premium 6,50%
Expected return
1,65 + (0,48*6,5) 4,77%
tabler-icon-diamond-filled.svg

Secure Best Marks with AI Grader

Need help grading? Try our AI Grader for instant feedback on your assignments.
Document Page
INVESTMENT ANALYSIS
3. Discussion on risk and return methods.
The two methods of determing the risk and rate of return have both merits and demerits.
An analysis of the results from the two methods have given us these results as tabulated
below.
Weighted Method CAPM
Boral Ltd -3,36% 1,73%
Reference company 4,80% -0,30%
Portfolio 0,72% 4,77%
The wighted rate method is simplistic as it simply give weights to the rate of return to
determine the expected rate of return (Corporate Finance Institute, 2019). However this is
complemented by analysing the standard deviation which give us an indication of the volatity
of the rates of return from the mean rate. Boral Ltd had a rate of return of -3.36 % .This is an
indication that the stock is depreciating when compared with the historical trends. A standard
deviation of 3,56 indicates that this stock is highly volatile from the mean rate. It would not
be advisabe to buy this stock. The expected return on ths stock will even be lower.
The use of historical data may make us reach wrong conclusions on the current price and
future price. It ignores the market indicators as it relies only on the historical prices.
The reference company has a rate of return of 4,8% and a standard deviation of 5,64. This
indicates that the expected rate of return is positive. That the price will increase which is
good thing. However the price changes are more volatile than for the case company.
The comparison of the stocks and prices have to be done individually and this may make it
less reliable when doing comparison with the market and other stocks. However to resolve
this ,another concept of weighting is introduced. Assigning the stocks and prices different
weights can assist in normalising the values . This will will have the effect of assigning the
fair weight to each stock and value depending on the criteria used. The result will be a fair
value that will be more representative of
The capital asset pricing method tries to align the returns by comparing this with the
perfomance of the market. This means that the pricing of the stock is pegged to the risk
atached to it and a premium. The benchmark is the risk free rate ,which the rate of
government bonds is widely used as a proxy
The use of beta which is measure of the stock volatility as compared to the volatility of the
market.This gives us a a value that is aligned to the market perfomance. Investors basically
want to have a return higher than the set risk free rate. This risk free rate is default and for
investors to invest elsewhere then they have to be paid a premium. This is compensation for
the time taken in holding the stock and risk.
However this method relies on asumptions of fixed interest rates for government
bonds,predictable investor behaviours and market fundamentals.However it remains a
reaslitic tool for estimating if a stock is fairly valued (Kenton ,2019).
In our case when we use this method ,Boral Ltd has returned a positive expected return of
1,7% whereas the average return method gave us a negative return.
The two methods try to predict the return of a stock. However the appropriate method will
depend on the data available and if one wants to price the stock using historical trends and the
market indicators.
Document Page
INVESTMENT ANALYSIS
References.
countryeconomy.com. (2019). Australia - 10-Year Government Bond Yield 2019. [online] Available at:
https://countryeconomy.com/bonds/australia [Accessed 25 May 2019].
Corporate Finance Institute. (2019). Expected Return - How to Calculate a Portfolio's Expected
Return. [online] Available at: https://corporatefinanceinstitute.com/resources/knowledge/trading-
investing/expected-return/ [Accessed 25 May 2019].
Courses.lumenlearning.com. (2019). Implications Across Portfolios | Boundless Finance. [online]
Available at: https://courses.lumenlearning.com/boundless-finance/chapter/implications-across-
portfolios/ [Accessed 25 May 2019].
KENTON, W. (2019). Capital Asset Pricing Model (CAPM). [online] Investopedia. Available at:
https://www.investopedia.com/terms/c/capm.asp [Accessed 25 May 2019].
U.S. (2019). ${Instrument_CompanyName} ${Instrument_Ric} Quote| Reuters.com. [online] Available
at: https://www.reuters.com/finance/stocks/overview/BLD.AX [Accessed 25 May 2019].
chevron_up_icon
1 out of 6
circle_padding
hide_on_mobile
zoom_out_icon
logo.png

Your All-in-One AI-Powered Toolkit for Academic Success.

Available 24*7 on WhatsApp / Email

[object Object]