Finance for Managers: Analyzing Safa Motors Investment Decisions
VerifiedAdded on 2020/12/09
|14
|4121
|494
Report
AI Summary
This report provides a detailed financial analysis of Safa Motors Ltd., a UK-based subsidiary of a car manufacturing organization, focusing on a replacement decision involving a shift from petrol and diesel vehicles to electric vehicles. The report begins with an analysis of relevant and irrelevant costs, including research costs, and forecasts annual net cash flows and profits for the next five years for both petrol/diesel and electric car products. It then delves into CVP analysis, break-even points, and margin of safety calculations, followed by an evaluation of capital investment appraisal techniques such as payback period, ARR, and NPV. The report also includes NPV sensitivity analysis using zero NPV techniques and discusses the strengths and weaknesses of various financial techniques like CVP analysis, payback period, NPV, and cash flow analysis. Finally, it examines the non-financial factors, such as climate issues and staff motivation, that can impact investment decisions. The report utilizes appendices to present detailed calculations and forecasts, offering a comprehensive overview of the financial implications of Safa Motors' investment strategy. This assignment is published on Desklib, a platform for AI-based study tools.

FINANCE FOR MANAGERS
Paraphrase This Document
Need a fresh take? Get an instant paraphrase of this document with our AI Paraphraser
Table of Contents
INTRODUCTION...........................................................................................................................1
TASK...............................................................................................................................................1
1. Financial analysis and interpretation.......................................................................................1
2. Strength and weakness of the different financial techniques..................................................7
3. The non financial factors may impact this investment decisions............................................8
CONCLUSION................................................................................................................................8
REFERENCES................................................................................................................................9
INTRODUCTION
Finance for managers considered as an accounting techniques for managers in terms of
making the monetary related plans and structure. It is important for managers to manage the
financial resources as per their requirement and controlling the cost, payroll, mergers and
investments (Yinzhi, 2013). There is case study of Safa motors Ltd which is a subsidiary of car
manufacturing organisation in UK is analysing in this report. Financial analysis and
interpretation of investment plans, CVP analysis, break even analysis, investment appraisal
techniques, discounted cash flow and forecasted cash flow defined in this context. Strength and
weakness of the different financial techniques and non financial factors which impact investment
decisions discussed in this report.
TASK
1. Financial analysis and interpretation
a) Relevant and Irrelevant cost associated with the replacement decision
Safa motors Ltd is one of the multinational automotive manufacturer subsidiary in the
UK. It produces passenger cars and handling 1100 people. Organisation is associated with the
skilled immigrant labour form Eastern Europe to deduce the cost. Company is seeking to an
replacement decision of switching form producing petrol and diesel vehicles to manufacturing
electric vehicle form 2019. there was a research carried out in split parts half between the diesel
and petrol which contains the cost of £250000. it is seen that 68% people are eager to buy petrol
products and 21% people wants to stay with diesel cars and rest 2% people are thinking of
buying electric car.
Relevant cost: it is a cost which is a part of management accounting, which indicates
towards the incremental and avoidable cost while decision making process (Yin, 2016). Relevant
aspect which remain associated with management decisions and business operations are
considered in this cost. How much cash is required to utilise and implement in operations and
management are considered in relevant cost. There are type of relevant cost exist in management
accounting as future cash flows, avoidable cost, opportunity cost and incremental cost. As per
above case study of Safa Motors Ltd the cost of research is £250000 which is considered as a
relevant cost.
1
⊘ This is a preview!⊘
Do you want full access?
Subscribe today to unlock all pages.
Trusted by 1+ million students worldwide
Irrelevant cost: it is the cost which do not change this is also one of the cost concept
remains ineffective in terms of management decisions due to lack of relevance aspects. The
balance of these cost can be positive and negative which maybe relevant for certain situation.
There are type of irrelevant cost are found in organisational context such as Sunk cost,
committees cost, non cash cash expenses and the general overheads.
b) Forecasted annual net cash flows and profits for the next 5 years
Forecasted annual net cash flow: this refer to the difference between an association's
cash inflows and outflows for a specific dime period. The variation in terms of cash inflows and
cash outflows are considered in this forecasted annual cash flow. Forecasted annual net cash
flow is prepared on the basis of assumptions and projection (Sharma and Paul, 2015). There are
major three activities considered in this approach through which an organisation can generate the
cash flow which are cash flow form operating activities, cash flow from financing activities and
cash flow form investing activities. Cash flow form all three activities are consolidated to get net
cash inflow or outflow.
NOTE: Cash flow for both the products are shown below in Appendix 1.
Forecasted annual net profit: An average cumulative net profit for the specific time
duration. All the expenses and income are compensated with each other to identify the profit and
loss for the year.
c) Forecasted total cash flow and total profit for the year
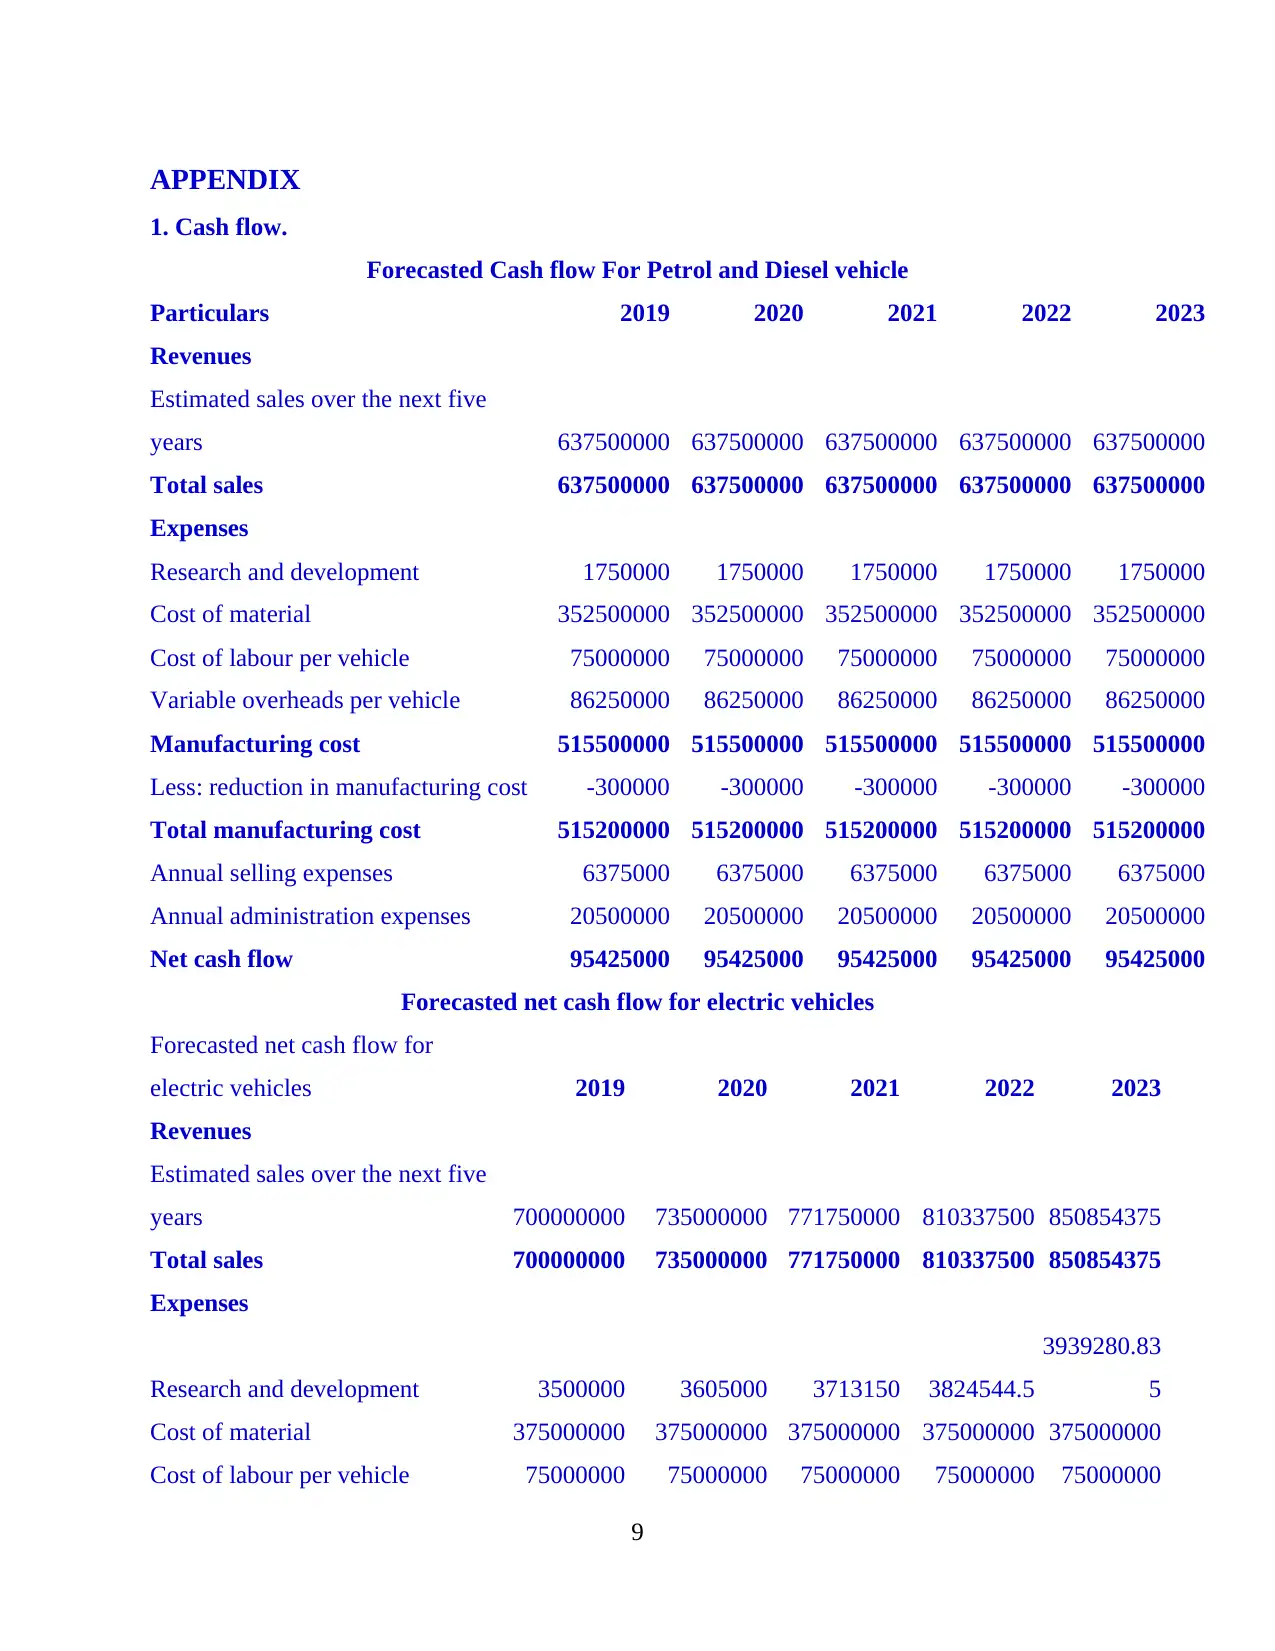
Total cash flow: As per above case scenario, forecasted cash flow is prepared in respect
of respect of replacement decision. Forecasted cash flow of petrol and diesel car for subsiding
five years are counted as £95425000 for the year 2019 and same the remaining five years
because there was no any increase and decrease recorded for upcoming five years.
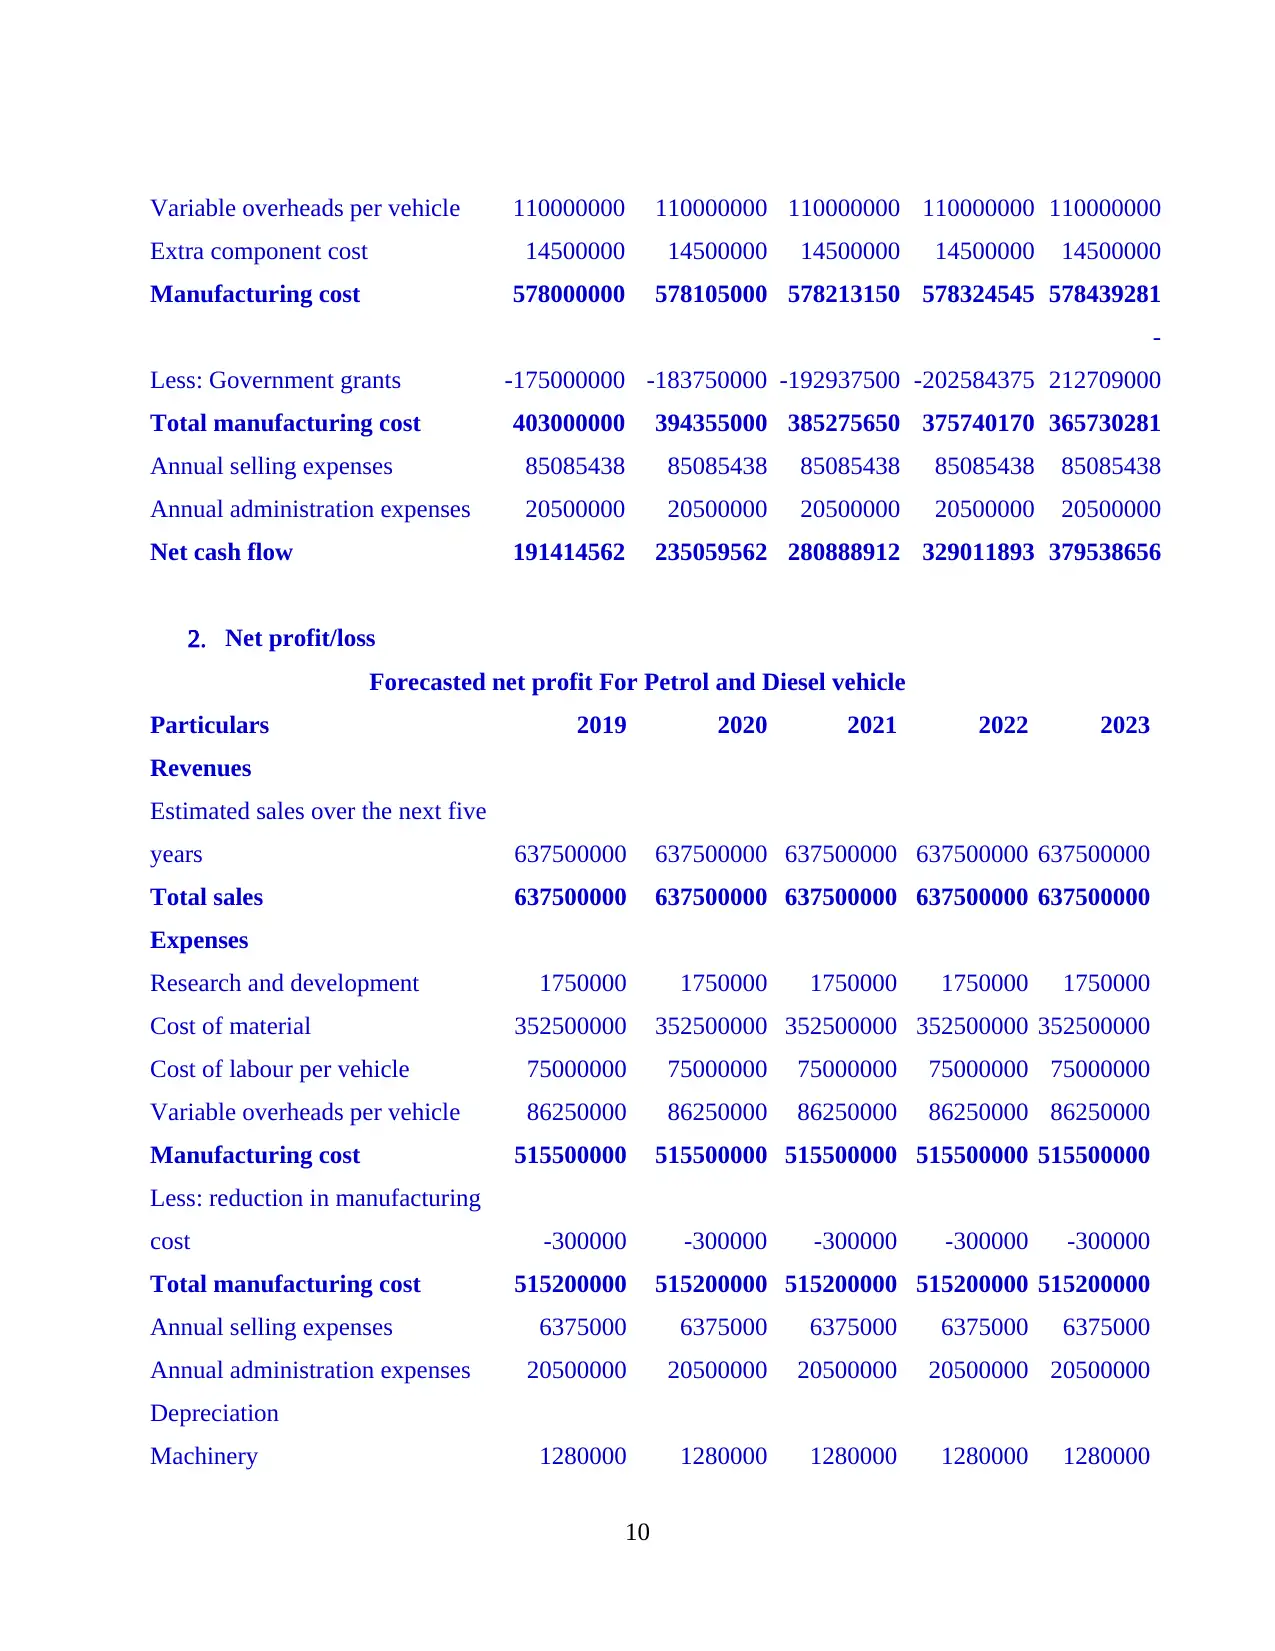
Forecasted cash flow statement in respect of electric car products shows following results
as £191414562 for the year 2019, £235059562 for the year 2020, £280888912 for the year 2021,
£329011893 for the year 2022 and £379538656 for the year 2023.
Total profit: the forecasted total net profit for Petrol and diesel car products is 94145000
the five year and the forecasted profit for electric car products present following results as
£189574562 for the year 2019, £233219562 for the year 2020, £279048912 for the year 2021,
£327171893 for the year 2022 and £37769856 for the year 2023.
NOTE: Forecasted profit and loss account for both the products are shown in appendix 2
2
remains ineffective in terms of management decisions due to lack of relevance aspects. The
balance of these cost can be positive and negative which maybe relevant for certain situation.
There are type of irrelevant cost are found in organisational context such as Sunk cost,
committees cost, non cash cash expenses and the general overheads.
b) Forecasted annual net cash flows and profits for the next 5 years
Forecasted annual net cash flow: this refer to the difference between an association's
cash inflows and outflows for a specific dime period. The variation in terms of cash inflows and
cash outflows are considered in this forecasted annual cash flow. Forecasted annual net cash
flow is prepared on the basis of assumptions and projection (Sharma and Paul, 2015). There are
major three activities considered in this approach through which an organisation can generate the
cash flow which are cash flow form operating activities, cash flow from financing activities and
cash flow form investing activities. Cash flow form all three activities are consolidated to get net
cash inflow or outflow.
NOTE: Cash flow for both the products are shown below in Appendix 1.
Forecasted annual net profit: An average cumulative net profit for the specific time
duration. All the expenses and income are compensated with each other to identify the profit and
loss for the year.
c) Forecasted total cash flow and total profit for the year
Total cash flow: As per above case scenario, forecasted cash flow is prepared in respect
of respect of replacement decision. Forecasted cash flow of petrol and diesel car for subsiding
five years are counted as £95425000 for the year 2019 and same the remaining five years
because there was no any increase and decrease recorded for upcoming five years.
Forecasted cash flow statement in respect of electric car products shows following results
as £191414562 for the year 2019, £235059562 for the year 2020, £280888912 for the year 2021,
£329011893 for the year 2022 and £379538656 for the year 2023.
Total profit: the forecasted total net profit for Petrol and diesel car products is 94145000
the five year and the forecasted profit for electric car products present following results as
£189574562 for the year 2019, £233219562 for the year 2020, £279048912 for the year 2021,
£327171893 for the year 2022 and £37769856 for the year 2023.
NOTE: Forecasted profit and loss account for both the products are shown in appendix 2
2
Paraphrase This Document
Need a fresh take? Get an instant paraphrase of this document with our AI Paraphraser
d) CVP analysis and the break even point and the margin of safety
C-V-P analysis: it stands for cost volume and profit which is mainly used to determine
how changes in cost and volume effect the operating profit and net profit. This mainly associated
with enhancing the performance graph of organisation by appropriate utilisation of cost and
analysing the required sales units (Philippon and Reshef, 2012).
Break even analysis: BEP analysis is a graphical approach which define a point at which
organisations profit remain equal to its cost. This approach also remains beneficial from decision
making perspective (Ozo and et. al. 2015). Break even point is calculated in two ways as
BEP in sales units = Fixed cost / contribution per unit
BEP in sale price = Fixed cost / profit volume ratio
Profit volume ratio = (Contribution / sales) * 100
NOTE: Calculation for break even refers appendix 3.
Margin of safety: In financial accounting, the difference between the actual sales and
break even sales is known as margin of safety (Fan, Wei and Xu, 2011). This is considered as a
level at which minimum quantity of stock is retained by organisation in the duration of shortage
of raw stock and inventories. It is calculated by following formula as
Margin of sales = Actual sales -Break even sales
There is a margin of safety sales is calculated as follows
Margin of safety sales of Petrol and Diesel cars = (637500000 – 112210200)= £525289800
Margin of safety sales of electric car = (700000000 – 111700000) = £588300000
e) Capital investment appraisal analysis, payback period, ARR, Net present value
Investment appraisal basically part of capital budgeting. Investment appraisal techniques
are the tools which are used in management decisions and decision making (Coles, Lemmon and
Meschke, 2012). Managers use types of investment appraisal techniques to evaluate the
effectiveness of investment and replacement plans. These techniques are helpful in terms of
determining best and effective investment plans for better growth and development of
organisation.
Payback period: this is one of the method used to analyse the sustainability of capital
projects in terms of deriving the functions of organisation towards sustainable growth of
organisation (Ding and Wermers, 2012). This technique defines the break even point of
recovering the cost of investment in upcoming years. This is calculated by adding the discounted
3
cash flow for upcoming years and the duration in which the cost of investment get recovered and
known as payback period.
ARR: it is considered as a rate of return which calculates the rate of return generated
form the net income of the proposed capital investment. Average rate of return is a formula used
to make capital cost expressed as an annual percentage. It is calculated by aggregating the net
profit and average investment.
Net present value: this is one of the common, simple and most approachable capital
investment appraisal technique used for analysing the stability and effectiveness of investment
plan. There are name suggested in this method which is mainly recognised with long term capital
projects (Baker and Wurgler, 2011). Cash flow approach is mainly used under this approach in
which effectiveness of capital projects are evaluated on the basis of discounted cash flow.
As per above analysis it is seen that the organisation is having a positive net present value
in terms of capital project proposed in respect of replacement decision. Net present value is
calculated as £215485775.50 for replacement project for petrol and diesel car projects. And the
internal rate of return is evaluated as 68.85%.
Net present value of capital project of electric care manufacturing is calculated as -
£206070355.07. the project shows negative results but the IRR present positive results in term of
expanding the business at next level.
NOTE: Calculations are show below in appendix 4
d) NPV sensitivity analysis by using Zero NPV techniques
Zero NPV: when the net cash inflows and outflows remain equal then it is evaluated on
the basis of Zero NPV (Baker, Singleton and Veit, 2011). This techniques will help to analyse
the effectiveness of capital projects which shows negative reports.
2. Strength and weakness of the different financial techniques
Financial techniques helps to sort the financial complications and problems and assist the
management and forecasting process of organisation. With the help of financial techniques, the
effectiveness and sustainable of capital projects become easy and convenient. This is mainly
assist the management and decision making process. Financial interpretation as financial ratios,
cash flows be able to summarised in more effective manner (Ang, Gregoriou and Lean, 2014).
4
⊘ This is a preview!⊘
Do you want full access?
Subscribe today to unlock all pages.
Trusted by 1+ million students worldwide
In organisation financial forecast and analysis is essential part for better execution of
financial resources. There are type of financial techniques are used to manage the financial
resources and tackle the financial challenges.
CVP analysis: It provide an overview and idea to managers that how much sales units to
be produced to compensate the cost of organisation. There is a use of CVP analysing the break
even point of petrol and diesel vehicles and electric vehicles analysed of Safa Limited.
Advantages:
this is one of the effective technique used to analyse the Cost Volume and profit point in
term of profitability and operating the business over the years. This one of the basic tool to explore the business and managing the business activities.
Disadvantages:
This mainly depends upon certain assumptions and classification of cost profit and sales
volume.
There is a forecasted information is presented which affect the decision-making process.
Payback period: this method is the method of analysing the capital expenditure projects.
Advantages:
this is one of the simplest method to evaluate the sustainability of investment plans. This helps to analyse the rate of recovering at faster rate.
Disadvantages:
Level of accuracy remain low in this method.
Current value of method remain unclear in this method
NPV: this presents the net present value by calculating the cumulative factor which is centralised
around making strong infrastructure.
Advantages:
This is simple method in various investment appraisal techniques there is a discounting factor which provides nearest results.
Disadvantages:
these techniques require high comprehensive skills to understand the critical aspects and
complications.
Risk free rate remain uncertain while calculating the effectiveness of finance projects.
5
Paraphrase This Document
Need a fresh take? Get an instant paraphrase of this document with our AI Paraphraser
Cash flow analysis: this technique help to define the cash flow position with in the
business. In above case study Through this technique managers be able to evaluate and maintain
the ratio of cash for execution of functions of business.
Advantages:
It is useful to analyse the liquidity of organisation and actual cash position. It reduced the discrepancy and conflicts in financial reporting.
Disadvantages:
Real liquidity of organisation can not be determined by evaluate the cash floe.
Cash balance mainly associated with separate functions to perform the tasks.
3. The non financial factors may impact this investment decisions
There are type of key non financial factors which affect the decision making are defined
as follows;
Climate issue: Organisations seek for environment friendly plants and equipments to
make production and manufacturing process adequate to environment.
Staff motivation: this non financial factor affect the investment plan whether the
proposal should be accepted by business or not. Free consent of employees affect the investment
decisions.
Backbend profit: this is an another non financial factor which contains the profit earned
by investing in non financial projects. This affect the mindset of managers in terms of investing
the funds in existing projects.
Customer's satisfaction: this is also one of the non financial aspect which affect the
decision making by affecting the customer satisfaction. There is a contingent situation found
always whether customers will accept the products and services with new manufacturing process
and plan.
Availability of manpower: this non financial factor is important in terms of meeting the
targets of organisation in terms of production and manufacturing goods.
Government regulation: Legislations, policies regarding the investment plans are the
other non financial factors affect the decision plans.
Competitor's action: the market position and capital structure of competitive
organisation is the main aspect affect the investment decision.
6
Trend: this indicates towards the elements and recent situation of market regarding the
products and services. Trend is the main non financial factor which justify the effectiveness and
sustainability of investment decisions.
This assists in achieving the targets of current and future legislations.
Meeting the standards set by the industry and good practise.
It improves the morale of staff, making it easier to recruit and retaining employees.
The improvement of relationship with the customers and suppliers of the company.
Dealing and anticipating the issues faced by the company, such as protection of
intellectual property and against the potential competition.
Development of the capabilities of the company, such as building up of skills of the
employees and their experience in newer areas or strengthening the management
systems.
This assists in improving the brand image, relationship and reputation of the company in
the market (Meaning of finance reporting and record, 2017).
CONCLUSION
Study of finance from manager's perspective are elaborated in above report. Relevant and
irrelevant cost concept is understandable with critical evaluation and management summarised in
this report. Financial interpretation of forecasted net profit and cash flow is also done in
organisational context. Cost profit volume and break even analysis done after replacement
decision. Evaluation of capital investment by applying different capital evaluation techniques are
also defined in this report. Strength and weakness of non financial factors are also analysed in
this report. How non financial factors affect the management decision are concluded in
organisational context.
7
⊘ This is a preview!⊘
Do you want full access?
Subscribe today to unlock all pages.
Trusted by 1+ million students worldwide
REFERENCES
Books and Journals:
Yinzhi, M., 2013. Controlling Shareholders, Professional Managers and Independent Directors in
the Family Enterprise Governance. Peking University Law Review. 1. p.014.
Yin, C., 2016. The optimal size of hedge funds: conflict between investors and fund
managers. The Journal of Finance. 71(4). pp.1857-1894.
Sharma, P. and Paul, S., 2015. Testing the skill of mutual fund managers: evidence from
India. Managerial Finance. 41(8). pp.806-824.
Philippon, T. and Reshef, A., 2012. Wages and human capital in the US finance industry: 1909–
2006. The Quarterly Journal of Economics. 127(4). pp.1551-1609.
Ozo, F. K. and et. al. 2015. Corporate dividend policy in practice: the views of Nigerian financial
managers. Managerial Finance. 41(11). pp.1159-1175.
Fan, J. P., Wei, K. J. and Xu, X., 2011. Corporate finance and governance in emerging markets:
A selective review and an agenda for future research.
Ding, B. and Wermers, R., 2012. Mutual fund performance and governance structure: The role of
portfolio managers and boards of directors.
Coles, J. L., Lemmon, M. L. and Meschke, J.F., 2012. Structural models and endogeneity in
corporate finance: The link between managerial ownership and corporate
performance. Journal of Financial Economics. 103(1). pp.149-168.
Baker, M. and Wurgler, J., 2011. Behavioral corporate finance: An updated survey (No.
w17333). National Bureau of Economic Research.
Baker, H. K., Singleton, J. C. and Veit, E. T., 2011. Survey research in corporate finance:
bridging the gap between theory and practice. Oxford University Press.
Ang, W. R., Gregoriou, G. N. and Lean, H. H., 2014. Market-timing skills of socially responsible
investment fund managers: The case of North America versus Europe. Journal of Asset
Management. 15(6). pp.366-377.
Online
Meaning of finance reporting and record, 2017. [Online] Avalialble
through<https://www.amazon.com/Finance-Managers-Harvard-Business-Essentials/dp/
1578518768>
8
Paraphrase This Document
Need a fresh take? Get an instant paraphrase of this document with our AI Paraphraser
APPENDIX
1. Cash flow.
Forecasted Cash flow For Petrol and Diesel vehicle
Particulars 2019 2020 2021 2022 2023
Revenues
Estimated sales over the next five
years 637500000 637500000 637500000 637500000 637500000
Total sales 637500000 637500000 637500000 637500000 637500000
Expenses
Research and development 1750000 1750000 1750000 1750000 1750000
Cost of material 352500000 352500000 352500000 352500000 352500000
Cost of labour per vehicle 75000000 75000000 75000000 75000000 75000000
Variable overheads per vehicle 86250000 86250000 86250000 86250000 86250000
Manufacturing cost 515500000 515500000 515500000 515500000 515500000
Less: reduction in manufacturing cost -300000 -300000 -300000 -300000 -300000
Total manufacturing cost 515200000 515200000 515200000 515200000 515200000
Annual selling expenses 6375000 6375000 6375000 6375000 6375000
Annual administration expenses 20500000 20500000 20500000 20500000 20500000
Net cash flow 95425000 95425000 95425000 95425000 95425000
Forecasted net cash flow for electric vehicles
Forecasted net cash flow for
electric vehicles 2019 2020 2021 2022 2023
Revenues
Estimated sales over the next five
years 700000000 735000000 771750000 810337500 850854375
Total sales 700000000 735000000 771750000 810337500 850854375
Expenses
Research and development 3500000 3605000 3713150 3824544.5
3939280.83
5
Cost of material 375000000 375000000 375000000 375000000 375000000
Cost of labour per vehicle 75000000 75000000 75000000 75000000 75000000
9
Variable overheads per vehicle 110000000 110000000 110000000 110000000 110000000
Extra component cost 14500000 14500000 14500000 14500000 14500000
Manufacturing cost 578000000 578105000 578213150 578324545 578439281
Less: Government grants -175000000 -183750000 -192937500 -202584375
-
212709000
Total manufacturing cost 403000000 394355000 385275650 375740170 365730281
Annual selling expenses 85085438 85085438 85085438 85085438 85085438
Annual administration expenses 20500000 20500000 20500000 20500000 20500000
Net cash flow 191414562 235059562 280888912 329011893 379538656
2. Net profit/loss
Forecasted net profit For Petrol and Diesel vehicle
Particulars 2019 2020 2021 2022 2023
Revenues
Estimated sales over the next five
years 637500000 637500000 637500000 637500000 637500000
Total sales 637500000 637500000 637500000 637500000 637500000
Expenses
Research and development 1750000 1750000 1750000 1750000 1750000
Cost of material 352500000 352500000 352500000 352500000 352500000
Cost of labour per vehicle 75000000 75000000 75000000 75000000 75000000
Variable overheads per vehicle 86250000 86250000 86250000 86250000 86250000
Manufacturing cost 515500000 515500000 515500000 515500000 515500000
Less: reduction in manufacturing
cost -300000 -300000 -300000 -300000 -300000
Total manufacturing cost 515200000 515200000 515200000 515200000 515200000
Annual selling expenses 6375000 6375000 6375000 6375000 6375000
Annual administration expenses 20500000 20500000 20500000 20500000 20500000
Depreciation
Machinery 1280000 1280000 1280000 1280000 1280000
10
⊘ This is a preview!⊘
Do you want full access?
Subscribe today to unlock all pages.
Trusted by 1+ million students worldwide
1 out of 14
Related Documents


Your All-in-One AI-Powered Toolkit for Academic Success.
+13062052269
info@desklib.com
Available 24*7 on WhatsApp / Email
![[object Object]](/_next/static/media/star-bottom.7253800d.svg)
Unlock your academic potential
Copyright © 2020–2026 A2Z Services. All Rights Reserved. Developed and managed by ZUCOL.