Finance for Managers (ACC91210): Case Study 1 Risk and Return Analysis
VerifiedAdded on 2022/10/31
|9
|2272
|311
Report
AI Summary
This finance report presents a comprehensive risk and return analysis of JB Hi-Fi and a reference company, utilizing historical market data from October 2018 to November 2019. The analysis includes calculating monthly returns, average returns, and standard deviations for the case company, reference company, market index, and an equally weighted portfolio. The Capital Asset Pricing Model (CAPM) is applied to determine expected returns, followed by the calculation of portfolio expected return and beta. The report discusses the risk and return measures, highlighting the benefits of diversification and its impact on mitigating risk. It concludes that diversification is a viable method for increasing overall returns while minimizing risk. The report also incorporates an analysis of the CAPM, providing insights into the risk factors that are taken into consideration when determining the expected returns of an investment.

Running head: FINANCE FOR MANAGERS
Finance for Managers
Name of the Student:
Name of the University:
Authors Note:
Finance for Managers
Name of the Student:
Name of the University:
Authors Note:
Paraphrase This Document
Need a fresh take? Get an instant paraphrase of this document with our AI Paraphraser

FINANCE FOR MANAGERS
1
Table of Contents
a.1) Calculating the historical monthly rates of return of the market index:.............................2
a.2) Calculating the historical average rate of return and standard deviation of your case
company; ii) the reference company; iii) the market index; and iv) an equally weighted
portfolio:.....................................................................................................................................2
b.1) Calculating the CAPM returns of 1) your case company; and 2) the reference company: 4
b.2) Calculating the portfolio expected return and beta:............................................................5
c) Discussing the risk and return measures calculated for the company and portfolio:.............6
Reference and Bibliography:......................................................................................................7
FINANCE FOR MANAGERS
2
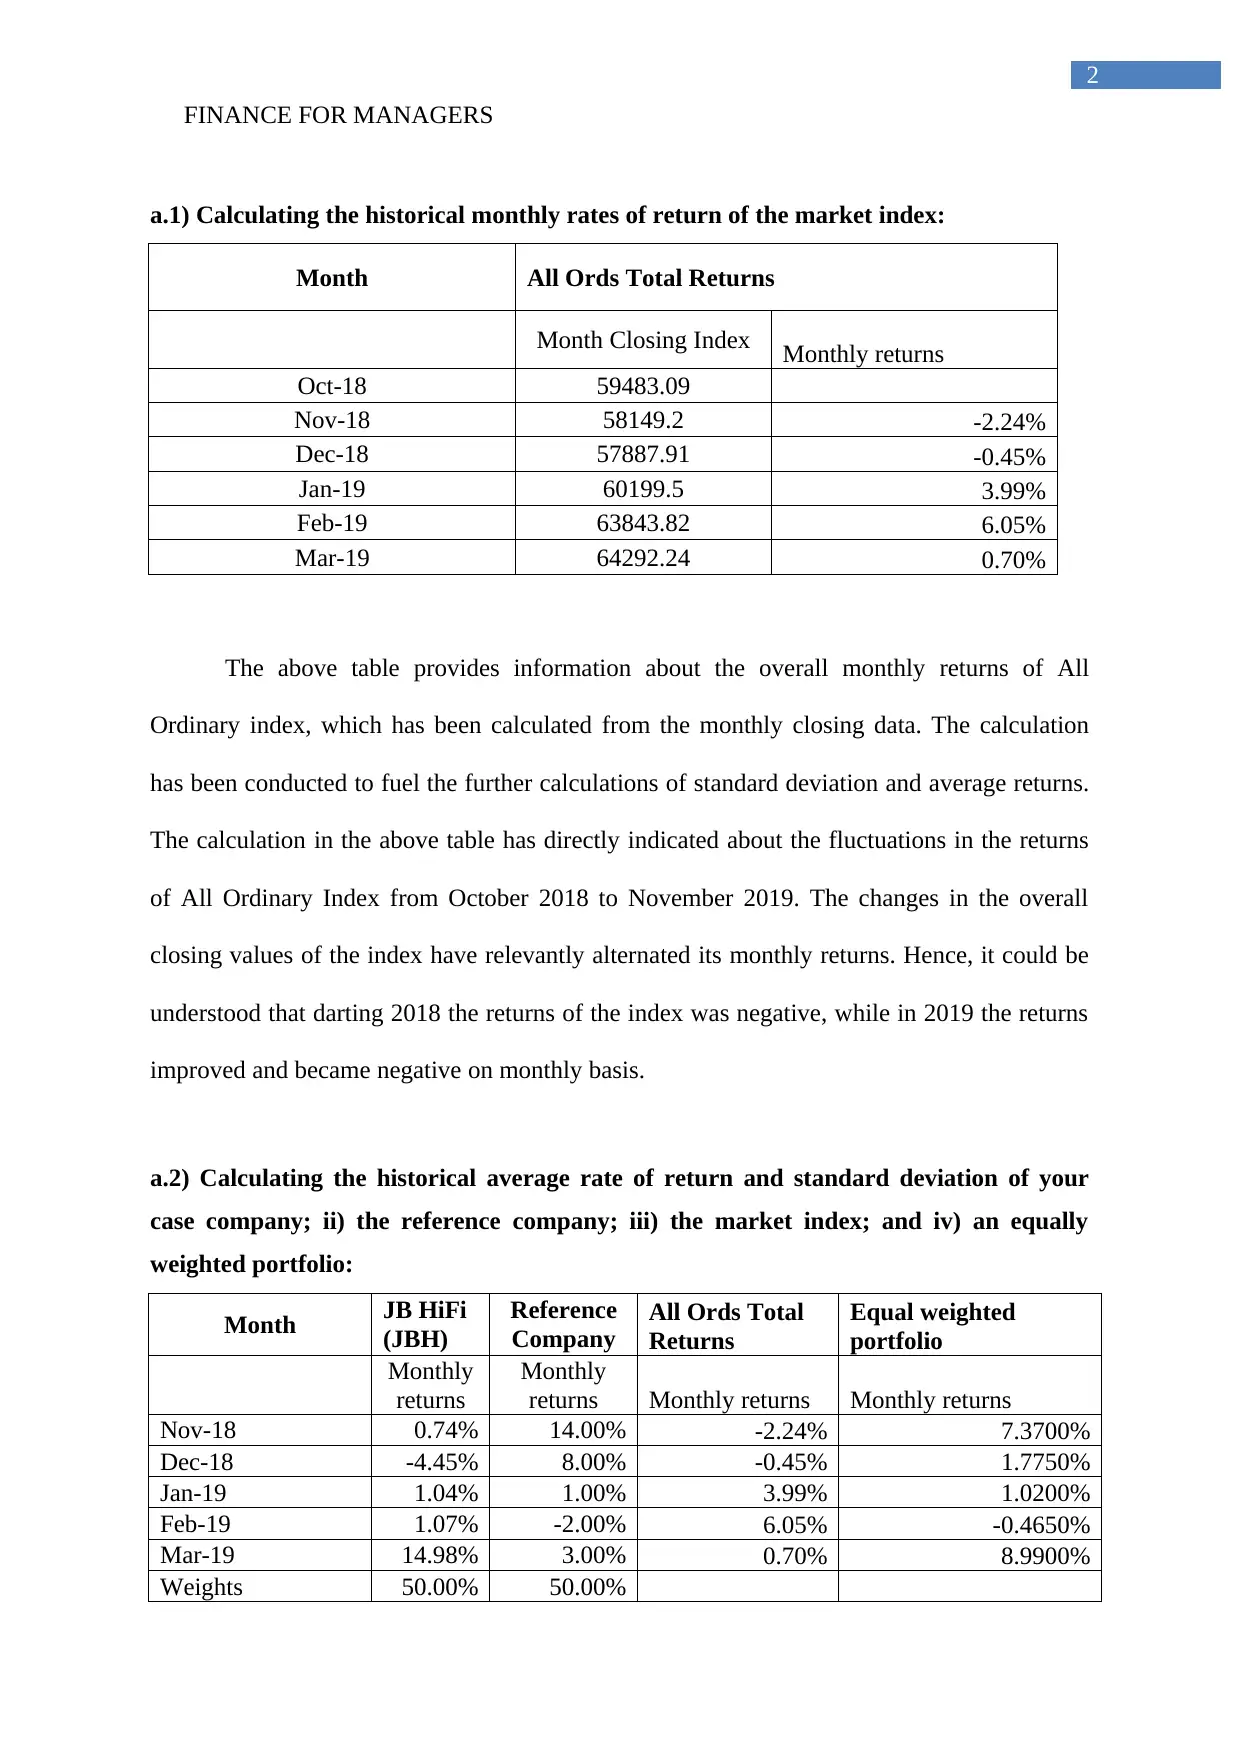
a.1) Calculating the historical monthly rates of return of the market index:
Month All Ords Total Returns
Month Closing Index Monthly returns
Oct-18 59483.09
Nov-18 58149.2 -2.24%
Dec-18 57887.91 -0.45%
Jan-19 60199.5 3.99%
Feb-19 63843.82 6.05%
Mar-19 64292.24 0.70%
The above table provides information about the overall monthly returns of All
Ordinary index, which has been calculated from the monthly closing data. The calculation
has been conducted to fuel the further calculations of standard deviation and average returns.
The calculation in the above table has directly indicated about the fluctuations in the returns
of All Ordinary Index from October 2018 to November 2019. The changes in the overall
closing values of the index have relevantly alternated its monthly returns. Hence, it could be
understood that darting 2018 the returns of the index was negative, while in 2019 the returns
improved and became negative on monthly basis.
a.2) Calculating the historical average rate of return and standard deviation of your
case company; ii) the reference company; iii) the market index; and iv) an equally
weighted portfolio:
Month JB HiFi
(JBH)
Reference
Company
All Ords Total
Returns
Equal weighted
portfolio
Monthly
returns
Monthly
returns Monthly returns Monthly returns
Nov-18 0.74% 14.00% -2.24% 7.3700%
Dec-18 -4.45% 8.00% -0.45% 1.7750%
Jan-19 1.04% 1.00% 3.99% 1.0200%
Feb-19 1.07% -2.00% 6.05% -0.4650%
Mar-19 14.98% 3.00% 0.70% 8.9900%
Weights 50.00% 50.00%
2
a.1) Calculating the historical monthly rates of return of the market index:
Month All Ords Total Returns
Month Closing Index Monthly returns
Oct-18 59483.09
Nov-18 58149.2 -2.24%
Dec-18 57887.91 -0.45%
Jan-19 60199.5 3.99%
Feb-19 63843.82 6.05%
Mar-19 64292.24 0.70%
The above table provides information about the overall monthly returns of All
Ordinary index, which has been calculated from the monthly closing data. The calculation
has been conducted to fuel the further calculations of standard deviation and average returns.
The calculation in the above table has directly indicated about the fluctuations in the returns
of All Ordinary Index from October 2018 to November 2019. The changes in the overall
closing values of the index have relevantly alternated its monthly returns. Hence, it could be
understood that darting 2018 the returns of the index was negative, while in 2019 the returns
improved and became negative on monthly basis.
a.2) Calculating the historical average rate of return and standard deviation of your
case company; ii) the reference company; iii) the market index; and iv) an equally
weighted portfolio:
Month JB HiFi
(JBH)
Reference
Company
All Ords Total
Returns
Equal weighted
portfolio
Monthly
returns
Monthly
returns Monthly returns Monthly returns
Nov-18 0.74% 14.00% -2.24% 7.3700%
Dec-18 -4.45% 8.00% -0.45% 1.7750%
Jan-19 1.04% 1.00% 3.99% 1.0200%
Feb-19 1.07% -2.00% 6.05% -0.4650%
Mar-19 14.98% 3.00% 0.70% 8.9900%
Weights 50.00% 50.00%
⊘ This is a preview!⊘
Do you want full access?
Subscribe today to unlock all pages.
Trusted by 1+ million students worldwide
FINANCE FOR MANAGERS
3
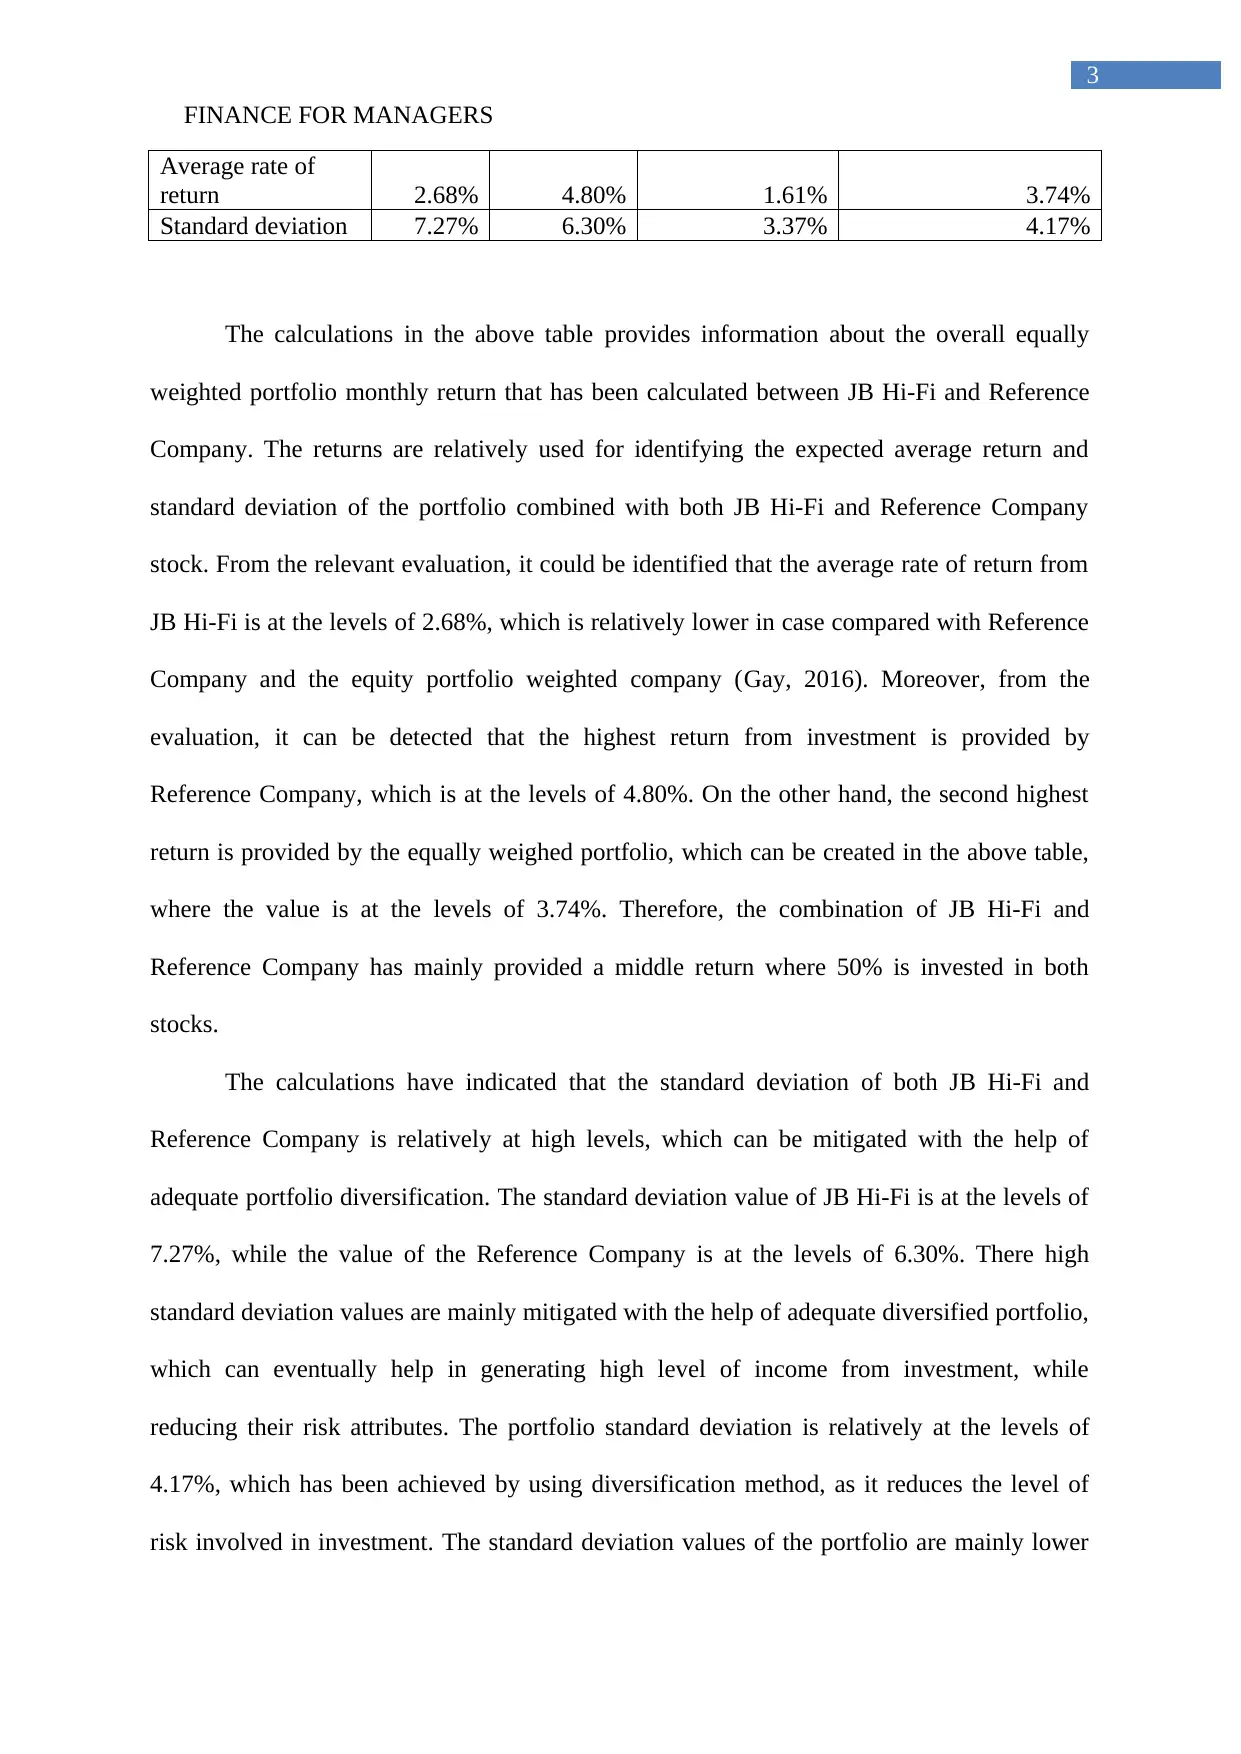
Average rate of
return 2.68% 4.80% 1.61% 3.74%
Standard deviation 7.27% 6.30% 3.37% 4.17%
The calculations in the above table provides information about the overall equally
weighted portfolio monthly return that has been calculated between JB Hi-Fi and Reference
Company. The returns are relatively used for identifying the expected average return and
standard deviation of the portfolio combined with both JB Hi-Fi and Reference Company
stock. From the relevant evaluation, it could be identified that the average rate of return from
JB Hi-Fi is at the levels of 2.68%, which is relatively lower in case compared with Reference
Company and the equity portfolio weighted company (Gay, 2016). Moreover, from the
evaluation, it can be detected that the highest return from investment is provided by
Reference Company, which is at the levels of 4.80%. On the other hand, the second highest
return is provided by the equally weighed portfolio, which can be created in the above table,
where the value is at the levels of 3.74%. Therefore, the combination of JB Hi-Fi and
Reference Company has mainly provided a middle return where 50% is invested in both
stocks.
The calculations have indicated that the standard deviation of both JB Hi-Fi and
Reference Company is relatively at high levels, which can be mitigated with the help of
adequate portfolio diversification. The standard deviation value of JB Hi-Fi is at the levels of
7.27%, while the value of the Reference Company is at the levels of 6.30%. There high
standard deviation values are mainly mitigated with the help of adequate diversified portfolio,
which can eventually help in generating high level of income from investment, while
reducing their risk attributes. The portfolio standard deviation is relatively at the levels of
4.17%, which has been achieved by using diversification method, as it reduces the level of
risk involved in investment. The standard deviation values of the portfolio are mainly lower
3
Average rate of
return 2.68% 4.80% 1.61% 3.74%
Standard deviation 7.27% 6.30% 3.37% 4.17%
The calculations in the above table provides information about the overall equally
weighted portfolio monthly return that has been calculated between JB Hi-Fi and Reference
Company. The returns are relatively used for identifying the expected average return and
standard deviation of the portfolio combined with both JB Hi-Fi and Reference Company
stock. From the relevant evaluation, it could be identified that the average rate of return from
JB Hi-Fi is at the levels of 2.68%, which is relatively lower in case compared with Reference
Company and the equity portfolio weighted company (Gay, 2016). Moreover, from the
evaluation, it can be detected that the highest return from investment is provided by
Reference Company, which is at the levels of 4.80%. On the other hand, the second highest
return is provided by the equally weighed portfolio, which can be created in the above table,
where the value is at the levels of 3.74%. Therefore, the combination of JB Hi-Fi and
Reference Company has mainly provided a middle return where 50% is invested in both
stocks.
The calculations have indicated that the standard deviation of both JB Hi-Fi and
Reference Company is relatively at high levels, which can be mitigated with the help of
adequate portfolio diversification. The standard deviation value of JB Hi-Fi is at the levels of
7.27%, while the value of the Reference Company is at the levels of 6.30%. There high
standard deviation values are mainly mitigated with the help of adequate diversified portfolio,
which can eventually help in generating high level of income from investment, while
reducing their risk attributes. The portfolio standard deviation is relatively at the levels of
4.17%, which has been achieved by using diversification method, as it reduces the level of
risk involved in investment. The standard deviation values of the portfolio are mainly lower
Paraphrase This Document
Need a fresh take? Get an instant paraphrase of this document with our AI Paraphraser
FINANCE FOR MANAGERS
4
than the initial values of the stock. This is due to the diversification method used for
mitigating the fluctuations in the price movement of the combined portfolio returns. The
reduction in the fluctuations of the returns has resulted in the lower standard deviation of the
portfolio. Moreover, the returns provided by this equal weighted portfolio are higher in
comparison to the standard deviation. Therefore, investment and Portfolio would eventually
help in generating high level of return for the investors, while minimize any kind of risk
involved in investments (Chapple & Humphrey, 2014). Therefore, it could be understood that
with the help of diversification the overall returns of the investment is increased while the
fluctuations in the risk factor decreases. Thus, diversification method is considered to be
more viable, as it will help in generating high level of income, while reducing the total risk
involved in the investments.
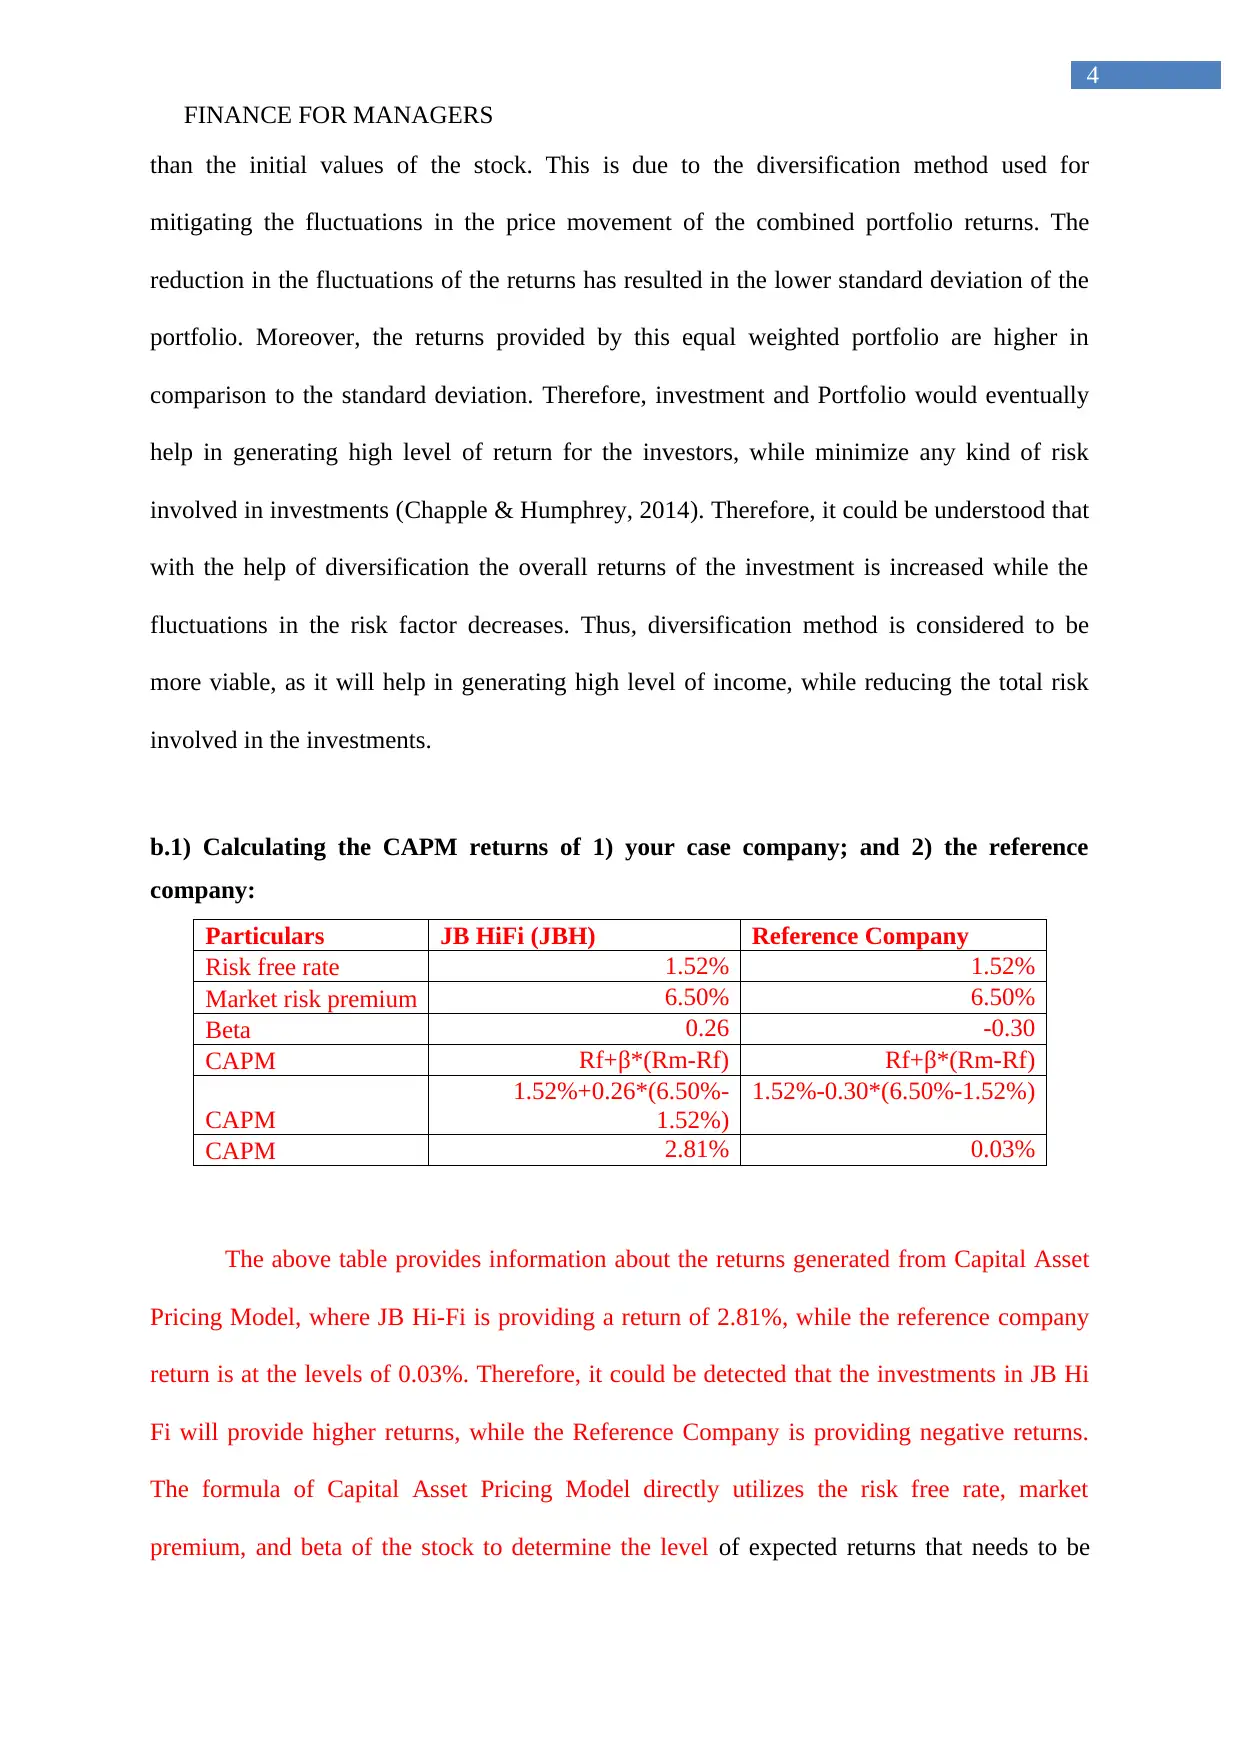
b.1) Calculating the CAPM returns of 1) your case company; and 2) the reference
company:
Particulars JB HiFi (JBH) Reference Company
Risk free rate 1.52% 1.52%
Market risk premium 6.50% 6.50%
Beta 0.26 -0.30
CAPM Rf+β*(Rm-Rf) Rf+β*(Rm-Rf)
CAPM
1.52%+0.26*(6.50%-
1.52%)
1.52%-0.30*(6.50%-1.52%)
CAPM 2.81% 0.03%
The above table provides information about the returns generated from Capital Asset
Pricing Model, where JB Hi-Fi is providing a return of 2.81%, while the reference company
return is at the levels of 0.03%. Therefore, it could be detected that the investments in JB Hi
Fi will provide higher returns, while the Reference Company is providing negative returns.
The formula of Capital Asset Pricing Model directly utilizes the risk free rate, market
premium, and beta of the stock to determine the level of expected returns that needs to be
4
than the initial values of the stock. This is due to the diversification method used for
mitigating the fluctuations in the price movement of the combined portfolio returns. The
reduction in the fluctuations of the returns has resulted in the lower standard deviation of the
portfolio. Moreover, the returns provided by this equal weighted portfolio are higher in
comparison to the standard deviation. Therefore, investment and Portfolio would eventually
help in generating high level of return for the investors, while minimize any kind of risk
involved in investments (Chapple & Humphrey, 2014). Therefore, it could be understood that
with the help of diversification the overall returns of the investment is increased while the
fluctuations in the risk factor decreases. Thus, diversification method is considered to be
more viable, as it will help in generating high level of income, while reducing the total risk
involved in the investments.
b.1) Calculating the CAPM returns of 1) your case company; and 2) the reference
company:
Particulars JB HiFi (JBH) Reference Company
Risk free rate 1.52% 1.52%
Market risk premium 6.50% 6.50%
Beta 0.26 -0.30
CAPM Rf+β*(Rm-Rf) Rf+β*(Rm-Rf)
CAPM
1.52%+0.26*(6.50%-
1.52%)
1.52%-0.30*(6.50%-1.52%)
CAPM 2.81% 0.03%
The above table provides information about the returns generated from Capital Asset
Pricing Model, where JB Hi-Fi is providing a return of 2.81%, while the reference company
return is at the levels of 0.03%. Therefore, it could be detected that the investments in JB Hi
Fi will provide higher returns, while the Reference Company is providing negative returns.
The formula of Capital Asset Pricing Model directly utilizes the risk free rate, market
premium, and beta of the stock to determine the level of expected returns that needs to be
FINANCE FOR MANAGERS
5
provided by company to their shareholders. Hence, from the relevant valuation, it can be
detected that with the high level of beta the overall stock of JB Hi-Fi needs to generate a
return of 2.81%, while the reference company needs to only provide 0.03%. Thus, the
combination of both the stock would eventually help the investors to mitigate the relevant
risk of price volatility that is conducted by the capital market fluctuations.
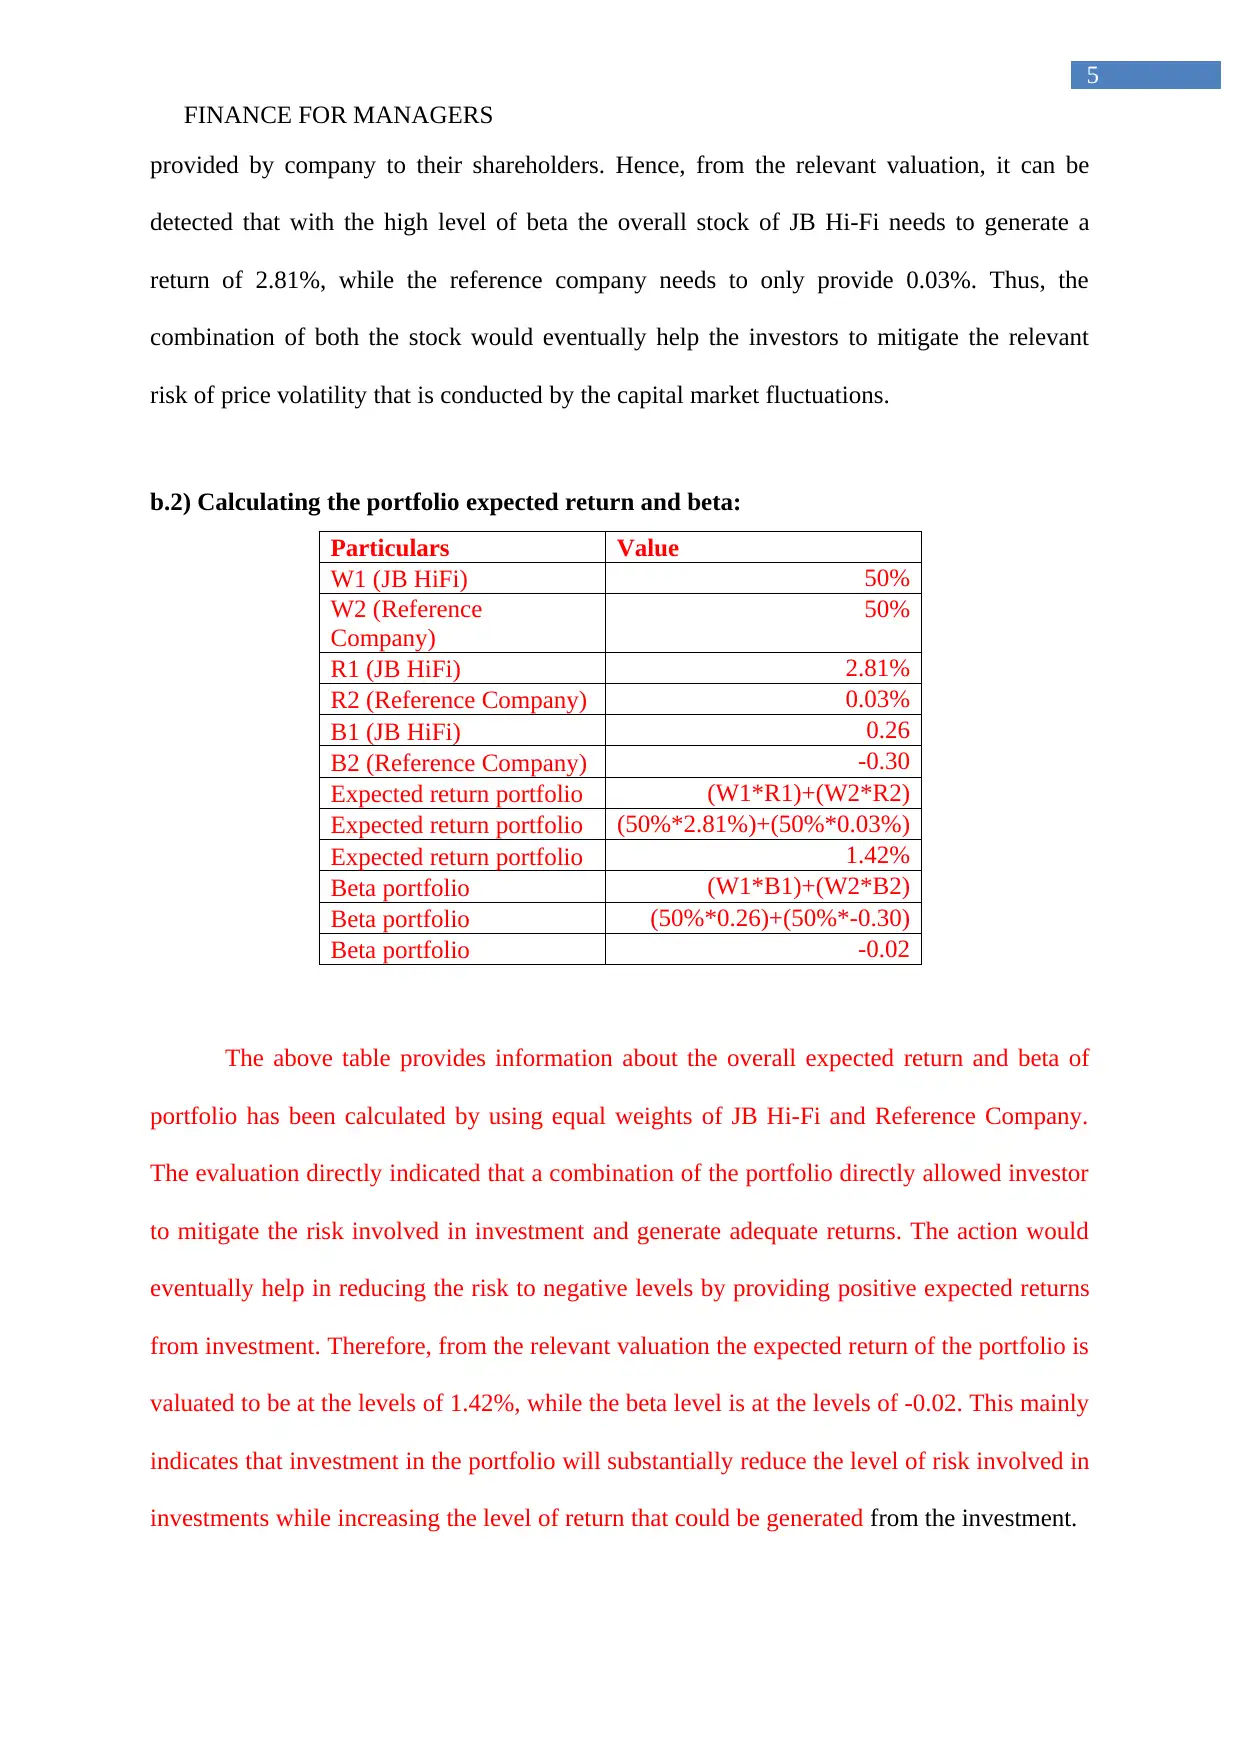
b.2) Calculating the portfolio expected return and beta:
Particulars Value
W1 (JB HiFi) 50%
W2 (Reference
Company)
50%
R1 (JB HiFi) 2.81%
R2 (Reference Company) 0.03%
B1 (JB HiFi) 0.26
B2 (Reference Company) -0.30
Expected return portfolio (W1*R1)+(W2*R2)
Expected return portfolio (50%*2.81%)+(50%*0.03%)
Expected return portfolio 1.42%
Beta portfolio (W1*B1)+(W2*B2)
Beta portfolio (50%*0.26)+(50%*-0.30)
Beta portfolio -0.02
The above table provides information about the overall expected return and beta of
portfolio has been calculated by using equal weights of JB Hi-Fi and Reference Company.
The evaluation directly indicated that a combination of the portfolio directly allowed investor
to mitigate the risk involved in investment and generate adequate returns. The action would
eventually help in reducing the risk to negative levels by providing positive expected returns
from investment. Therefore, from the relevant valuation the expected return of the portfolio is
valuated to be at the levels of 1.42%, while the beta level is at the levels of -0.02. This mainly
indicates that investment in the portfolio will substantially reduce the level of risk involved in
investments while increasing the level of return that could be generated from the investment.
5
provided by company to their shareholders. Hence, from the relevant valuation, it can be
detected that with the high level of beta the overall stock of JB Hi-Fi needs to generate a
return of 2.81%, while the reference company needs to only provide 0.03%. Thus, the
combination of both the stock would eventually help the investors to mitigate the relevant
risk of price volatility that is conducted by the capital market fluctuations.
b.2) Calculating the portfolio expected return and beta:
Particulars Value
W1 (JB HiFi) 50%
W2 (Reference
Company)
50%
R1 (JB HiFi) 2.81%
R2 (Reference Company) 0.03%
B1 (JB HiFi) 0.26
B2 (Reference Company) -0.30
Expected return portfolio (W1*R1)+(W2*R2)
Expected return portfolio (50%*2.81%)+(50%*0.03%)
Expected return portfolio 1.42%
Beta portfolio (W1*B1)+(W2*B2)
Beta portfolio (50%*0.26)+(50%*-0.30)
Beta portfolio -0.02
The above table provides information about the overall expected return and beta of
portfolio has been calculated by using equal weights of JB Hi-Fi and Reference Company.
The evaluation directly indicated that a combination of the portfolio directly allowed investor
to mitigate the risk involved in investment and generate adequate returns. The action would
eventually help in reducing the risk to negative levels by providing positive expected returns
from investment. Therefore, from the relevant valuation the expected return of the portfolio is
valuated to be at the levels of 1.42%, while the beta level is at the levels of -0.02. This mainly
indicates that investment in the portfolio will substantially reduce the level of risk involved in
investments while increasing the level of return that could be generated from the investment.
⊘ This is a preview!⊘
Do you want full access?
Subscribe today to unlock all pages.
Trusted by 1+ million students worldwide
FINANCE FOR MANAGERS
6
c) Discussing the risk and return measures calculated for the company and portfolio:
The above calculations provide information about the overall risk and return
conditions of the selected company and portfolio. JB Hi-Fi has been selected as the company,
which is used for analyzing and creating the portfolio with reference company. From the
relevant evaluation, it could be identified that beta of JB Hi-Fi is calculated to be at the levels
of 0.26. On the other hand, the beta of reference company is calculated at -0.30. In a similar
instance, the expected return of the portfolio is calculated with the CAPM formula, where the
return of JB Hi-Fi is at the levels of 2.81%, while the returns of Reference Company are the
levels 0.03%. This mainly comprises the total expected return of the portfolio, which is at the
levels of 1.42%. Therefore, from the relevant evaluation, it can be identified that the beta of
the portfolio is negative and indicates a relevant opposite price action than the All Ordinary
index of Australia (Fagereng, Gottlieb & Guiso, 2017). However, the combined portfolio is
relatively helpful in reducing the level of risk involved in Investments, as the total risk was
mitigated and the return increased for the combined investments in JB Hi-Fi and Reference
Company.
Hence, with a portfolio with negative beta adequate diversification can be presented
to the investment, which improves the scope of the investment. Furthermore, analysis of the
CAPM indicates about the risk factors, which is taken into consideration for determining the
expected returns of an investment. .
The combination of the overall portfolio would be beneficial for the investors, as the
total risk involved in investment is at minimum levels of -0.02, which indicates that
fluctuations from the volatile market will have low impact on the price variation of the
portfolio. This would secure the investments conducted in the portfolio and allow the investor
to generate higher return, while minimizing the negative impact on the investment capital.
Paraphrase This Document
Need a fresh take? Get an instant paraphrase of this document with our AI Paraphraser
FINANCE FOR MANAGERS
7
Reference and Bibliography:
Al-Khazali, O., Lean, H.H. & Samet, A., 2014. Do Islamic stock indexes outperform
conventional stock indexes? A stochastic dominance approach. Pacific-Basin Finance
Journal, 28, pp.29-46.
Bloomberg.com. 2019. Bloomberg - Are you a robot?. [online] Available at:
https://www.bloomberg.com/markets/rates-bonds/government-bonds/australia [Accessed 25
May 2019].
Chapple, L. & Humphrey, J.E., 2014. Does board gender diversity have a financial impact?
Evidence using stock portfolio performance. Journal of business ethics, 122(4), pp.709-723.
Ewing, B.T. & Malik, F., 2016. Volatility spillovers between oil prices and the stock market
under structural breaks. Global Finance Journal, 29, pp.12-23.
Fagereng, A., Gottlieb, C. & Guiso, L., 2017. Asset market participation and portfolio choice
over the life‐cycle. The Journal of Finance, 72(2), pp.705-750.
Gay, R.D., 2016. Effect of macroeconomic variables on stock market returns for four
emerging economies: Brazil, Russia, India, and China. The International Business &
Economics Research Journal (Online), 15(3), p.119.
Kumar, D., 2014. Return and volatility transmission between gold and stock sectors:
Application of portfolio management and hedging effectiveness. IIMB Management
Review, 26(1), pp.5-16.

FINANCE FOR MANAGERS
8
Lim, S., Oh, K.W. & Zhu, J., 2014. Use of DEA cross-efficiency evaluation in portfolio
selection: An application to Korean stock market. European Journal of Operational
Research, 236(1), pp.361-368.
Lin, B., Wesseh Jr, P.K. & Appiah, M.O., 2014. Oil price fluctuation, volatility spillover and
the Ghanaian equity market: Implication for portfolio management and hedging
effectiveness. Energy Economics, 42, pp.172-182.
Mensi, W., Hammoudeh, S. & Kang, S.H., 2015. Precious metals, cereal, oil and stock
market linkages and portfolio risk management: Evidence from Saudi Arabia. Economic
Modelling, 51, pp.340-358.
Syriopoulos, T., Makram, B. & Boubaker, A., 2015. Stock market volatility spillovers and
portfolio hedging: BRICS and the financial crisis. International Review of Financial
Analysis, 39, pp.7-18.
Yao, J., Ma, C. & He, W.P., 2014. Investor herding behaviour of Chinese stock
market. International Review of Economics & Finance, 29, pp.12-29.
⊘ This is a preview!⊘
Do you want full access?
Subscribe today to unlock all pages.
Trusted by 1+ million students worldwide
1 out of 9
Related Documents


Your All-in-One AI-Powered Toolkit for Academic Success.
+13062052269
info@desklib.com
Available 24*7 on WhatsApp / Email
![[object Object]](/_next/static/media/star-bottom.7253800d.svg)
Unlock your academic potential
Copyright © 2020–2026 A2Z Services. All Rights Reserved. Developed and managed by ZUCOL.