Financial Analysis of Tesco PLC: Ratio, Budgeting, and Investment
VerifiedAdded on 2023/01/09
|18
|4221
|24
Report
AI Summary
This report provides a comprehensive financial analysis of Tesco PLC, focusing on key aspects relevant to finance managers. It begins with an introduction to the importance of finance in business organizations and its role in decision-making. The report then delves into a detailed examination of Tesco's financial performance, including an analysis of its mission and vision based on auditor reports and financial statements. It presents a thorough ratio analysis covering liquidity, profitability, efficiency, and stability ratios, comparing the company's performance over several years. The report also includes comparative analyses of the income statement and balance sheet, highlighting trends and significant changes. Furthermore, it explores budgeting plans, emphasizing the importance of SMART goals and the identification of limiting factors. Finally, the report discusses capital investment decisions and their impact on the company's financial health, providing a well-rounded perspective on Tesco's financial management practices and performance.
Finance for managers
Paraphrase This Document
Need a fresh take? Get an instant paraphrase of this document with our AI Paraphraser
TABLE OF CONTENTS
INTRODUCTION......................................................................................................................3
Task 1.........................................................................................................................................3
1.1...........................................................................................................................................3
1.2...........................................................................................................................................3
1.3...........................................................................................................................................5
1.4...........................................................................................................................................7
Task 2.........................................................................................................................................7
2.1...........................................................................................................................................7
2.2...........................................................................................................................................9
2.3...........................................................................................................................................9
Task 3.......................................................................................................................................10
3.1.........................................................................................................................................10
3.2.........................................................................................................................................10
3.3.........................................................................................................................................12
CONCLUSION........................................................................................................................13
REFERENCES.........................................................................................................................14
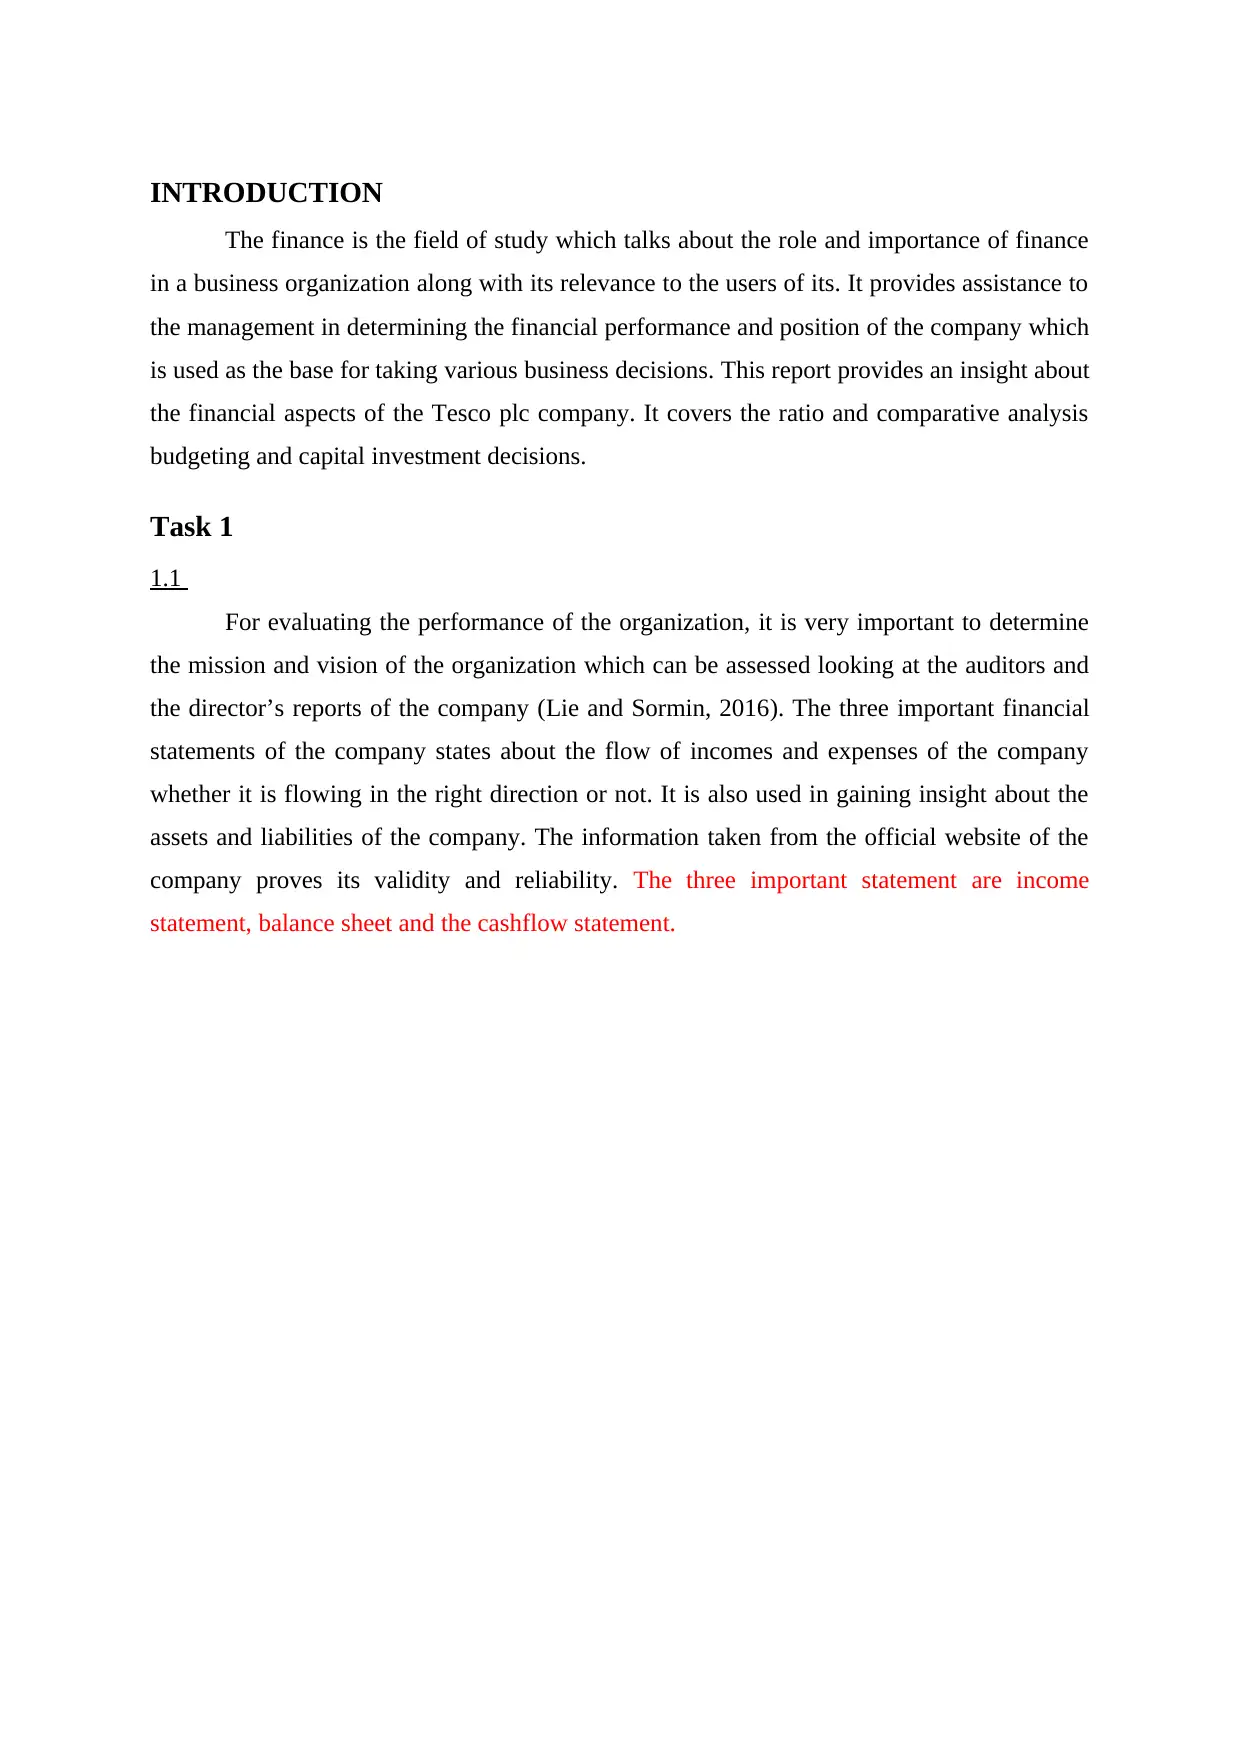
INTRODUCTION
The finance is the field of study which talks about the role and importance of finance
in a business organization along with its relevance to the users of its. It provides assistance to
the management in determining the financial performance and position of the company which
is used as the base for taking various business decisions. This report provides an insight about
the financial aspects of the Tesco plc company. It covers the ratio and comparative analysis
budgeting and capital investment decisions.
Task 1
1.1
For evaluating the performance of the organization, it is very important to determine
the mission and vision of the organization which can be assessed looking at the auditors and
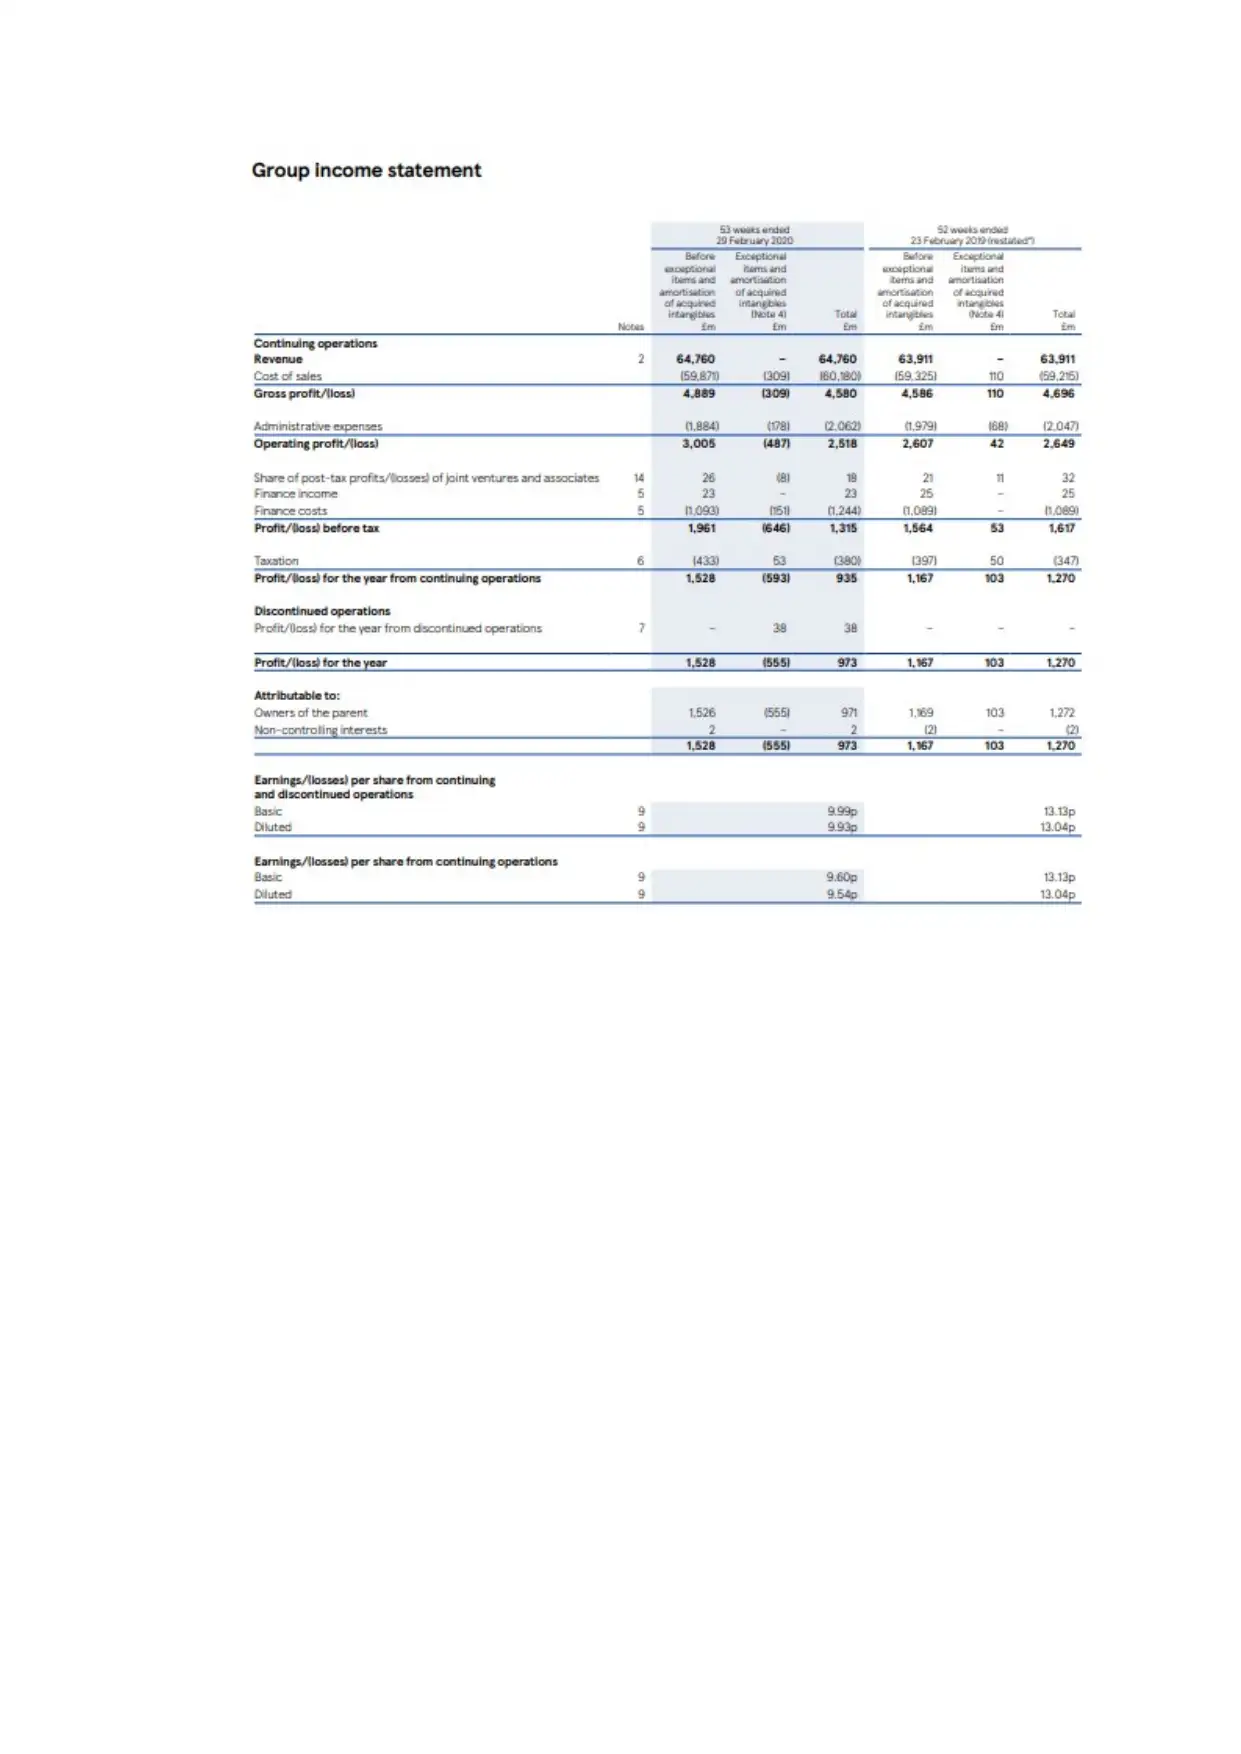
the director’s reports of the company (Lie and Sormin, 2016). The three important financial
statements of the company states about the flow of incomes and expenses of the company
whether it is flowing in the right direction or not. It is also used in gaining insight about the
assets and liabilities of the company. The information taken from the official website of the
company proves its validity and reliability. The three important statement are income
statement, balance sheet and the cashflow statement.
The finance is the field of study which talks about the role and importance of finance
in a business organization along with its relevance to the users of its. It provides assistance to
the management in determining the financial performance and position of the company which
is used as the base for taking various business decisions. This report provides an insight about
the financial aspects of the Tesco plc company. It covers the ratio and comparative analysis
budgeting and capital investment decisions.
Task 1
1.1
For evaluating the performance of the organization, it is very important to determine
the mission and vision of the organization which can be assessed looking at the auditors and
the director’s reports of the company (Lie and Sormin, 2016). The three important financial
statements of the company states about the flow of incomes and expenses of the company
whether it is flowing in the right direction or not. It is also used in gaining insight about the
assets and liabilities of the company. The information taken from the official website of the
company proves its validity and reliability. The three important statement are income
statement, balance sheet and the cashflow statement.
⊘ This is a preview!⊘
Do you want full access?
Subscribe today to unlock all pages.
Trusted by 1+ million students worldwide
Paraphrase This Document
Need a fresh take? Get an instant paraphrase of this document with our AI Paraphraser
1.2
Ratio analysis
Ratio analysis
⊘ This is a preview!⊘
Do you want full access?
Subscribe today to unlock all pages.
Trusted by 1+ million students worldwide
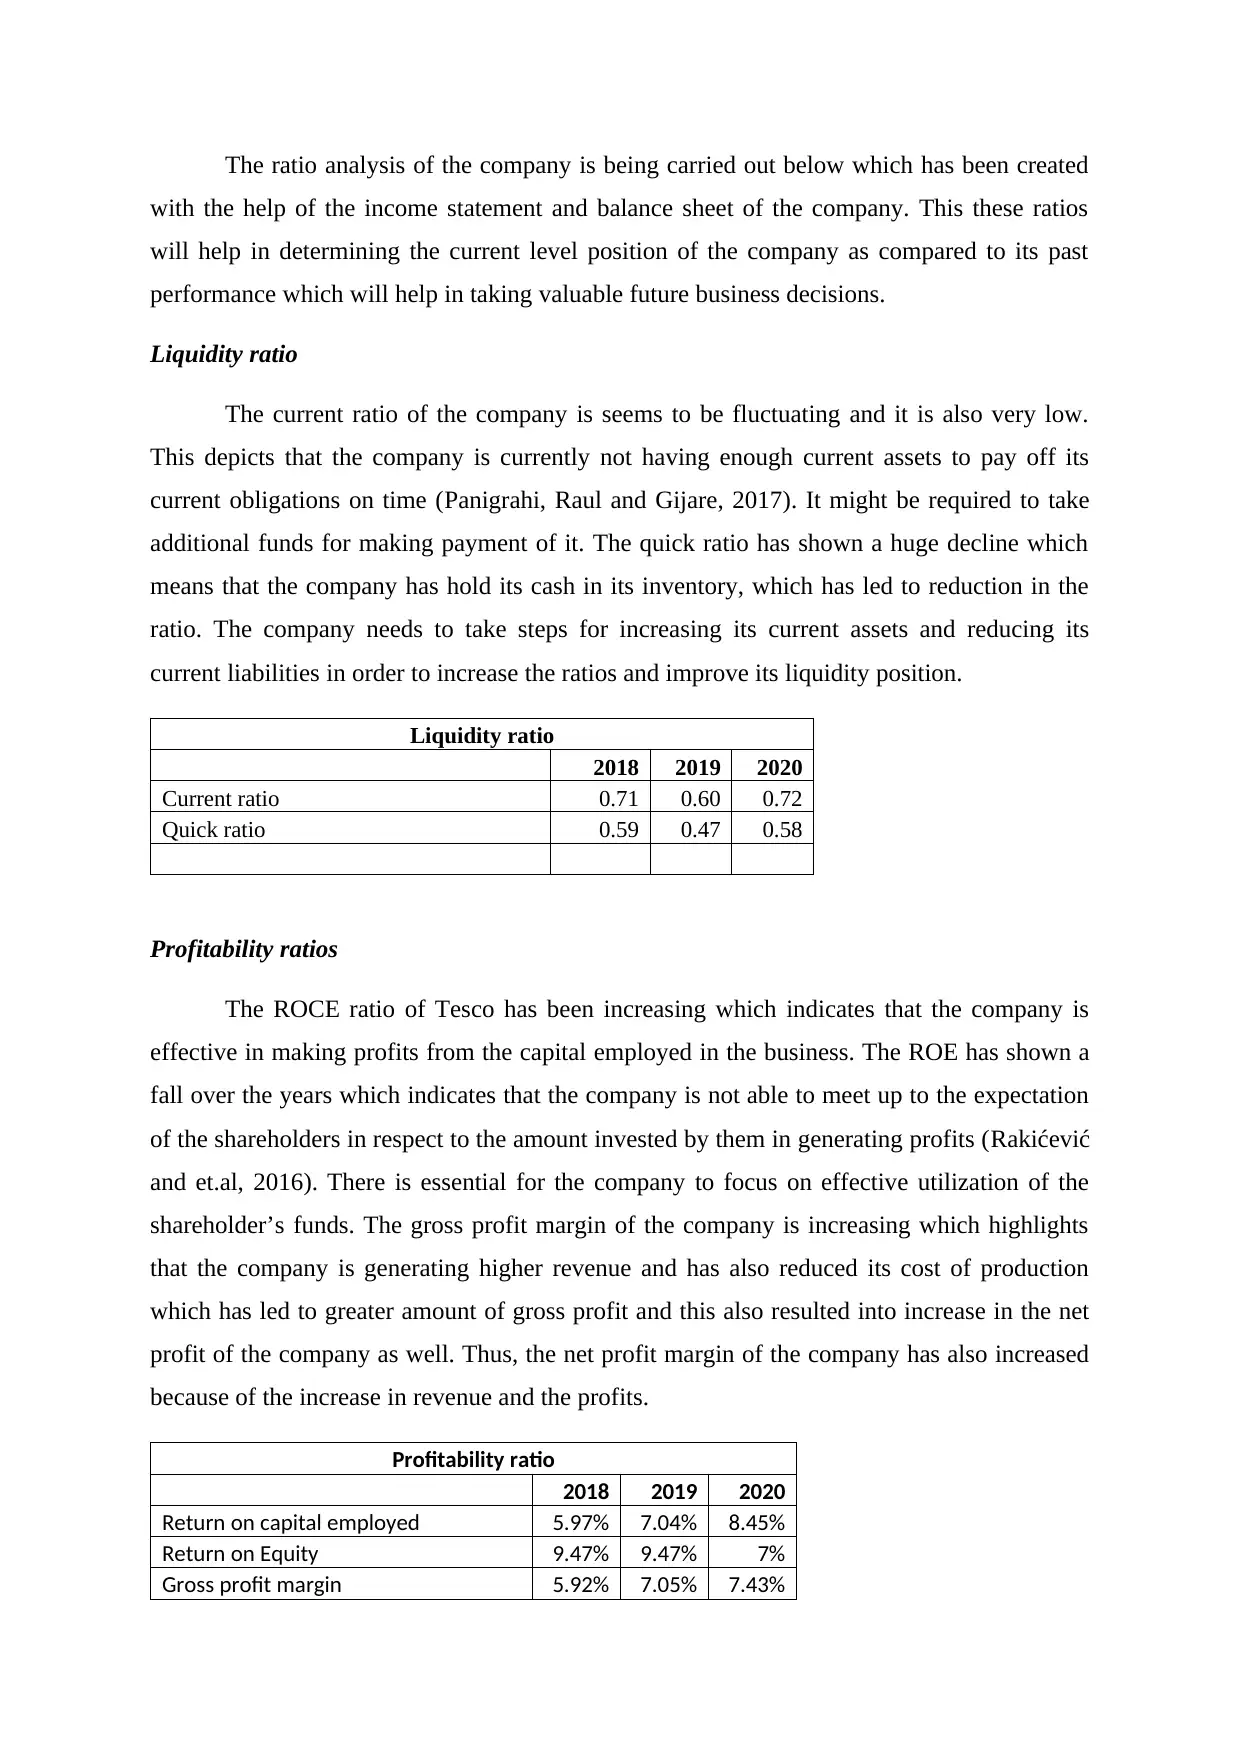
The ratio analysis of the company is being carried out below which has been created
with the help of the income statement and balance sheet of the company. This these ratios
will help in determining the current level position of the company as compared to its past
performance which will help in taking valuable future business decisions.
Liquidity ratio
The current ratio of the company is seems to be fluctuating and it is also very low.
This depicts that the company is currently not having enough current assets to pay off its
current obligations on time (Panigrahi, Raul and Gijare, 2017). It might be required to take
additional funds for making payment of it. The quick ratio has shown a huge decline which
means that the company has hold its cash in its inventory, which has led to reduction in the
ratio. The company needs to take steps for increasing its current assets and reducing its
current liabilities in order to increase the ratios and improve its liquidity position.
Liquidity ratio
2018 2019 2020
Current ratio 0.71 0.60 0.72
Quick ratio 0.59 0.47 0.58
Profitability ratios
The ROCE ratio of Tesco has been increasing which indicates that the company is
effective in making profits from the capital employed in the business. The ROE has shown a
fall over the years which indicates that the company is not able to meet up to the expectation
of the shareholders in respect to the amount invested by them in generating profits (Rakićević
and et.al, 2016). There is essential for the company to focus on effective utilization of the
shareholder’s funds. The gross profit margin of the company is increasing which highlights
that the company is generating higher revenue and has also reduced its cost of production
which has led to greater amount of gross profit and this also resulted into increase in the net
profit of the company as well. Thus, the net profit margin of the company has also increased
because of the increase in revenue and the profits.
Profitability ratio
2018 2019 2020
Return on capital employed 5.97% 7.04% 8.45%
Return on Equity 9.47% 9.47% 7%
Gross profit margin 5.92% 7.05% 7.43%
Paraphrase This Document
Need a fresh take? Get an instant paraphrase of this document with our AI Paraphraser
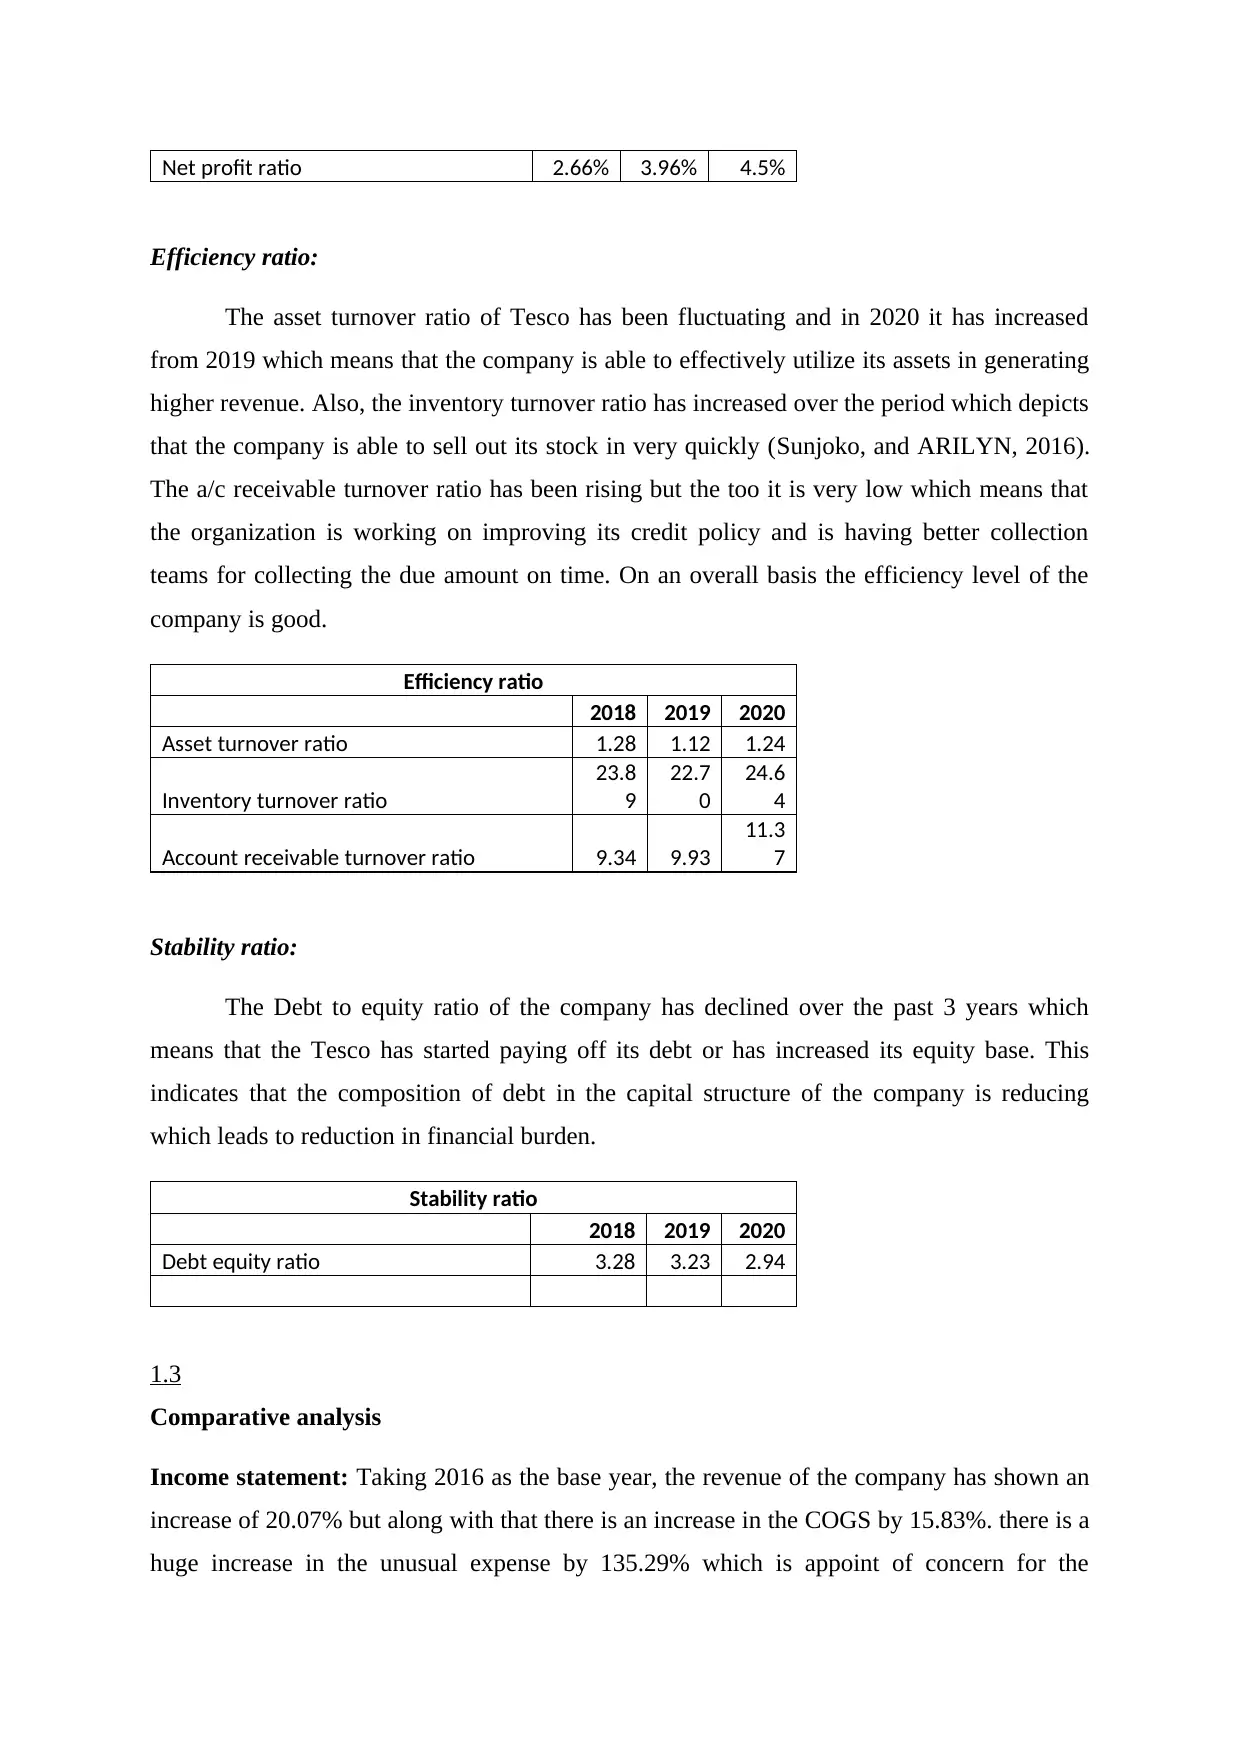
Net profit ratio 2.66% 3.96% 4.5%
Efficiency ratio:
The asset turnover ratio of Tesco has been fluctuating and in 2020 it has increased
from 2019 which means that the company is able to effectively utilize its assets in generating
higher revenue. Also, the inventory turnover ratio has increased over the period which depicts
that the company is able to sell out its stock in very quickly (Sunjoko, and ARILYN, 2016).
The a/c receivable turnover ratio has been rising but the too it is very low which means that
the organization is working on improving its credit policy and is having better collection
teams for collecting the due amount on time. On an overall basis the efficiency level of the
company is good.
Efficiency ratio
2018 2019 2020
Asset turnover ratio 1.28 1.12 1.24
Inventory turnover ratio
23.8
9
22.7
0
24.6
4
Account receivable turnover ratio 9.34 9.93
11.3
7
Stability ratio:
The Debt to equity ratio of the company has declined over the past 3 years which
means that the Tesco has started paying off its debt or has increased its equity base. This
indicates that the composition of debt in the capital structure of the company is reducing
which leads to reduction in financial burden.
Stability ratio
2018 2019 2020
Debt equity ratio 3.28 3.23 2.94
1.3
Comparative analysis
Income statement: Taking 2016 as the base year, the revenue of the company has shown an
increase of 20.07% but along with that there is an increase in the COGS by 15.83%. there is a
huge increase in the unusual expense by 135.29% which is appoint of concern for the
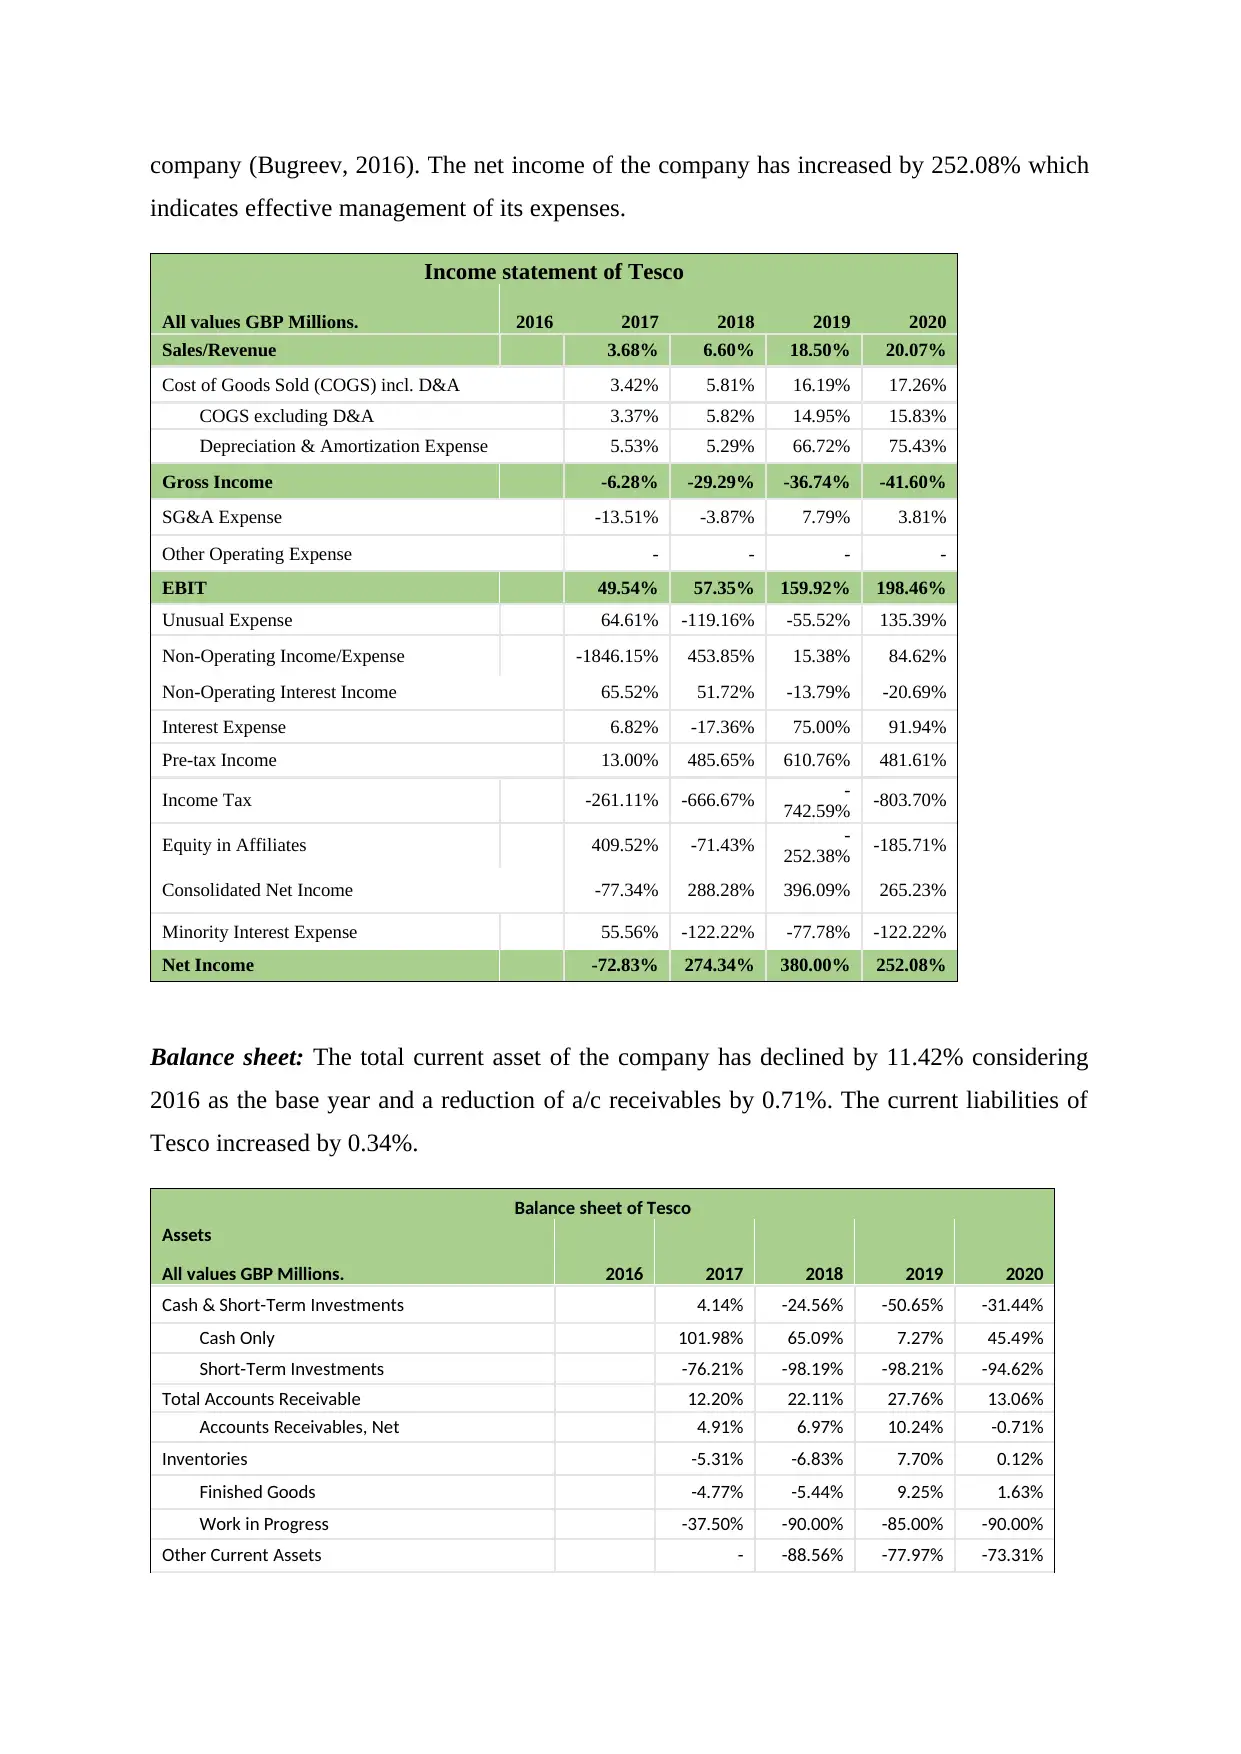
company (Bugreev, 2016). The net income of the company has increased by 252.08% which
indicates effective management of its expenses.
Income statement of Tesco
All values GBP Millions. 2016 2017 2018 2019 2020
Sales/Revenue 3.68% 6.60% 18.50% 20.07%
Cost of Goods Sold (COGS) incl. D&A 3.42% 5.81% 16.19% 17.26%
COGS excluding D&A 3.37% 5.82% 14.95% 15.83%
Depreciation & Amortization Expense 5.53% 5.29% 66.72% 75.43%
Gross Income -6.28% -29.29% -36.74% -41.60%
SG&A Expense -13.51% -3.87% 7.79% 3.81%
Other Operating Expense - - - -
EBIT 49.54% 57.35% 159.92% 198.46%
Unusual Expense 64.61% -119.16% -55.52% 135.39%
Non-Operating Income/Expense -1846.15% 453.85% 15.38% 84.62%
Non-Operating Interest Income 65.52% 51.72% -13.79% -20.69%
Interest Expense 6.82% -17.36% 75.00% 91.94%
Pre-tax Income 13.00% 485.65% 610.76% 481.61%
Income Tax -261.11% -666.67% -
742.59% -803.70%
Equity in Affiliates 409.52% -71.43% -
252.38% -185.71%
Consolidated Net Income -77.34% 288.28% 396.09% 265.23%
Minority Interest Expense 55.56% -122.22% -77.78% -122.22%
Net Income -72.83% 274.34% 380.00% 252.08%
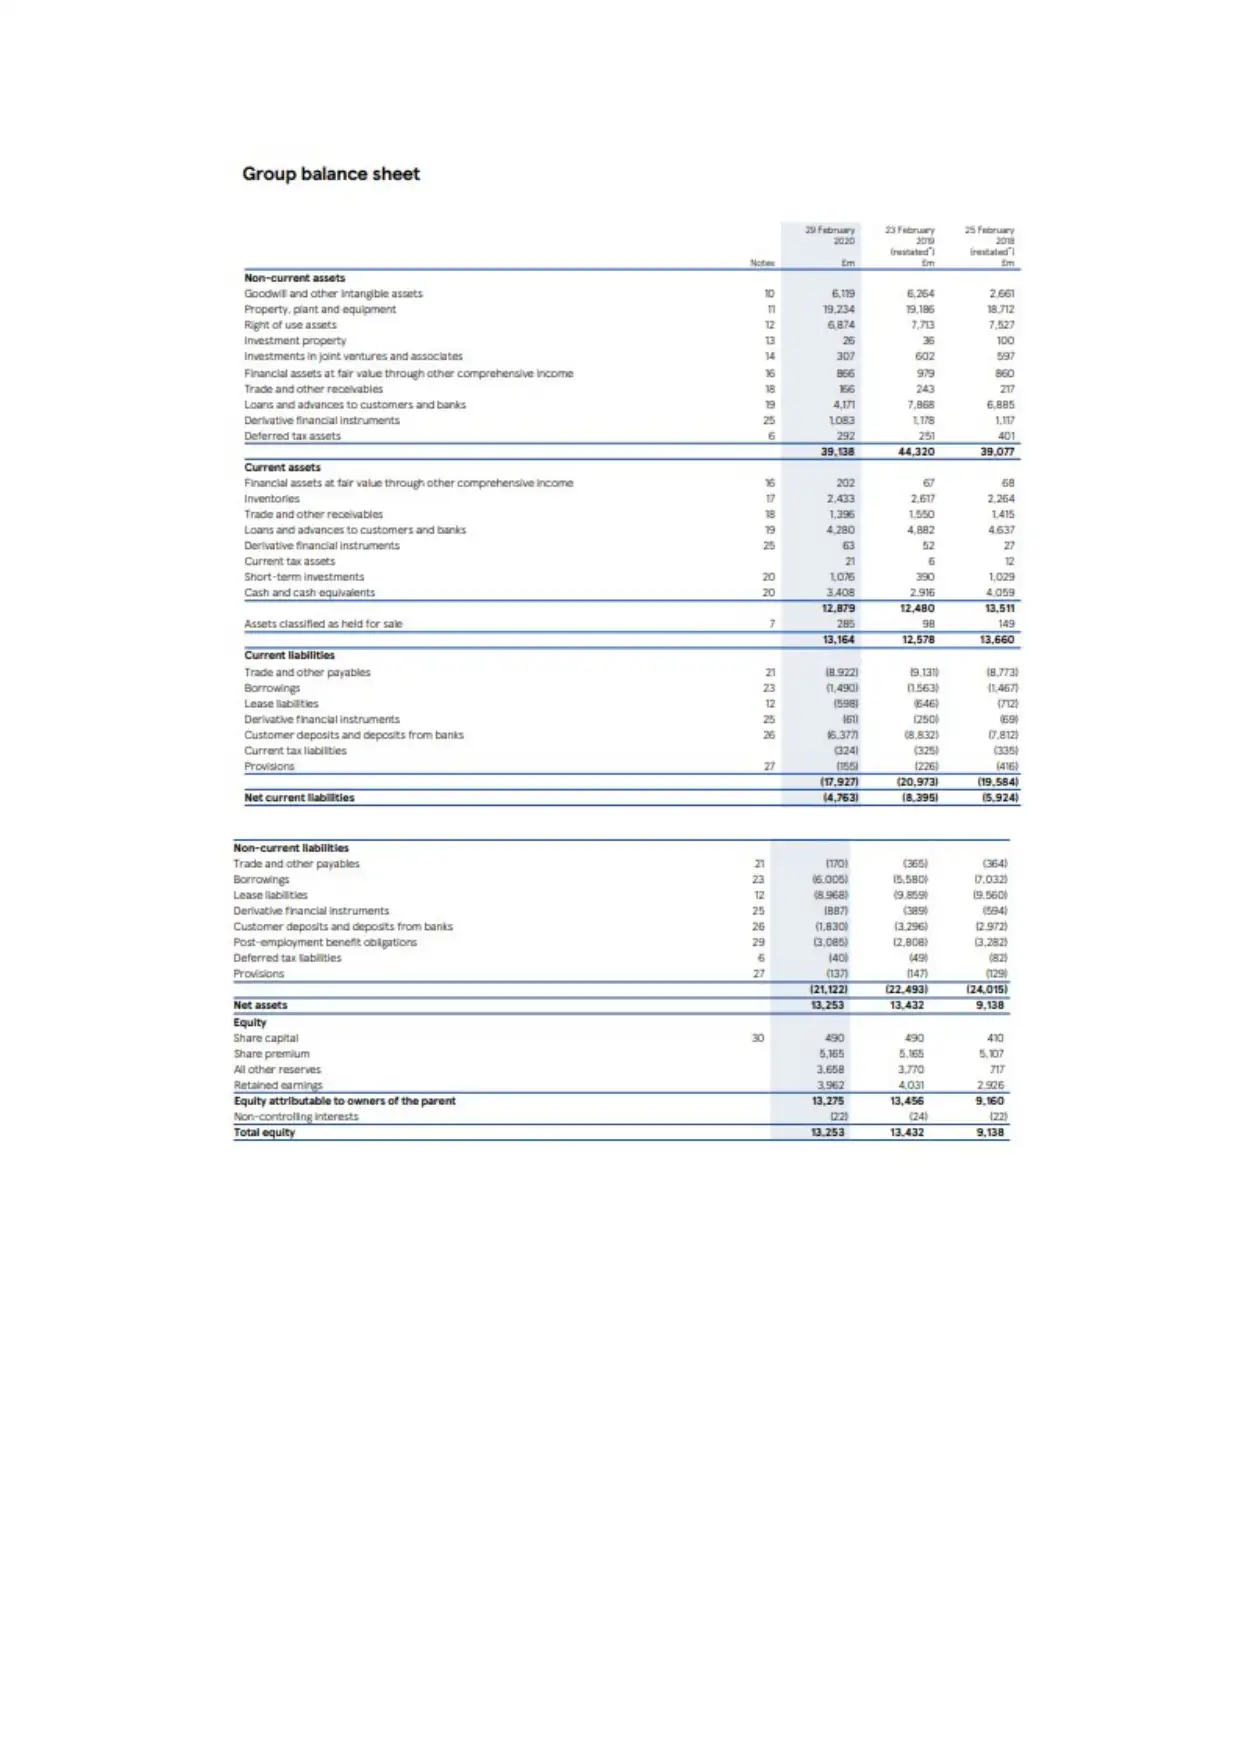
Balance sheet: The total current asset of the company has declined by 11.42% considering
2016 as the base year and a reduction of a/c receivables by 0.71%. The current liabilities of
Tesco increased by 0.34%.
Balance sheet of Tesco
Assets
All values GBP Millions. 2016 2017 2018 2019 2020
Cash & Short-Term Investments 4.14% -24.56% -50.65% -31.44%
Cash Only 101.98% 65.09% 7.27% 45.49%
Short-Term Investments -76.21% -98.19% -98.21% -94.62%
Total Accounts Receivable 12.20% 22.11% 27.76% 13.06%
Accounts Receivables, Net 4.91% 6.97% 10.24% -0.71%
Inventories -5.31% -6.83% 7.70% 0.12%
Finished Goods -4.77% -5.44% 9.25% 1.63%
Work in Progress -37.50% -90.00% -85.00% -90.00%
Other Current Assets - -88.56% -77.97% -73.31%
indicates effective management of its expenses.
Income statement of Tesco
All values GBP Millions. 2016 2017 2018 2019 2020
Sales/Revenue 3.68% 6.60% 18.50% 20.07%
Cost of Goods Sold (COGS) incl. D&A 3.42% 5.81% 16.19% 17.26%
COGS excluding D&A 3.37% 5.82% 14.95% 15.83%
Depreciation & Amortization Expense 5.53% 5.29% 66.72% 75.43%
Gross Income -6.28% -29.29% -36.74% -41.60%
SG&A Expense -13.51% -3.87% 7.79% 3.81%
Other Operating Expense - - - -
EBIT 49.54% 57.35% 159.92% 198.46%
Unusual Expense 64.61% -119.16% -55.52% 135.39%
Non-Operating Income/Expense -1846.15% 453.85% 15.38% 84.62%
Non-Operating Interest Income 65.52% 51.72% -13.79% -20.69%
Interest Expense 6.82% -17.36% 75.00% 91.94%
Pre-tax Income 13.00% 485.65% 610.76% 481.61%
Income Tax -261.11% -666.67% -
742.59% -803.70%
Equity in Affiliates 409.52% -71.43% -
252.38% -185.71%
Consolidated Net Income -77.34% 288.28% 396.09% 265.23%
Minority Interest Expense 55.56% -122.22% -77.78% -122.22%
Net Income -72.83% 274.34% 380.00% 252.08%
Balance sheet: The total current asset of the company has declined by 11.42% considering
2016 as the base year and a reduction of a/c receivables by 0.71%. The current liabilities of
Tesco increased by 0.34%.
Balance sheet of Tesco
Assets
All values GBP Millions. 2016 2017 2018 2019 2020
Cash & Short-Term Investments 4.14% -24.56% -50.65% -31.44%
Cash Only 101.98% 65.09% 7.27% 45.49%
Short-Term Investments -76.21% -98.19% -98.21% -94.62%
Total Accounts Receivable 12.20% 22.11% 27.76% 13.06%
Accounts Receivables, Net 4.91% 6.97% 10.24% -0.71%
Inventories -5.31% -6.83% 7.70% 0.12%
Finished Goods -4.77% -5.44% 9.25% 1.63%
Work in Progress -37.50% -90.00% -85.00% -90.00%
Other Current Assets - -88.56% -77.97% -73.31%
⊘ This is a preview!⊘
Do you want full access?
Subscribe today to unlock all pages.
Trusted by 1+ million students worldwide
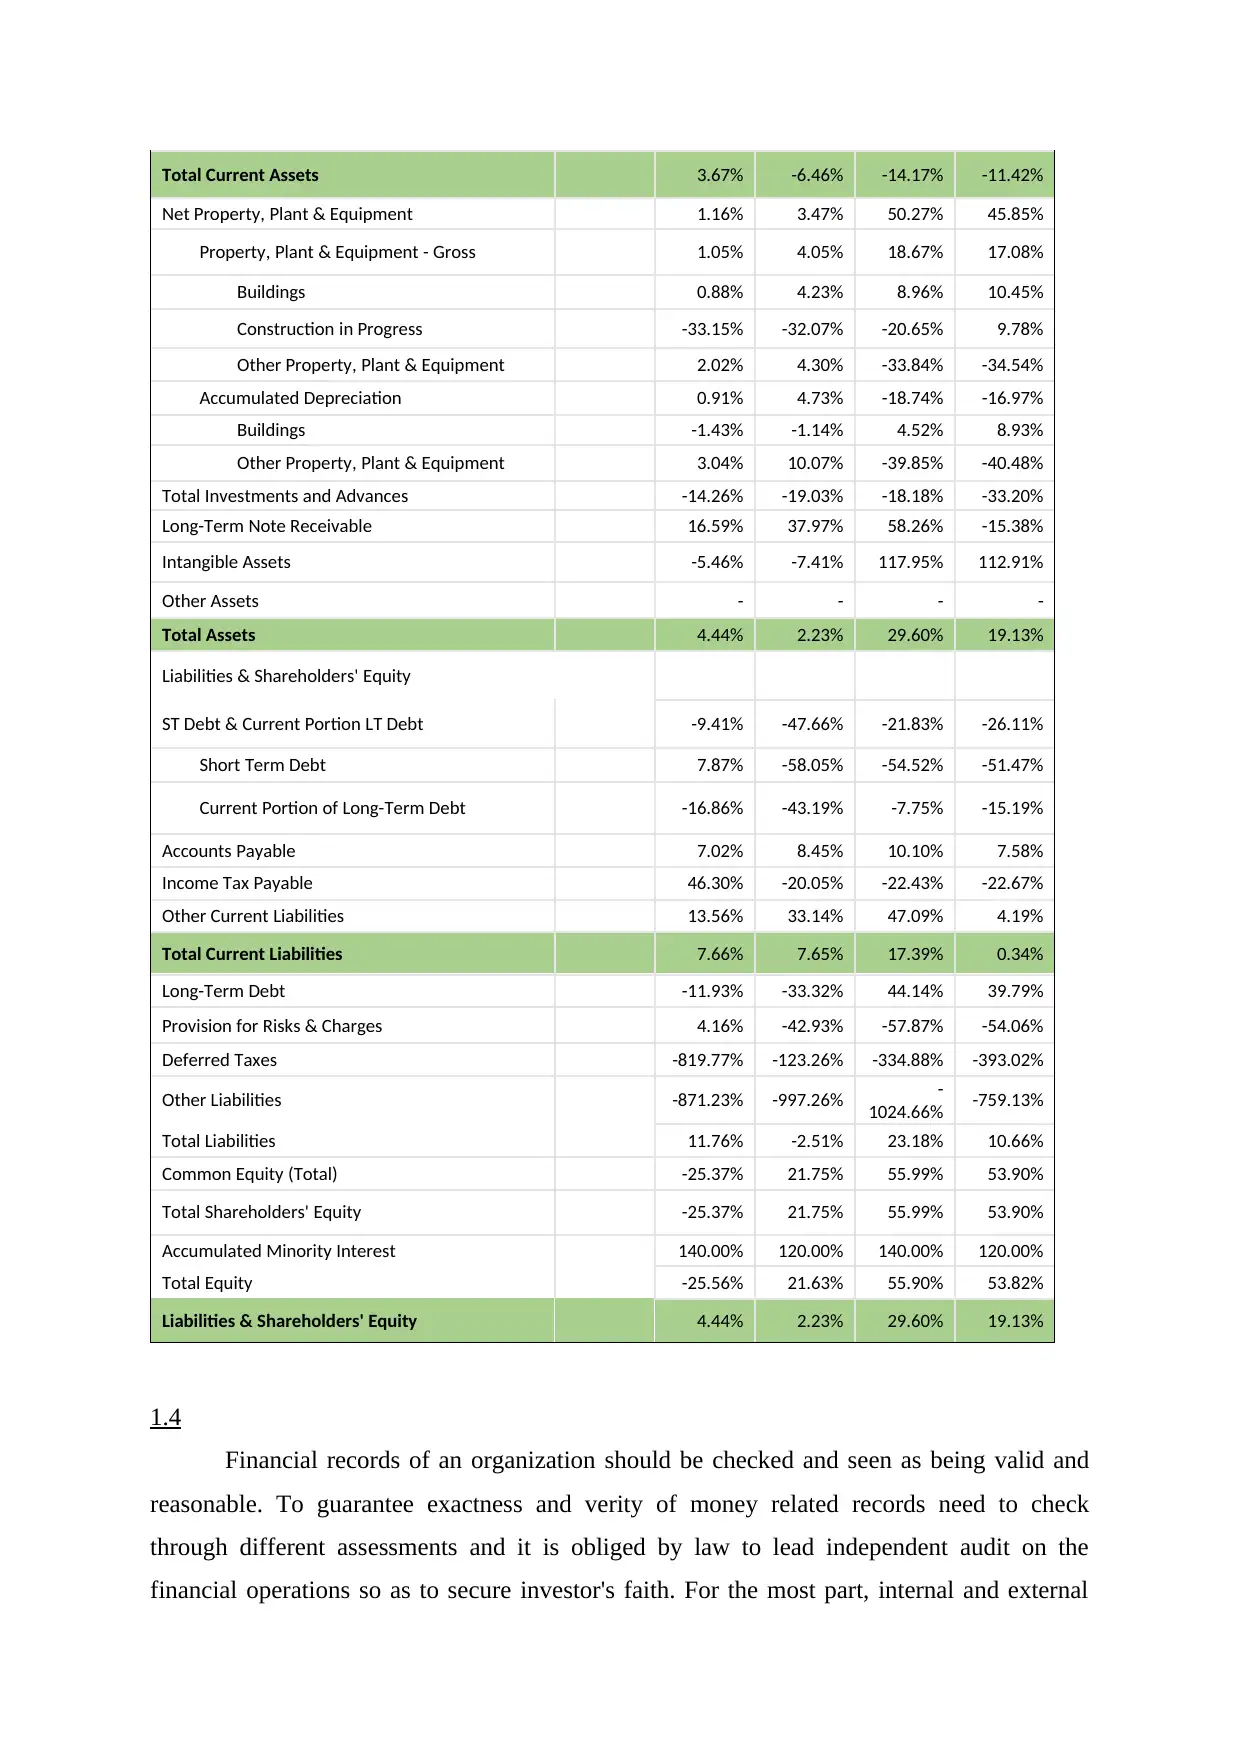
Total Current Assets 3.67% -6.46% -14.17% -11.42%
Net Property, Plant & Equipment 1.16% 3.47% 50.27% 45.85%
Property, Plant & Equipment - Gross 1.05% 4.05% 18.67% 17.08%
Buildings 0.88% 4.23% 8.96% 10.45%
Construction in Progress -33.15% -32.07% -20.65% 9.78%
Other Property, Plant & Equipment 2.02% 4.30% -33.84% -34.54%
Accumulated Depreciation 0.91% 4.73% -18.74% -16.97%
Buildings -1.43% -1.14% 4.52% 8.93%
Other Property, Plant & Equipment 3.04% 10.07% -39.85% -40.48%
Total Investments and Advances -14.26% -19.03% -18.18% -33.20%
Long-Term Note Receivable 16.59% 37.97% 58.26% -15.38%
Intangible Assets -5.46% -7.41% 117.95% 112.91%
Other Assets - - - -
Total Assets 4.44% 2.23% 29.60% 19.13%
Liabilities & Shareholders' Equity
ST Debt & Current Portion LT Debt -9.41% -47.66% -21.83% -26.11%
Short Term Debt 7.87% -58.05% -54.52% -51.47%
Current Portion of Long-Term Debt -16.86% -43.19% -7.75% -15.19%
Accounts Payable 7.02% 8.45% 10.10% 7.58%
Income Tax Payable 46.30% -20.05% -22.43% -22.67%
Other Current Liabilities 13.56% 33.14% 47.09% 4.19%
Total Current Liabilities 7.66% 7.65% 17.39% 0.34%
Long-Term Debt -11.93% -33.32% 44.14% 39.79%
Provision for Risks & Charges 4.16% -42.93% -57.87% -54.06%
Deferred Taxes -819.77% -123.26% -334.88% -393.02%
Other Liabilities -871.23% -997.26% -
1024.66% -759.13%
Total Liabilities 11.76% -2.51% 23.18% 10.66%
Common Equity (Total) -25.37% 21.75% 55.99% 53.90%
Total Shareholders' Equity -25.37% 21.75% 55.99% 53.90%
Accumulated Minority Interest 140.00% 120.00% 140.00% 120.00%
Total Equity -25.56% 21.63% 55.90% 53.82%
Liabilities & Shareholders' Equity 4.44% 2.23% 29.60% 19.13%
1.4
Financial records of an organization should be checked and seen as being valid and
reasonable. To guarantee exactness and verity of money related records need to check
through different assessments and it is obliged by law to lead independent audit on the
financial operations so as to secure investor's faith. For the most part, internal and external
Paraphrase This Document
Need a fresh take? Get an instant paraphrase of this document with our AI Paraphraser
reviewers (auditors) are answerable for guaranteeing precision and verity of money related
records. There are chances that the information presented in the financial records are
manipulated which result into depicting the wrong financial position and performance of the
business. Therefore, external auditing should be carried out.
Task 2
2.1
Budgeting plan gives extensive money related outline of planned organization
activity. An organization's targets budgeting plan is the general money related arrangement
demonstrating use of the accessible assets. Tesco’s financial plan is driven by the aims and
targets of the company along with what it can really achieve (Wang and Yao, 2017).
Numerous factors in a business can be planned which incorporates sales, yield, cost -
(variable and fixed), benefits, income, capital venture. Financial plan ought to be SMART,
that is, specific, feasible (measurable), achievable and reasonable, and with time bound or
else the budgeting will be inadequate.
Vital goal of Tesco is the principal factor that is required to be viewed as when
figuring budgeting plans in light of the fact that unaligned financial plan with vital aims and
objectives lead to disappointment. The subsequent stage of planning is recognizing the
limiting variable that the association is confronted with which is known as constraints which
might be a cut-off on the quantity of products a business could sell (demand is constraining
element) or on the quantity of hours a specific kind of workforce could work and so forth.
When association recognizes the limiting element, they set the budgetary guideline (Vidal-
Carreras, Garcia-Sabater and Garcia-Sabater, 2017). The subsequent stage is assessment and
coordination of inner elements for example abilities of representatives and assets and draft
departmental financial plan. After this progression, the association ought to evaluate the
outside affecting component, for example, estimated economic, political and global condition
which assists with limiting the risk associated with the financial plan. At last, organization
need to arrange the whole departmental budgeting plan for example sales plan, production
financial plan, material and labour spending plan, overhead budget which is called as the
master budget.
The master budget plan is a synopsis of an organization's arrangements that sets
explicit goals for the sales, manufacturing, appropriation and financing exercises which for
the most part comes full circle in a cash budgeting plan, a planned income statement and a
planned balance sheet report.
The master budget begins with sales anticipating which should be possible by top to
bottom investigation of past sales pattern, estimation made by the relevant business or
workforces, general monetary condition, contender's activities, change in the association's
costs, change in item mic, statistical surveying, publicizing and sales advancement plans.
Sales evaluating prompts the sales spending plan that is a definite timetable indicating the
expected sales for the spending time frame. It very well may be communicated in units and
money both. The sales financial plan is the fundamental pillar of the master budget (Marzlin
Marzuki and Ismail, 2019). The following financial plan is production budget which decides
amount of manufacturing relies on the quantity of units to be sold and upon the quantity of
units in the closure and opening inventories. Another segment of spending plan is material
budget plan which shows the amount and cost of buying material for planned production and
inventories. The labour budget shows the financial plan for all sort of work for example
skilled and unskilled which rely on the level of production. Another spending plan is the
overhead spending that shows amounts of an enormous number of items of expenses for
example compensation, power, lease, administrative costs. After this association get ready
projected income statement, balance sheet and the cash budget.
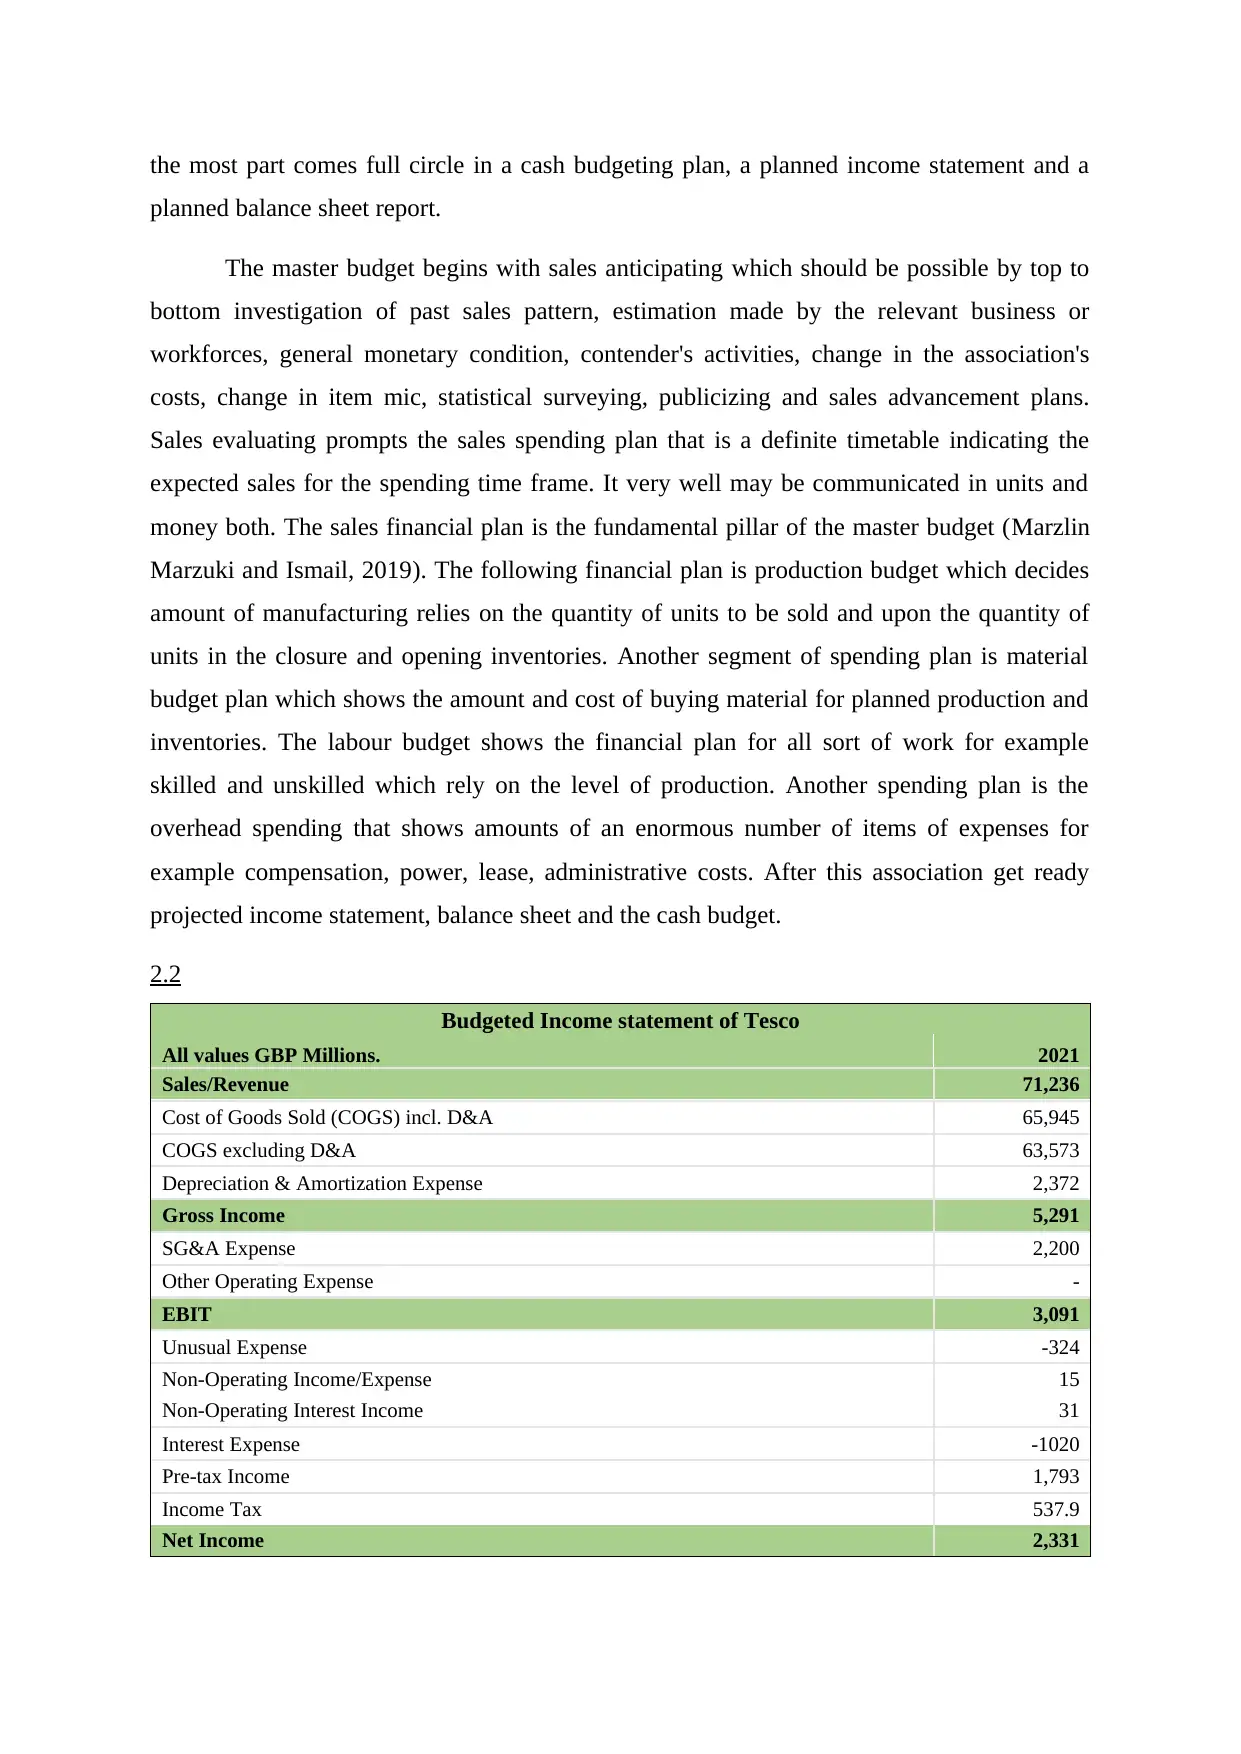
2.2
Budgeted Income statement of Tesco
All values GBP Millions. 2021
Sales/Revenue 71,236
Cost of Goods Sold (COGS) incl. D&A 65,945
COGS excluding D&A 63,573
Depreciation & Amortization Expense 2,372
Gross Income 5,291
SG&A Expense 2,200
Other Operating Expense -
EBIT 3,091
Unusual Expense -324
Non-Operating Income/Expense 15
Non-Operating Interest Income 31
Interest Expense -1020
Pre-tax Income 1,793
Income Tax 537.9
Net Income 2,331
planned balance sheet report.
The master budget begins with sales anticipating which should be possible by top to
bottom investigation of past sales pattern, estimation made by the relevant business or
workforces, general monetary condition, contender's activities, change in the association's
costs, change in item mic, statistical surveying, publicizing and sales advancement plans.
Sales evaluating prompts the sales spending plan that is a definite timetable indicating the
expected sales for the spending time frame. It very well may be communicated in units and
money both. The sales financial plan is the fundamental pillar of the master budget (Marzlin
Marzuki and Ismail, 2019). The following financial plan is production budget which decides
amount of manufacturing relies on the quantity of units to be sold and upon the quantity of
units in the closure and opening inventories. Another segment of spending plan is material
budget plan which shows the amount and cost of buying material for planned production and
inventories. The labour budget shows the financial plan for all sort of work for example
skilled and unskilled which rely on the level of production. Another spending plan is the
overhead spending that shows amounts of an enormous number of items of expenses for
example compensation, power, lease, administrative costs. After this association get ready
projected income statement, balance sheet and the cash budget.
2.2
Budgeted Income statement of Tesco
All values GBP Millions. 2021
Sales/Revenue 71,236
Cost of Goods Sold (COGS) incl. D&A 65,945
COGS excluding D&A 63,573
Depreciation & Amortization Expense 2,372
Gross Income 5,291
SG&A Expense 2,200
Other Operating Expense -
EBIT 3,091
Unusual Expense -324
Non-Operating Income/Expense 15
Non-Operating Interest Income 31
Interest Expense -1020
Pre-tax Income 1,793
Income Tax 537.9
Net Income 2,331
⊘ This is a preview!⊘
Do you want full access?
Subscribe today to unlock all pages.
Trusted by 1+ million students worldwide
1 out of 18
Related Documents


Your All-in-One AI-Powered Toolkit for Academic Success.
+13062052269
info@desklib.com
Available 24*7 on WhatsApp / Email
![[object Object]](/_next/static/media/star-bottom.7253800d.svg)
Unlock your academic potential
Copyright © 2020–2026 A2Z Services. All Rights Reserved. Developed and managed by ZUCOL.