University of Bedfordshire: Corporate Finance Analysis of Netflix
VerifiedAdded on 2022/09/06
|17
|3821
|13
Report
AI Summary
This report provides a comprehensive financial analysis of Netflix, examining its capital structure, dividend policies, and corporate strategies based on its 2018 annual report and market data. The analysis includes an overview of Netflix's background, tracing its evolution from DVD rentals to a global media streaming leader. It delves into the company's capital structure, highlighting its increasing reliance on debt financing and analyzing its cost of capital. The report also explores Netflix's dividend policy, which has maintained a 0.00% dividend payout ratio in recent years. Furthermore, the report assesses capital needs and financing decisions, proposing a balanced approach to raising capital through a mix of equity and debt. Investment appraisal techniques, including Net Present Value (NPV), Internal Rate of Return (IRR), Discounted Payback Period, Accounting Rate of Return, and Profitability Index are discussed. Finally, the report concludes with a summary of the company's financial strengths and weaknesses, offering recommendations for improving financial and operational performance. This detailed analysis provides valuable insights into Netflix's financial health and strategic decision-making.
Running head: CORPORATE FINANCE
Corporate Finance
Name of the Student:
Name of the University:
Author’s Note:
Corporate Finance
Name of the Student:
Name of the University:
Author’s Note:
Paraphrase This Document
Need a fresh take? Get an instant paraphrase of this document with our AI Paraphraser
1CORPORATE FINANCE
Executive Summary:
This report is prepared to analysis the financial and operational performance of the Netflix a
listed company along with an analysis of its capital structure and dividend policies. Corporate
finance discuses about the capital structure, dividend policies and corporate strategies which
aims at maximising the shareholders’ wealth and helps in achieving the mission and vision of
the company. In this report the capital structure, dividend policies and corporate strategies of
the Netflix have been analysed taking information from the 2018 Annual report of the Netflix
along with some market related information. An in-depth analysis of the financial strategies
and comparative performance of the company has been conducted to find the investment
opportunities and challenges for the company. Various financing strategies have been
analysed and suggested for financing such investment and expansion opportunities for the
company. Though Netflix has been performing well financially for the last few years, still
there are some expansion opportunities which can be explored further. Lastly, the report
concludes with outlining the financial strength and weaknesses of the company along with
certain recommendations for improvement in the financial and operational performance of
the company.
2CORPORATE FINANCE
Table of Contents
1. Introduction:...........................................................................................................................3
2. Background to the company:.................................................................................................3
3. Analysis of capital structure and dividend policy of the Netflix:..........................................5
4. Capital needs and financing decisions:..................................................................................7
5. Application of the investment appraisal techniques:.............................................................9
Net present value method:....................................................................................................11
Internal rate of return method:.............................................................................................12
Discounted payback period method:....................................................................................12
Accounting rate of return method:.......................................................................................12
Profitability index method:..................................................................................................13
6. Conclusion and recommendation:........................................................................................13
References and bibliography:...................................................................................................15
⊘ This is a preview!⊘
Do you want full access?
Subscribe today to unlock all pages.
Trusted by 1+ million students worldwide
3CORPORATE FINANCE
1. Introduction:
Corporate finance is a special branch of financial accounting and financial
management, which discusses about the need of capital for a company, sources of raising
capital and ensures its efficient utilisation towards achieving the objective of shareholders’
wealth maximisation. Every business organizations require capital to finance their investment
activities and to run their business with sustainability. Selection of such sources of capital
which will be minimizing the overall cost of capital and will help in maximising the
shareholders’ wealth is known as capital structure. In the next stage, investment of funds in
better investment opportunities is known as the capital budgeting and lastly, decisions
relating to the dividend pay-out is known as the dividend policy. Dividend policies also have
an immense importance in corporate strategies as it is directly related with the own sources of
capital (Yapa 2017).
In this report the need for capital and its sources for the Netflix have been analysed
based on the information available in their 2018 annual report. Based on last few years’
dividend pay-outs, the dividend policies of the Netflix has been analysed and the overall
corporate strategies have been analysed to arrive at a conclusion about the financial
performance and financial position of the company(Liand Trutnevyte2017).
2. Background to the company:
Netflix Inc. is an American company providing media services across the world. The
company was founded in the year 1997 with their primary service of providing video
streaming on a paid subscription basis. Later on with its success in the media services
industry, it become one of the leader in the media service industry across the world. They
kept their business patter same as it was started with earlier. As of 2019 they had more than
Paraphrase This Document
Need a fresh take? Get an instant paraphrase of this document with our AI Paraphraser
4CORPORATE FINANCE
148 million subscriptions across the world. The company was listed as one of the fortune 500
companies in the year 208 in United States for their highest revenue(In.finance.yahoo.com
2019).
Initially they started their business with DVD sales and DVD rentals, later on with the
advancement and revolution in the technologies, they completely switched over to the online
video and media streaming business. It can be traced back to 1999 when they started the
media streaming business with the concept of paid subscription and in the year 2000 they
dropped the DVD rental model of their business. In that year with a drastic fall in their
operating and financial performance, they were offer with $50 million for acquisition by the
Blockbuster. They refused the proposal and experienced a rapid growth in their financial and
operation performance in the year 2001 with an increase in the paid subscription.
In May 2002, they went for initial public offering of their common stocks with a
volume of 5.5 million shares at an initial price of $15 per share. In the same year, in the
month of June they again issued additional 825,000 shares to raise more capital to finance
their business with an objective of global reach of their business. After making loss for last
few consecutive years, they reported a profit of $6.5 million in the year 2003 from a revenue
of $272 million.
In the year 2005 Netflix acquired several movie rights and they designed and
developed the box and service and were ready to going public for offering the service, but
with the inspiration from the You Tube, they scrapped their concept of hardware based and
high content based movie renting service and planned to introduce the service of video on
demand. In 2007 they moved away from their business of DVD rentals and executed their
plan to provide video on demand through internet. From 2006 to 2011, their DVD sales
5CORPORATE FINANCE
decreased and with the increase in their online subscriptions for video on demand, they grew
up and made a worldwide presence (In.finance.yahoo.com 2019).
In 2014 the company reached to the 50 million global subscriptions and a 32.3%
market share in the United States video streaming industry. In that year they had been
operating in more than 41 countries, but still then they had most of the subscriptions from the
United States only. Almost 70% of their total subscribers were from United States. Hence,
they had to change and revise their marketing and corporate strategies to reach out to the
global market actually. In 2016 they announced an expansion of their services to 150 more
countries. In 2016 they increased their security measures and improved their services with a
remark of 74.8 million global subscriptions and in the next year it reached a subscription of
more than 100 million.
With the growth in their market share and improvement in their services, the market
capitalisation of the company crossed the $100 billion figure and their market price per share
surged to a high of $301.05 which was beyond their 12 months target. Therefore, the
company started with the objective of providing high quality media services initially through
the DVD sales and rental, and they changed their strategies timely with the change in
scenarios and improvement and advancement with the technologies. It paved the way for
their success and now, the Netflix can be considered as one of the global leader in
subscription based media streaming business.
3. Analysis of capital structure and dividend policy of the Netflix:
Capital structure is the combination of debt capital and equity capital in the total
capital base of the company. For use of capital, every company have to pay certain amount of
consideration, which is known as the cost of capital (Yapa 2017). An efficient capital
structure ensures the minimum overall cost of capital. Netflix is a global company and a
⊘ This is a preview!⊘
Do you want full access?
Subscribe today to unlock all pages.
Trusted by 1+ million students worldwide
6CORPORATE FINANCE
leader in the online media streaming industry. In the year 2002 they went for public offering
of their shares for the first time and raised total capital of $82.5 million as equity share
capital. Late on in the same year they raised additional $12.38 million equity share capital
through the issue of additional 825,000 equity shares. From the 2018 annual report of the
Netflix, it can be observed that the company is having a total debt capital of 10.36 billion and
a total equity capital of $5.24 billion. Hence, they are having a highly leveraged capital
structure. It can further be observed that, they have raised debt capital of $1 billion in the year
2016, 3.02 billion in the year 2017 and again they had raised $3.96 billion of debt capital in
the year 2018, whereas, proceeds from equity financing was only $36.97 million in the year
2016, $88.38 million in the year 2017 and $124.50 million in the year
2018(In.finance.yahoo.com 2019).
In the last three years, starting from 2016 to 2018, they met their financing needs
mostly through the issue of debt capital and a very small amount was from the equity issue.
Behind such a strategic decision of increasing more leverage in the capital structure might be
driven by the objective of minimisation of the cost of capital. Therefore an analysis of the
cost of capital is important which is presented as follows (In.finance.yahoo.com 2019).
It can be observed from the 2018 annual report and market information, that the
dividend yield for the company is 0.00% for the years starting from 2014 to 2018. It means
the dividend pay-out ratio of the company is 0.00% for the last three years. Therefore,
considering 2% risk free rate and risk coefficient of the company 1.30, the cost of equity
capital can be computed using the CAPM model. The after tax cost of debt can be computed
taking the total interest expenses and the long term debt with an assumption of 30% tax rate.
Then, the weighted average cost of capital have been computed considering the book value of
the equity and the book value of the long term as the weights for the equity capital and debt
capital. Though, there is no capital yield for the last three years, the risk free rate added up
Paraphrase This Document
Need a fresh take? Get an instant paraphrase of this document with our AI Paraphraser
7CORPORATE FINANCE
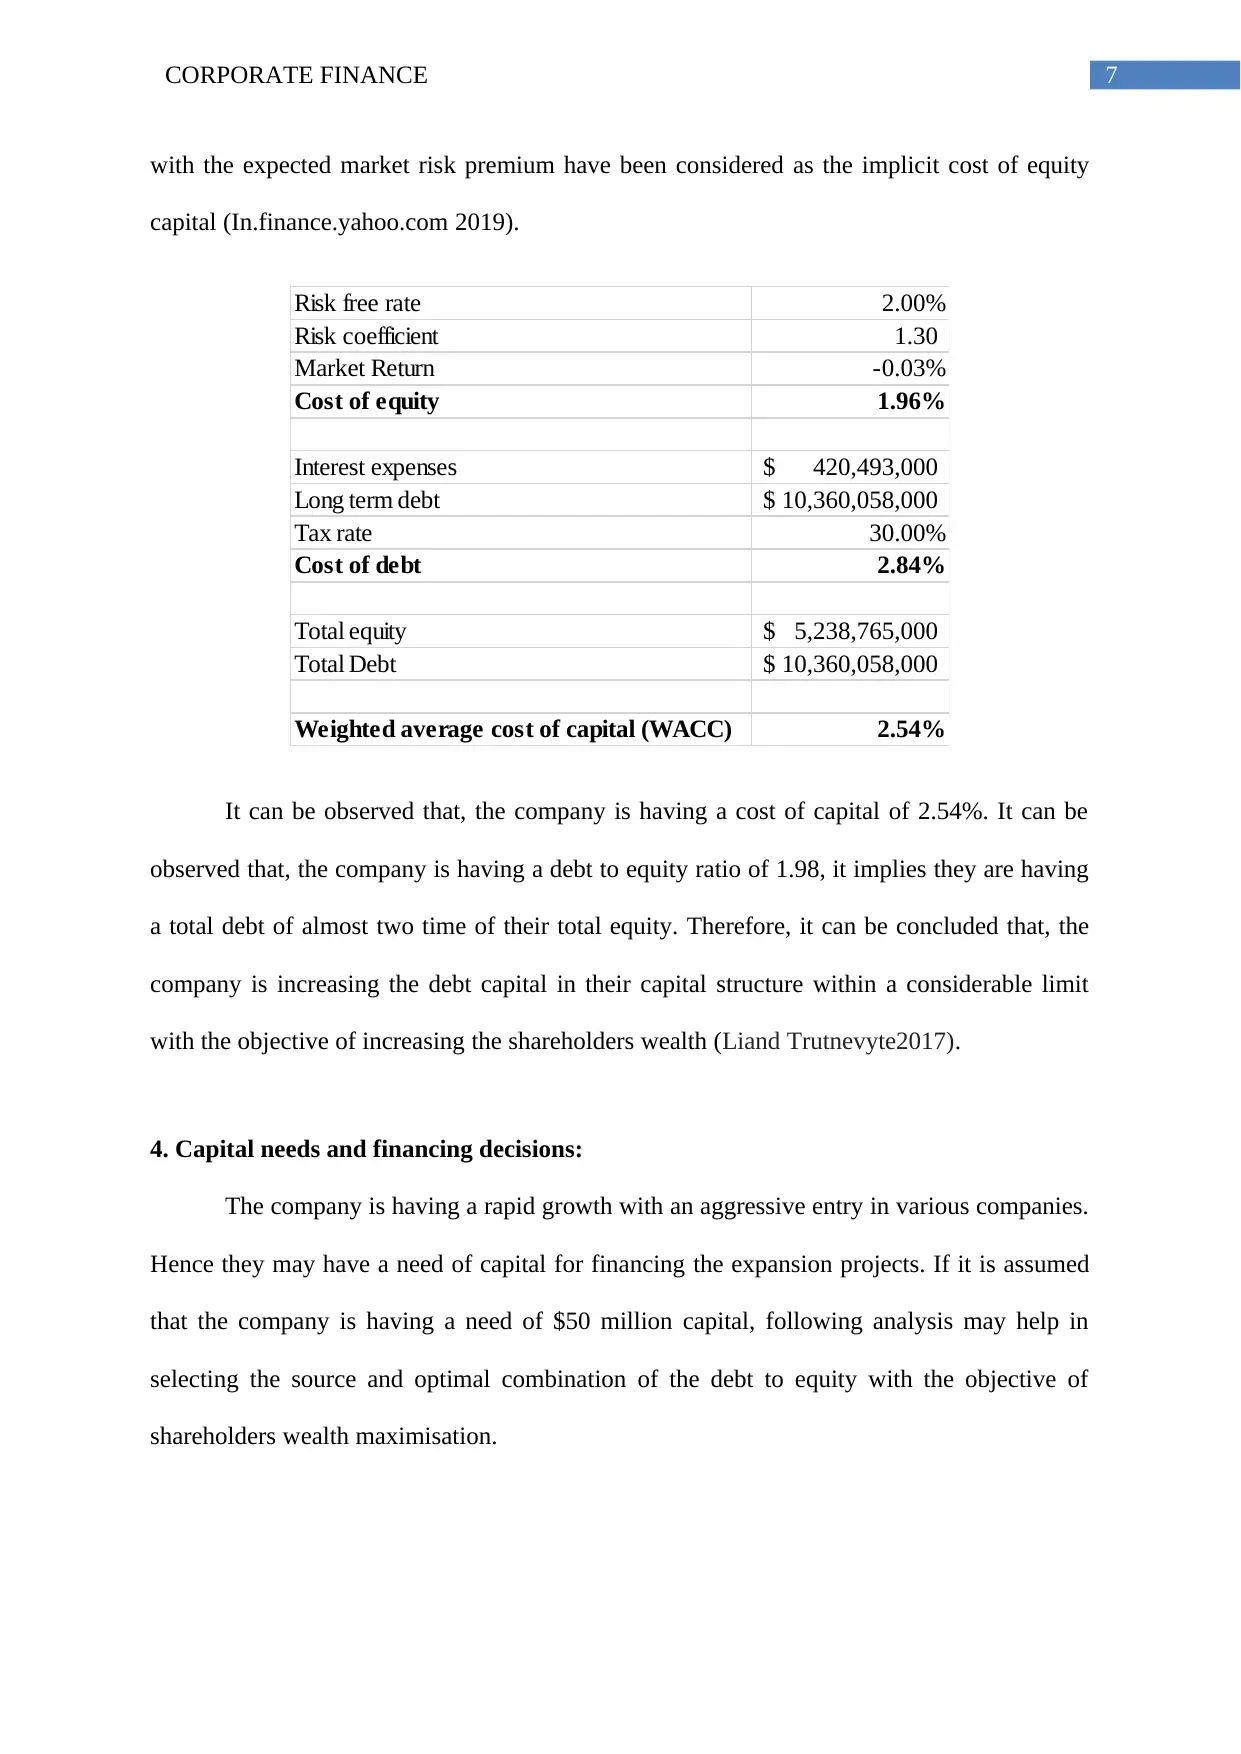
with the expected market risk premium have been considered as the implicit cost of equity
capital (In.finance.yahoo.com 2019).
Risk free rate 2.00%
Risk coefficient 1.30
Market Return -0.03%
Cost of equity 1.96%
Interest expenses 420,493,000$
Long term debt 10,360,058,000$
Tax rate 30.00%
Cost of debt 2.84%
Total equity 5,238,765,000$
Total Debt 10,360,058,000$
Weighted average cost of capital (WACC) 2.54%
It can be observed that, the company is having a cost of capital of 2.54%. It can be
observed that, the company is having a debt to equity ratio of 1.98, it implies they are having
a total debt of almost two time of their total equity. Therefore, it can be concluded that, the
company is increasing the debt capital in their capital structure within a considerable limit
with the objective of increasing the shareholders wealth (Liand Trutnevyte2017).
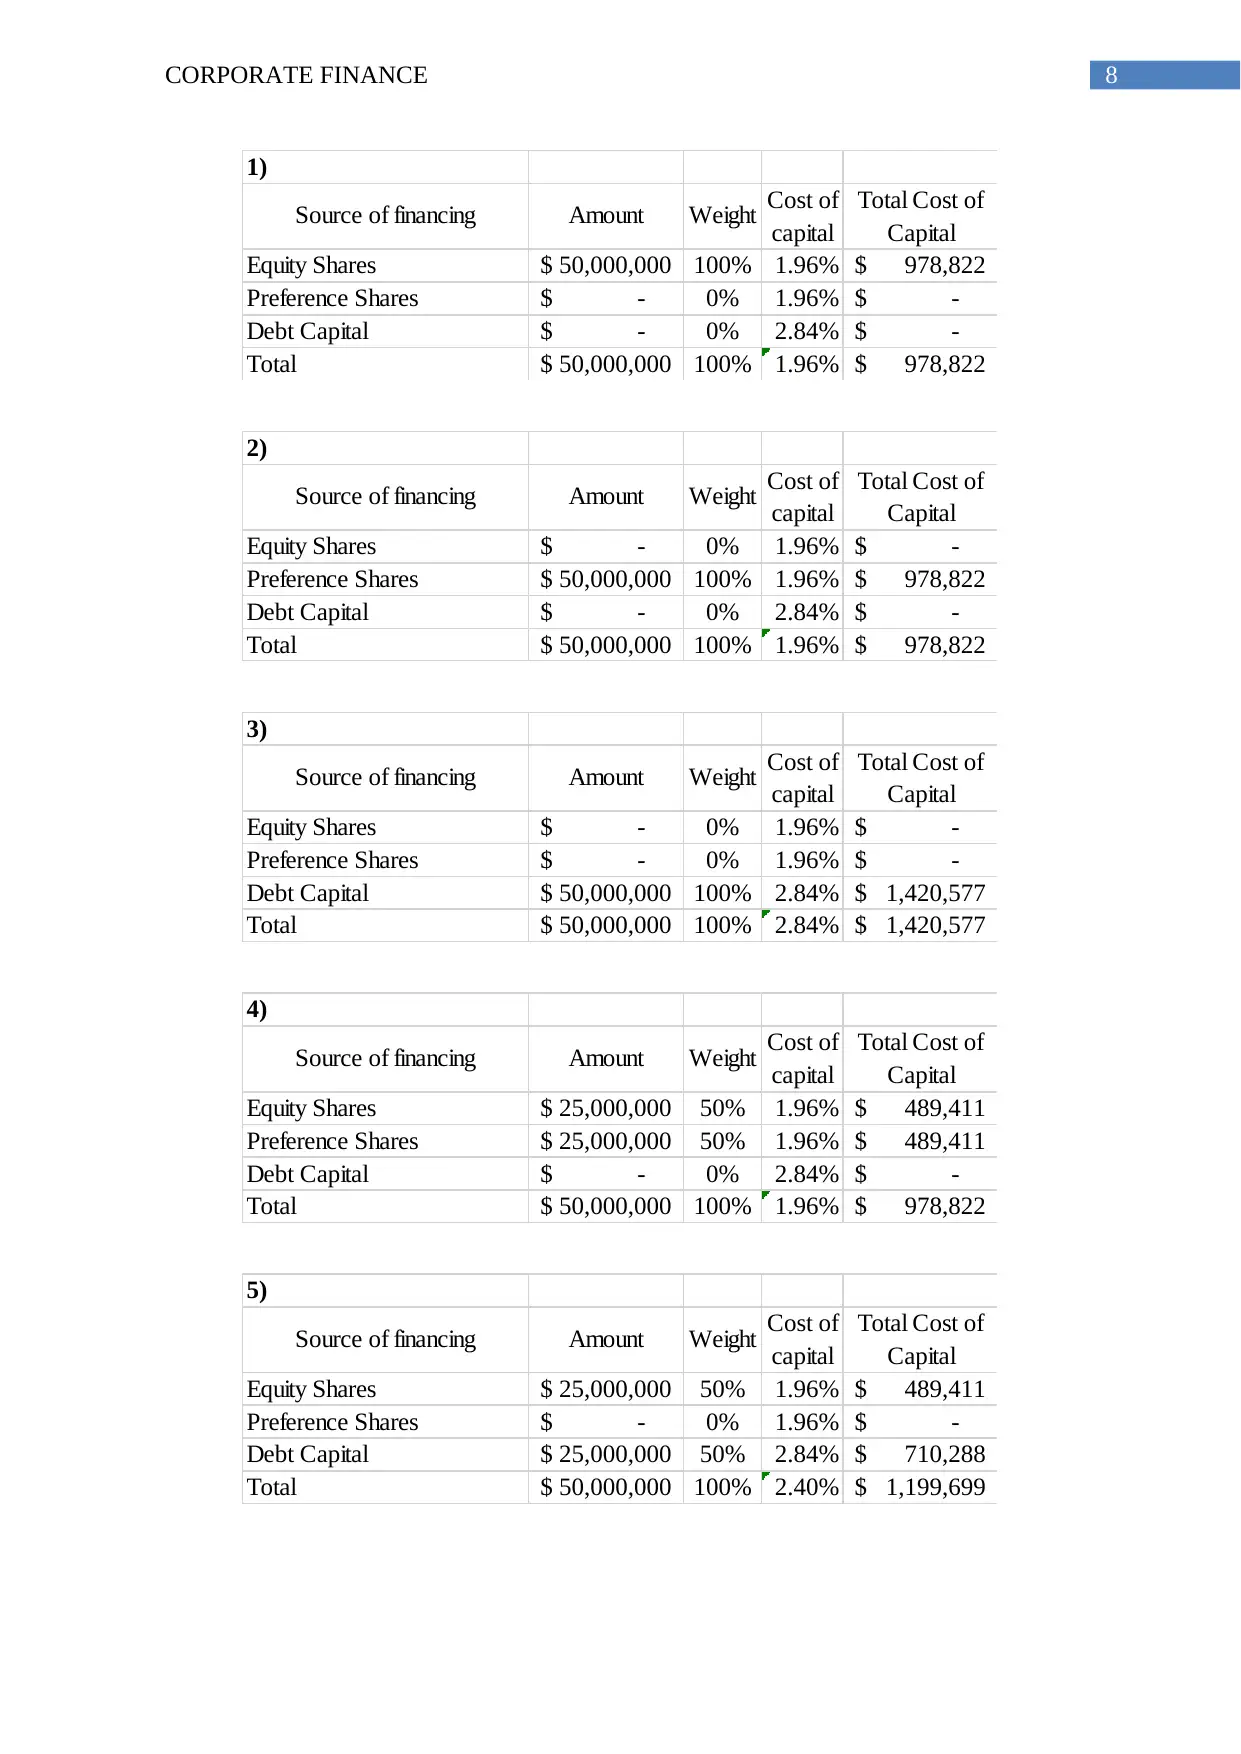
4. Capital needs and financing decisions:
The company is having a rapid growth with an aggressive entry in various companies.
Hence they may have a need of capital for financing the expansion projects. If it is assumed
that the company is having a need of $50 million capital, following analysis may help in
selecting the source and optimal combination of the debt to equity with the objective of
shareholders wealth maximisation.
with the expected market risk premium have been considered as the implicit cost of equity
capital (In.finance.yahoo.com 2019).
Risk free rate 2.00%
Risk coefficient 1.30
Market Return -0.03%
Cost of equity 1.96%
Interest expenses 420,493,000$
Long term debt 10,360,058,000$
Tax rate 30.00%
Cost of debt 2.84%
Total equity 5,238,765,000$
Total Debt 10,360,058,000$
Weighted average cost of capital (WACC) 2.54%
It can be observed that, the company is having a cost of capital of 2.54%. It can be
observed that, the company is having a debt to equity ratio of 1.98, it implies they are having
a total debt of almost two time of their total equity. Therefore, it can be concluded that, the
company is increasing the debt capital in their capital structure within a considerable limit
with the objective of increasing the shareholders wealth (Liand Trutnevyte2017).
4. Capital needs and financing decisions:
The company is having a rapid growth with an aggressive entry in various companies.
Hence they may have a need of capital for financing the expansion projects. If it is assumed
that the company is having a need of $50 million capital, following analysis may help in
selecting the source and optimal combination of the debt to equity with the objective of
shareholders wealth maximisation.
8CORPORATE FINANCE
1)
Source of financing Amount Weight Cost of
capital
Total Cost of
Capital
Equity Shares 50,000,000$ 100% 1.96% 978,822$
Preference Shares -$ 0% 1.96% -$
Debt Capital -$ 0% 2.84% -$
Total 50,000,000$ 100% 1.96% 978,822$
2)
Source of financing Amount Weight Cost of
capital
Total Cost of
Capital
Equity Shares -$ 0% 1.96% -$
Preference Shares 50,000,000$ 100% 1.96% 978,822$
Debt Capital -$ 0% 2.84% -$
Total 50,000,000$ 100% 1.96% 978,822$
3)
Source of financing Amount Weight Cost of
capital
Total Cost of
Capital
Equity Shares -$ 0% 1.96% -$
Preference Shares -$ 0% 1.96% -$
Debt Capital 50,000,000$ 100% 2.84% 1,420,577$
Total 50,000,000$ 100% 2.84% 1,420,577$
4)
Source of financing Amount Weight Cost of
capital
Total Cost of
Capital
Equity Shares 25,000,000$ 50% 1.96% 489,411$
Preference Shares 25,000,000$ 50% 1.96% 489,411$
Debt Capital -$ 0% 2.84% -$
Total 50,000,000$ 100% 1.96% 978,822$
5)
Source of financing Amount Weight Cost of
capital
Total Cost of
Capital
Equity Shares 25,000,000$ 50% 1.96% 489,411$
Preference Shares -$ 0% 1.96% -$
Debt Capital 25,000,000$ 50% 2.84% 710,288$
Total 50,000,000$ 100% 2.40% 1,199,699$
⊘ This is a preview!⊘
Do you want full access?
Subscribe today to unlock all pages.
Trusted by 1+ million students worldwide
9CORPORATE FINANCE
From the above analysis it can be observed that, the company is having low cost of
equity than the cost of debt. Therefore, from the perspective of cost of capital, it is beneficial
for the company to raise the additional capital through the equity issue (Liand
Trutnevyte2017). On the other hand, raising additional capital through the debt capital may
increase the proportion of debt in the total capital structure of the company, but it will not
dilute the ownership of the company. Hence, from the perspective of the shareholders wealth
maximisation, it is beneficial for the company to raise additional capital through the debt
capital. On the other hand, the interest payment is tax deductible; hence, debt capital will give
an additional tax benefit to the company.
As the company is already having a high leverage, it can be recommended for the
company to raise 50% from the equity issue and 50% from the debt issue, which will make a
neutral effect on the liquidity of the company with an potential increase in the shareholders
wealth.
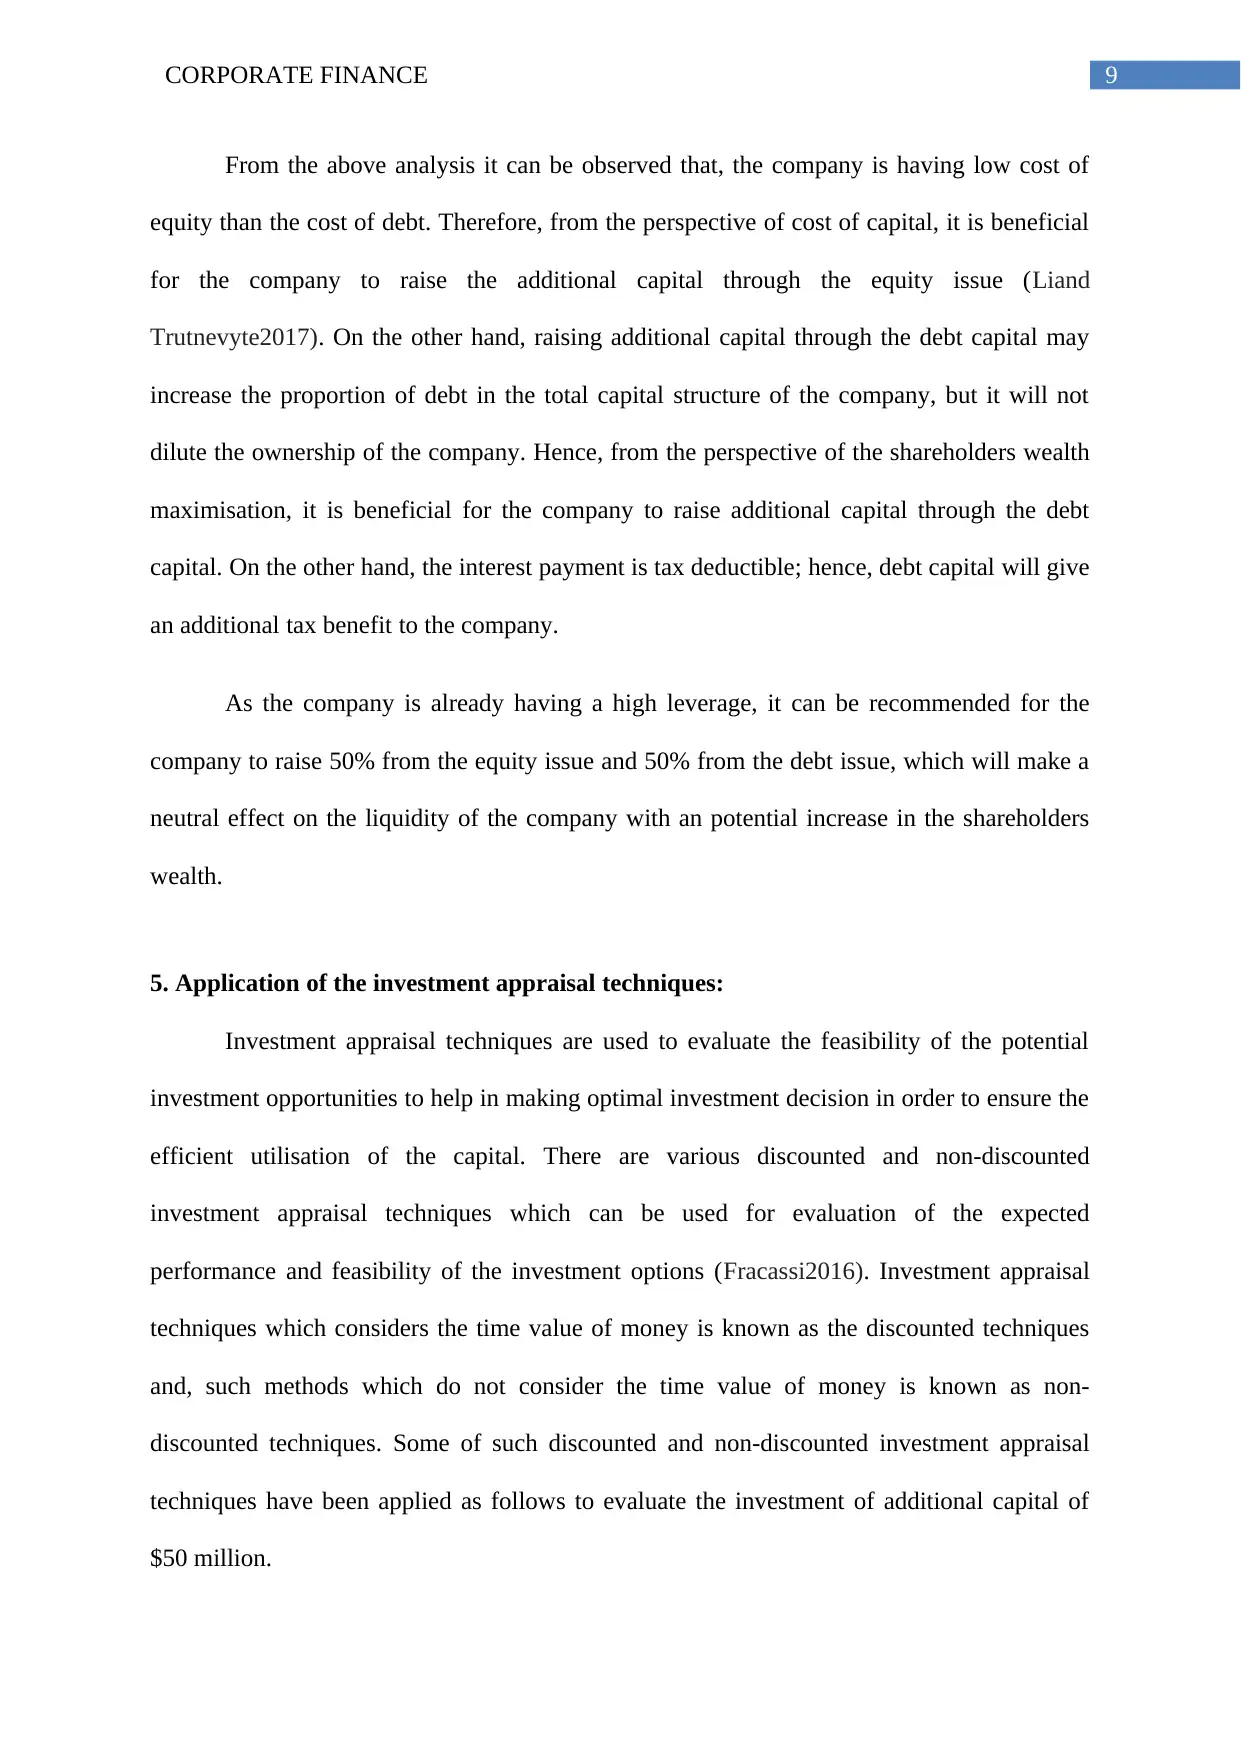
5. Application of the investment appraisal techniques:
Investment appraisal techniques are used to evaluate the feasibility of the potential
investment opportunities to help in making optimal investment decision in order to ensure the
efficient utilisation of the capital. There are various discounted and non-discounted
investment appraisal techniques which can be used for evaluation of the expected
performance and feasibility of the investment options (Fracassi2016). Investment appraisal
techniques which considers the time value of money is known as the discounted techniques
and, such methods which do not consider the time value of money is known as non-
discounted techniques. Some of such discounted and non-discounted investment appraisal
techniques have been applied as follows to evaluate the investment of additional capital of
$50 million.
From the above analysis it can be observed that, the company is having low cost of
equity than the cost of debt. Therefore, from the perspective of cost of capital, it is beneficial
for the company to raise the additional capital through the equity issue (Liand
Trutnevyte2017). On the other hand, raising additional capital through the debt capital may
increase the proportion of debt in the total capital structure of the company, but it will not
dilute the ownership of the company. Hence, from the perspective of the shareholders wealth
maximisation, it is beneficial for the company to raise additional capital through the debt
capital. On the other hand, the interest payment is tax deductible; hence, debt capital will give
an additional tax benefit to the company.
As the company is already having a high leverage, it can be recommended for the
company to raise 50% from the equity issue and 50% from the debt issue, which will make a
neutral effect on the liquidity of the company with an potential increase in the shareholders
wealth.
5. Application of the investment appraisal techniques:
Investment appraisal techniques are used to evaluate the feasibility of the potential
investment opportunities to help in making optimal investment decision in order to ensure the
efficient utilisation of the capital. There are various discounted and non-discounted
investment appraisal techniques which can be used for evaluation of the expected
performance and feasibility of the investment options (Fracassi2016). Investment appraisal
techniques which considers the time value of money is known as the discounted techniques
and, such methods which do not consider the time value of money is known as non-
discounted techniques. Some of such discounted and non-discounted investment appraisal
techniques have been applied as follows to evaluate the investment of additional capital of
$50 million.
Paraphrase This Document
Need a fresh take? Get an instant paraphrase of this document with our AI Paraphraser
10CORPORATE FINANCE
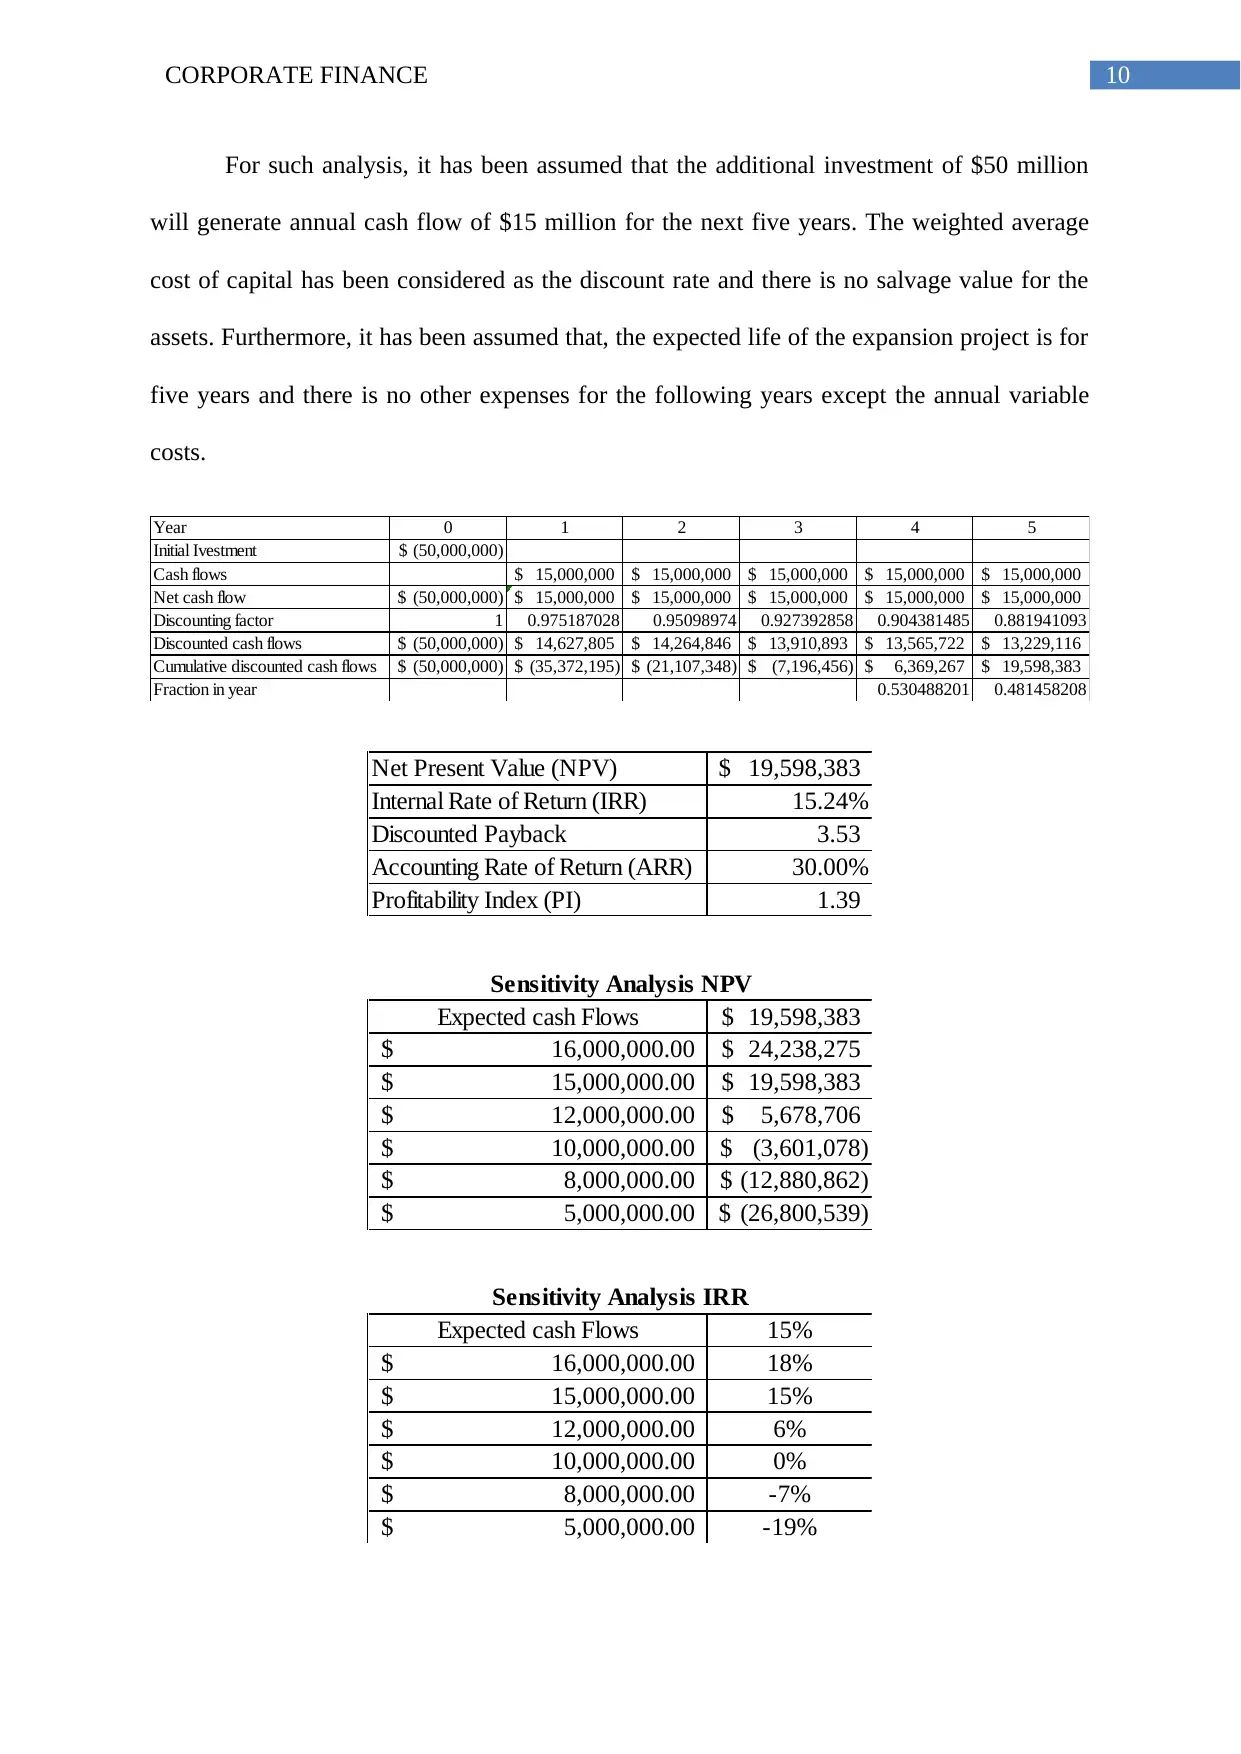
For such analysis, it has been assumed that the additional investment of $50 million
will generate annual cash flow of $15 million for the next five years. The weighted average
cost of capital has been considered as the discount rate and there is no salvage value for the
assets. Furthermore, it has been assumed that, the expected life of the expansion project is for
five years and there is no other expenses for the following years except the annual variable
costs.
Year 0 1 2 3 4 5
Initial Ivestment (50,000,000)$
Cash flows 15,000,000$ 15,000,000$ 15,000,000$ 15,000,000$ 15,000,000$
Net cash flow (50,000,000)$ 15,000,000$ 15,000,000$ 15,000,000$ 15,000,000$ 15,000,000$
Discounting factor 1 0.975187028 0.95098974 0.927392858 0.904381485 0.881941093
Discounted cash flows (50,000,000)$ 14,627,805$ 14,264,846$ 13,910,893$ 13,565,722$ 13,229,116$
Cumulative discounted cash flows (50,000,000)$ (35,372,195)$ (21,107,348)$ (7,196,456)$ 6,369,267$ 19,598,383$
Fraction in year 0.530488201 0.481458208
Net Present Value (NPV) 19,598,383$
Internal Rate of Return (IRR) 15.24%
Discounted Payback 3.53
Accounting Rate of Return (ARR) 30.00%
Profitability Index (PI) 1.39
Expected cash Flows 19,598,383$
16,000,000.00$ 24,238,275$
15,000,000.00$ 19,598,383$
12,000,000.00$ 5,678,706$
10,000,000.00$ (3,601,078)$
8,000,000.00$ (12,880,862)$
5,000,000.00$ (26,800,539)$
Sensitivity Analysis NPV
Expected cash Flows 15%
16,000,000.00$ 18%
15,000,000.00$ 15%
12,000,000.00$ 6%
10,000,000.00$ 0%
8,000,000.00$ -7%
5,000,000.00$ -19%
Sensitivity Analysis IRR
11CORPORATE FINANCE
Expected cash Flows 3.53
16,000,000.00$ 3.30
15,000,000.00$ 3.53
12,000,000.00$ 4.46
10,000,000.00$ #REF!
8,000,000.00$ #REF!
5,000,000.00$ #REF!
Sensitivity Analysis PBP
Expected cash Flows 30%
16,000,000.00$ 32%
15,000,000.00$ 30%
12,000,000.00$ 24%
10,000,000.00$ 20%
8,000,000.00$ 16%
5,000,000.00$ 10%
Sensitivity Analysis ARR
Expected cash Flows 1.39
16,000,000.00$ 1.48
15,000,000.00$ 1.39
12,000,000.00$ 1.11
10,000,000.00$ 0.93
8,000,000.00$ 0.74
5,000,000.00$ 0.46
Sensitivity Analysis PI
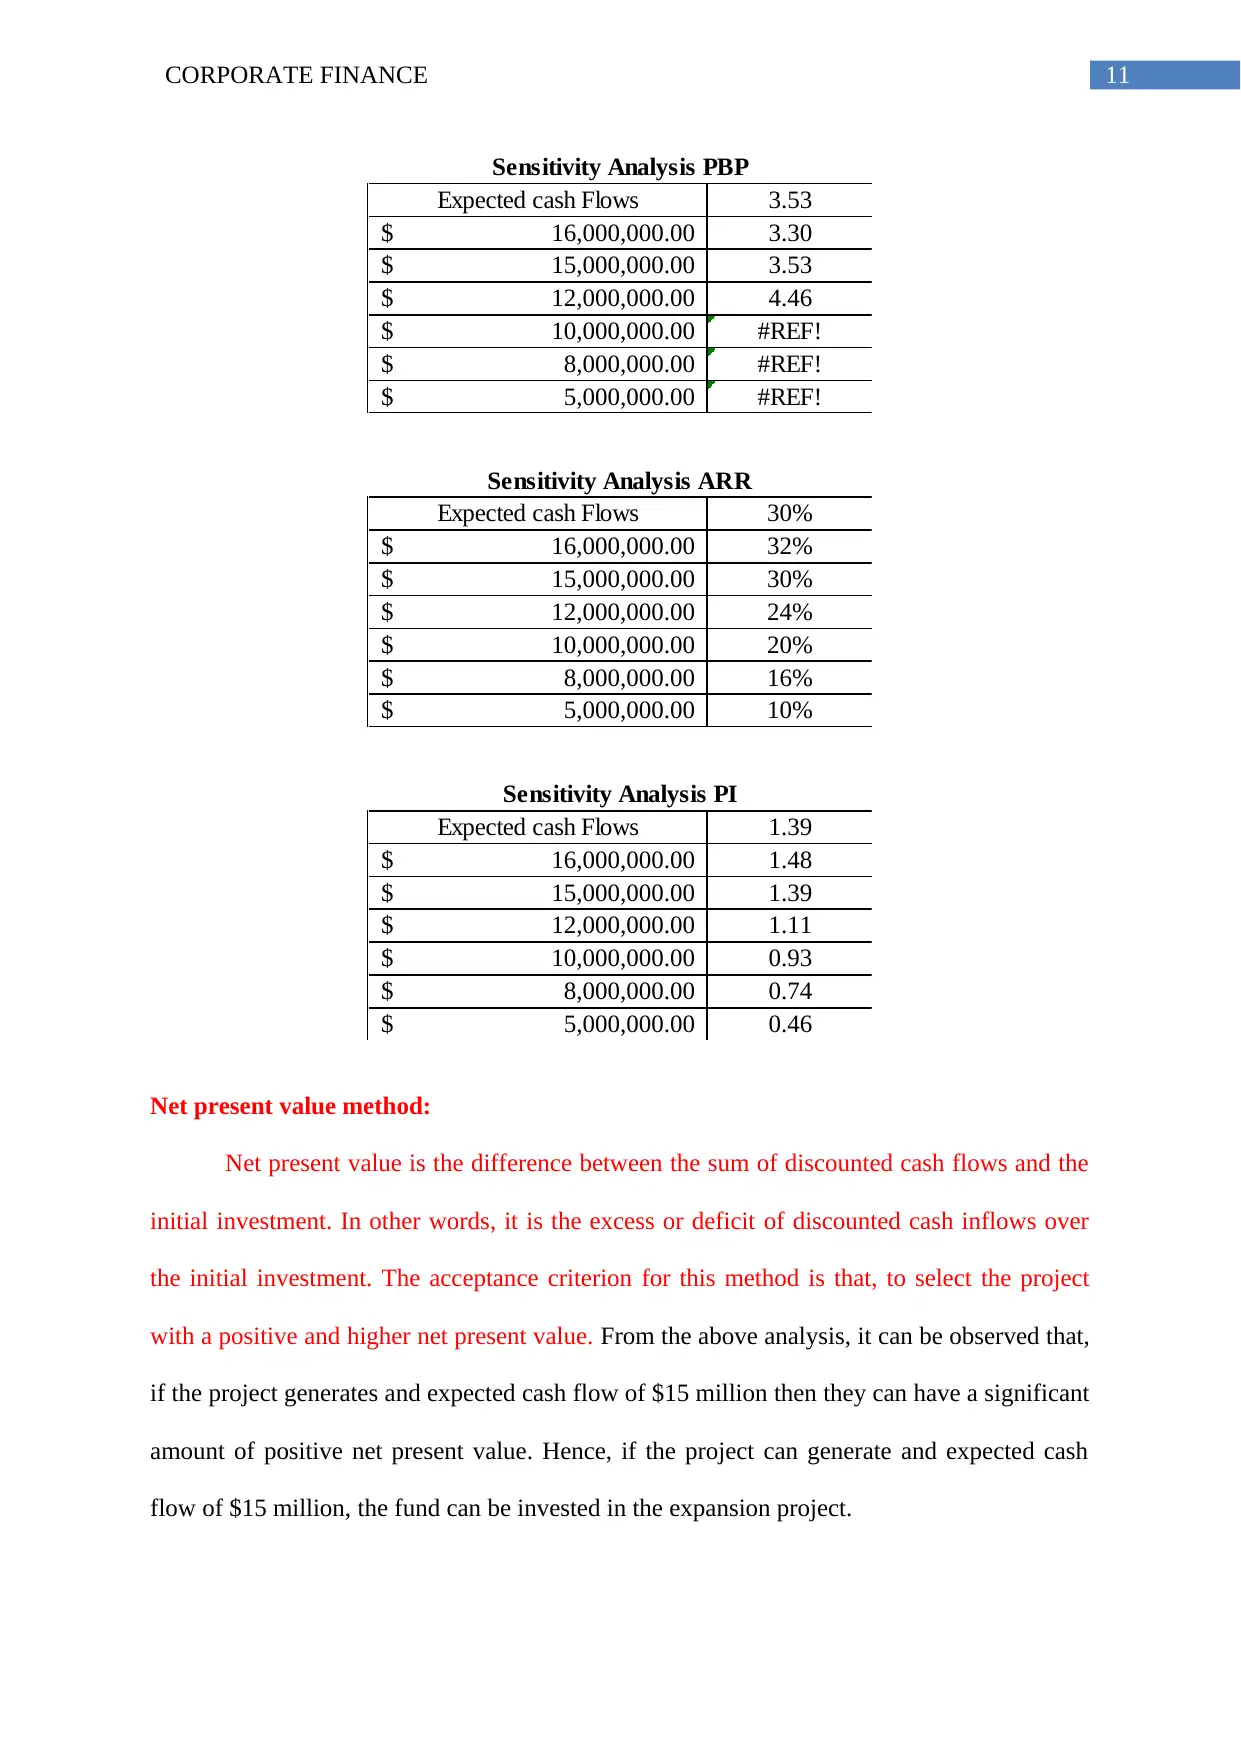
Net present value method:
Net present value is the difference between the sum of discounted cash flows and the
initial investment. In other words, it is the excess or deficit of discounted cash inflows over
the initial investment. The acceptance criterion for this method is that, to select the project
with a positive and higher net present value. From the above analysis, it can be observed that,
if the project generates and expected cash flow of $15 million then they can have a significant
amount of positive net present value. Hence, if the project can generate and expected cash
flow of $15 million, the fund can be invested in the expansion project.
Expected cash Flows 3.53
16,000,000.00$ 3.30
15,000,000.00$ 3.53
12,000,000.00$ 4.46
10,000,000.00$ #REF!
8,000,000.00$ #REF!
5,000,000.00$ #REF!
Sensitivity Analysis PBP
Expected cash Flows 30%
16,000,000.00$ 32%
15,000,000.00$ 30%
12,000,000.00$ 24%
10,000,000.00$ 20%
8,000,000.00$ 16%
5,000,000.00$ 10%
Sensitivity Analysis ARR
Expected cash Flows 1.39
16,000,000.00$ 1.48
15,000,000.00$ 1.39
12,000,000.00$ 1.11
10,000,000.00$ 0.93
8,000,000.00$ 0.74
5,000,000.00$ 0.46
Sensitivity Analysis PI
Net present value method:
Net present value is the difference between the sum of discounted cash flows and the
initial investment. In other words, it is the excess or deficit of discounted cash inflows over
the initial investment. The acceptance criterion for this method is that, to select the project
with a positive and higher net present value. From the above analysis, it can be observed that,
if the project generates and expected cash flow of $15 million then they can have a significant
amount of positive net present value. Hence, if the project can generate and expected cash
flow of $15 million, the fund can be invested in the expansion project.
⊘ This is a preview!⊘
Do you want full access?
Subscribe today to unlock all pages.
Trusted by 1+ million students worldwide
1 out of 17
Related Documents


Your All-in-One AI-Powered Toolkit for Academic Success.
+13062052269
info@desklib.com
Available 24*7 on WhatsApp / Email
![[object Object]](/_next/static/media/star-bottom.7253800d.svg)
Unlock your academic potential
Copyright © 2020–2026 A2Z Services. All Rights Reserved. Developed and managed by ZUCOL.