Finance and Accounting Management Assignment 1 Report Analysis
VerifiedAdded on 2023/05/31
|9
|2349
|124
Report
AI Summary
This report provides a comprehensive analysis of Bee Tan Corp's financial performance over three years. It begins with an introduction to the company, an e-commerce service provider facing increasing competition and operating losses. The report then delves into a detailed performance analysis, examining revenue, cost of sales, gross profit, and operating losses, with a focus on key drivers like annual transacting users and transactions per user. The financial analysis includes calculations of sales revenue per user, cost of sales per user, and operating profit/loss percentages. The analysis reveals substantial revenue growth, but also increasing costs. The report concludes with proposals to mitigate losses, including targeted marketing, pricing strategies, streamlining operations, bulk contracts with vendors, and reducing operational expenses. The report highlights the need for the company to improve profitability and reduce costs to compete effectively in the e-commerce market.
FINANCE AND
ACCOUNTING
MANAGEMENT
ASSIGNMENT
ACCOUNTING
MANAGEMENT
ASSIGNMENT
Paraphrase This Document
Need a fresh take? Get an instant paraphrase of this document with our AI Paraphraser
1
By student name
Professor
University
Date: 25 April 2018.
1 | P a g e
By student name
Professor
University
Date: 25 April 2018.
1 | P a g e
2
Contents
Introduction.................................................................................................................................................3
Discussion and Analysis...............................................................................................................................3
Performance Analysis..............................................................................................................................3
Proposal to mitigate the losses................................................................................................................5
Conclusion...................................................................................................................................................6
References...................................................................................................................................................7
2 | P a g e
⊘ This is a preview!⊘
Do you want full access?
Subscribe today to unlock all pages.
Trusted by 1+ million students worldwide
3
Introduction
In the given case study, Bee Tan Corp is one of the leading e-commerce service provider. It provides a
plat form for connecting the end customers and the merchants and is offering food services, online
movie tickets and flight booking services as well. The company has had over 5 billion transactions in the
last year cumulating to $340 billion of revenue excluding the commission charges. Though the mobile
app of the company named BTM (Bee Tan Mobile) is amongst the top ten popular apps in the country
but it is facing intense competition from one of its competitors Makan Corp which is also serving major
portion of the domestic market (Belton, 2017). The company Bee Tan Corp is facing losses over last 3
years and is being considered as one of the complimentary service providers instead of an outright
competitor and therefore the management is concerned towards the continuous losses despite the
increase in the user and the revenue base.
Discussion and Analysis
Performance Analysis
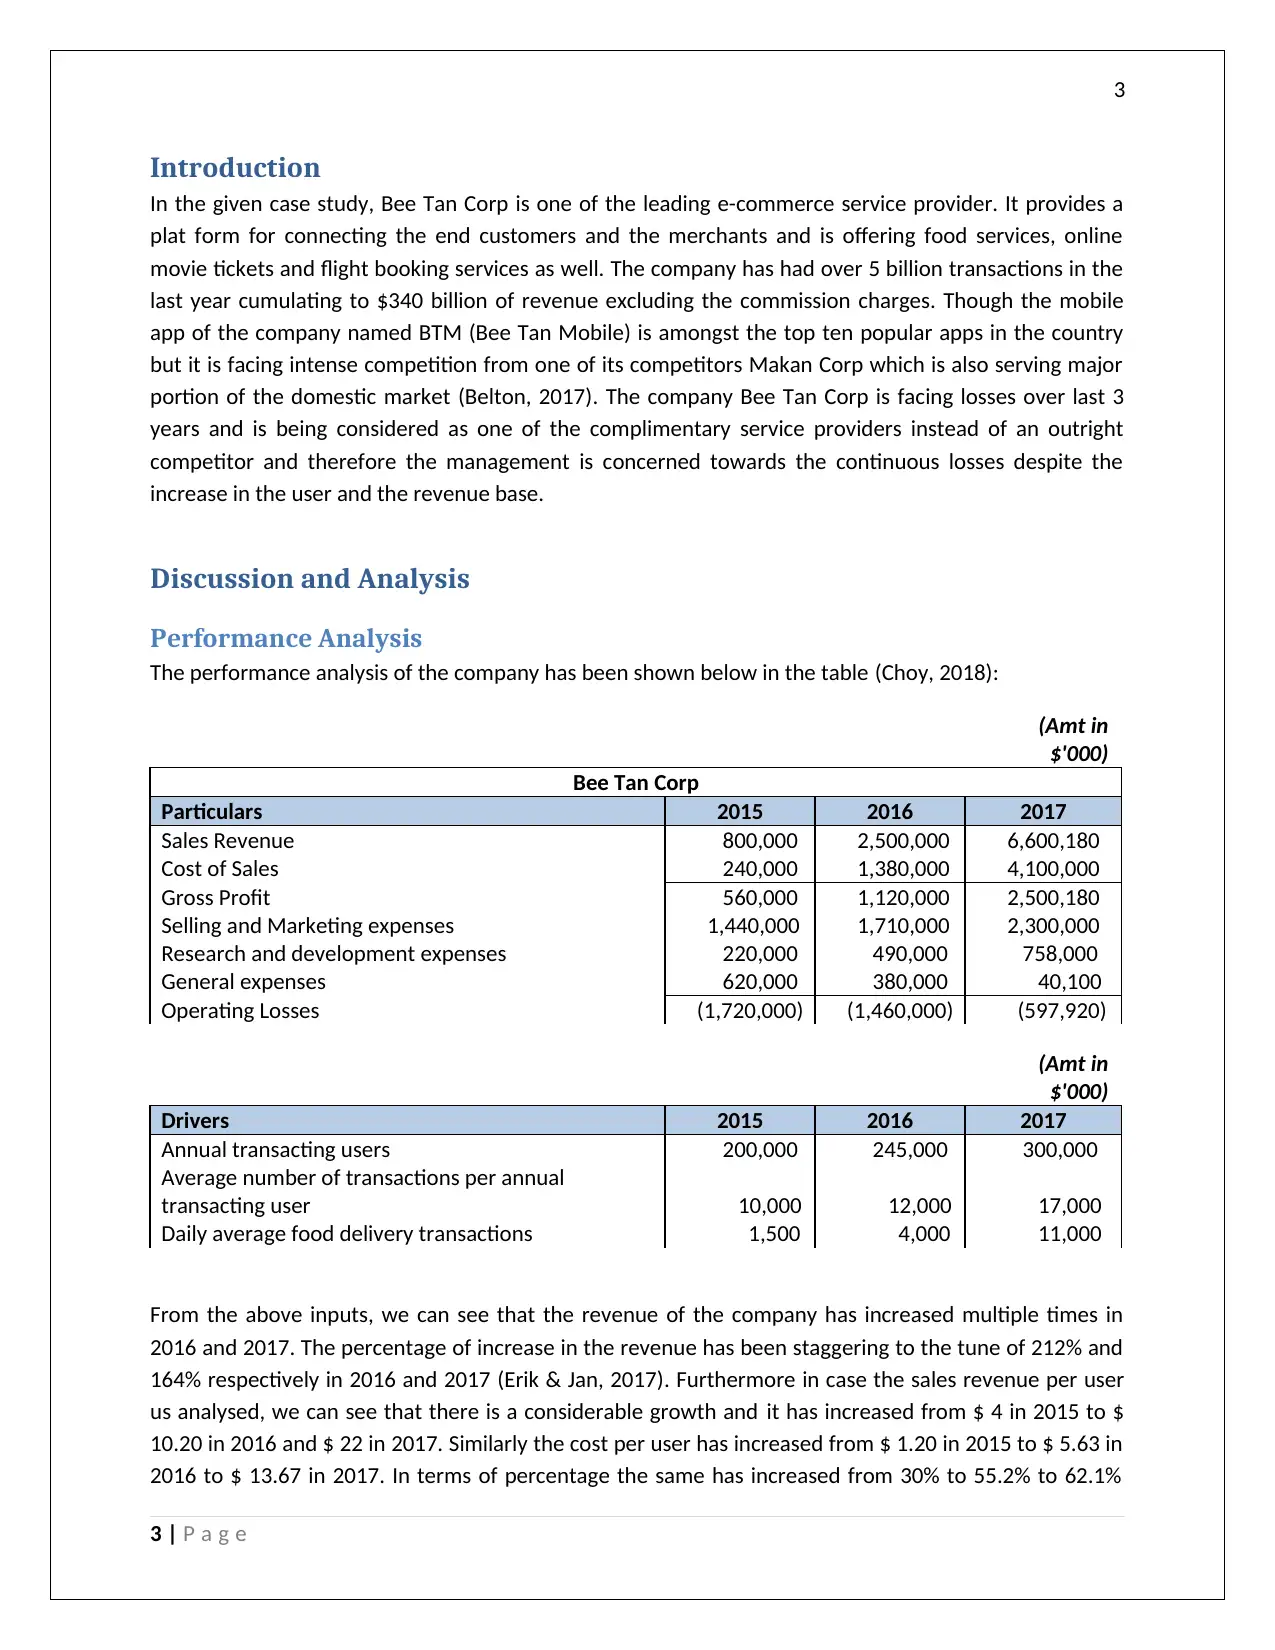
The performance analysis of the company has been shown below in the table (Choy, 2018):
(Amt in
$'000)
Bee Tan Corp
Particulars 2015 2016 2017
Sales Revenue 800,000 2,500,000 6,600,180
Cost of Sales 240,000 1,380,000 4,100,000
Gross Profit 560,000 1,120,000 2,500,180
Selling and Marketing expenses 1,440,000 1,710,000 2,300,000
Research and development expenses 220,000 490,000 758,000
General expenses 620,000 380,000 40,100
Operating Losses (1,720,000) (1,460,000) (597,920)
(Amt in
$'000)
Drivers 2015 2016 2017
Annual transacting users 200,000 245,000 300,000
Average number of transactions per annual
transacting user 10,000 12,000 17,000
Daily average food delivery transactions 1,500 4,000 11,000
From the above inputs, we can see that the revenue of the company has increased multiple times in
2016 and 2017. The percentage of increase in the revenue has been staggering to the tune of 212% and
164% respectively in 2016 and 2017 (Erik & Jan, 2017). Furthermore in case the sales revenue per user
us analysed, we can see that there is a considerable growth and it has increased from $ 4 in 2015 to $
10.20 in 2016 and $ 22 in 2017. Similarly the cost per user has increased from $ 1.20 in 2015 to $ 5.63 in
2016 to $ 13.67 in 2017. In terms of percentage the same has increased from 30% to 55.2% to 62.1%
3 | P a g e
Introduction
In the given case study, Bee Tan Corp is one of the leading e-commerce service provider. It provides a
plat form for connecting the end customers and the merchants and is offering food services, online
movie tickets and flight booking services as well. The company has had over 5 billion transactions in the
last year cumulating to $340 billion of revenue excluding the commission charges. Though the mobile
app of the company named BTM (Bee Tan Mobile) is amongst the top ten popular apps in the country
but it is facing intense competition from one of its competitors Makan Corp which is also serving major
portion of the domestic market (Belton, 2017). The company Bee Tan Corp is facing losses over last 3
years and is being considered as one of the complimentary service providers instead of an outright
competitor and therefore the management is concerned towards the continuous losses despite the
increase in the user and the revenue base.
Discussion and Analysis
Performance Analysis
The performance analysis of the company has been shown below in the table (Choy, 2018):
(Amt in
$'000)
Bee Tan Corp
Particulars 2015 2016 2017
Sales Revenue 800,000 2,500,000 6,600,180
Cost of Sales 240,000 1,380,000 4,100,000
Gross Profit 560,000 1,120,000 2,500,180
Selling and Marketing expenses 1,440,000 1,710,000 2,300,000
Research and development expenses 220,000 490,000 758,000
General expenses 620,000 380,000 40,100
Operating Losses (1,720,000) (1,460,000) (597,920)
(Amt in
$'000)
Drivers 2015 2016 2017
Annual transacting users 200,000 245,000 300,000
Average number of transactions per annual
transacting user 10,000 12,000 17,000
Daily average food delivery transactions 1,500 4,000 11,000
From the above inputs, we can see that the revenue of the company has increased multiple times in
2016 and 2017. The percentage of increase in the revenue has been staggering to the tune of 212% and
164% respectively in 2016 and 2017 (Erik & Jan, 2017). Furthermore in case the sales revenue per user
us analysed, we can see that there is a considerable growth and it has increased from $ 4 in 2015 to $
10.20 in 2016 and $ 22 in 2017. Similarly the cost per user has increased from $ 1.20 in 2015 to $ 5.63 in
2016 to $ 13.67 in 2017. In terms of percentage the same has increased from 30% to 55.2% to 62.1%
3 | P a g e
Paraphrase This Document
Need a fresh take? Get an instant paraphrase of this document with our AI Paraphraser
4
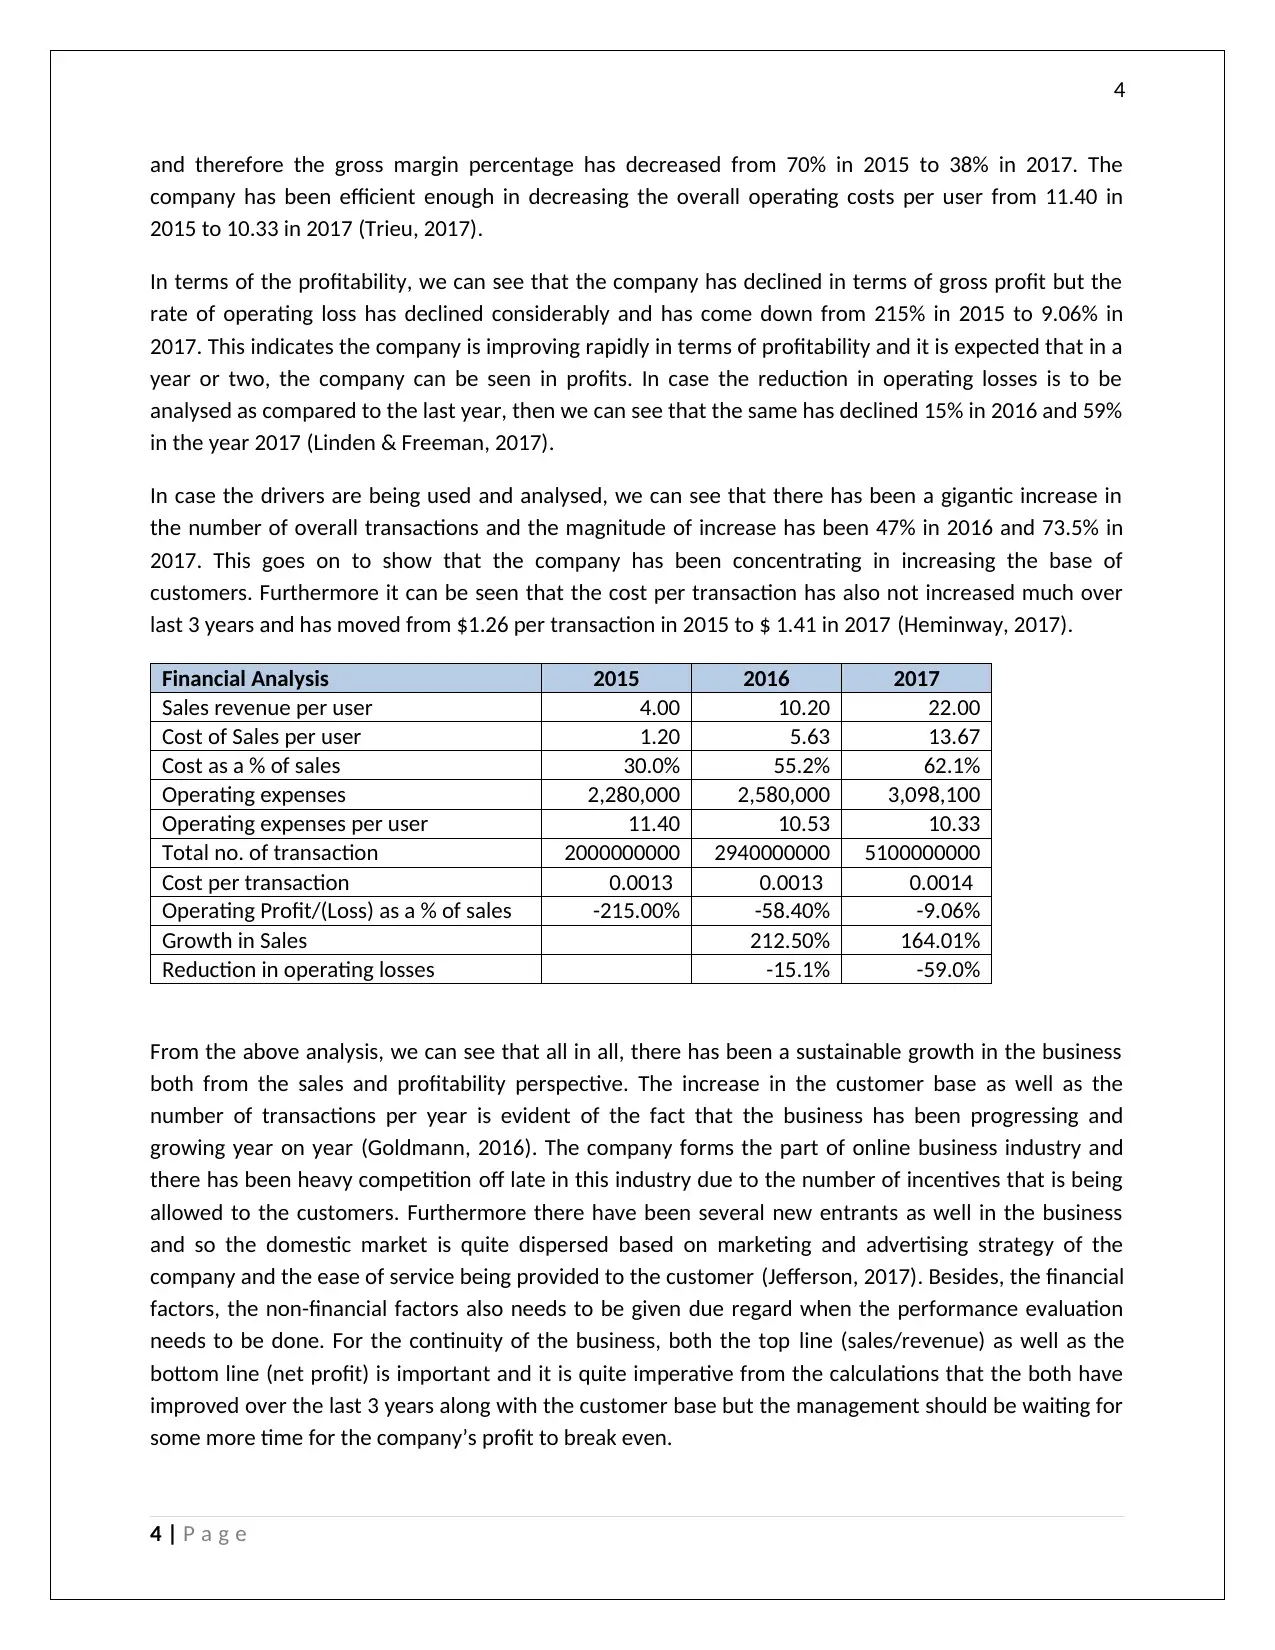
and therefore the gross margin percentage has decreased from 70% in 2015 to 38% in 2017. The
company has been efficient enough in decreasing the overall operating costs per user from 11.40 in
2015 to 10.33 in 2017 (Trieu, 2017).
In terms of the profitability, we can see that the company has declined in terms of gross profit but the
rate of operating loss has declined considerably and has come down from 215% in 2015 to 9.06% in
2017. This indicates the company is improving rapidly in terms of profitability and it is expected that in a
year or two, the company can be seen in profits. In case the reduction in operating losses is to be
analysed as compared to the last year, then we can see that the same has declined 15% in 2016 and 59%
in the year 2017 (Linden & Freeman, 2017).
In case the drivers are being used and analysed, we can see that there has been a gigantic increase in
the number of overall transactions and the magnitude of increase has been 47% in 2016 and 73.5% in
2017. This goes on to show that the company has been concentrating in increasing the base of
customers. Furthermore it can be seen that the cost per transaction has also not increased much over
last 3 years and has moved from $1.26 per transaction in 2015 to $ 1.41 in 2017 (Heminway, 2017).
Financial Analysis 2015 2016 2017
Sales revenue per user 4.00 10.20 22.00
Cost of Sales per user 1.20 5.63 13.67
Cost as a % of sales 30.0% 55.2% 62.1%
Operating expenses 2,280,000 2,580,000 3,098,100
Operating expenses per user 11.40 10.53 10.33
Total no. of transaction 2000000000 2940000000 5100000000
Cost per transaction 0.0013 0.0013 0.0014
Operating Profit/(Loss) as a % of sales -215.00% -58.40% -9.06%
Growth in Sales 212.50% 164.01%
Reduction in operating losses -15.1% -59.0%
From the above analysis, we can see that all in all, there has been a sustainable growth in the business
both from the sales and profitability perspective. The increase in the customer base as well as the
number of transactions per year is evident of the fact that the business has been progressing and
growing year on year (Goldmann, 2016). The company forms the part of online business industry and
there has been heavy competition off late in this industry due to the number of incentives that is being
allowed to the customers. Furthermore there have been several new entrants as well in the business
and so the domestic market is quite dispersed based on marketing and advertising strategy of the
company and the ease of service being provided to the customer (Jefferson, 2017). Besides, the financial
factors, the non-financial factors also needs to be given due regard when the performance evaluation
needs to be done. For the continuity of the business, both the top line (sales/revenue) as well as the
bottom line (net profit) is important and it is quite imperative from the calculations that the both have
improved over the last 3 years along with the customer base but the management should be waiting for
some more time for the company’s profit to break even.
4 | P a g e
5
Proposal to mitigate the losses
As is evident from the above calculations, though the company has been improving and growth in terms
of revenue and the customer base and market reach, but the major concern for the management has
been the continuous series of operating losses incurred by the company. Some of the ways which the
company can implement to mitigate the losses in the upcoming years are mentioned below:
1. The company should try to venture in to the local market where the company is not seen as one
of the major competitors but only a complimentary service provider. The same can be done by
improving the level of marketing and advertisement in the local market and giving more
incentives and offers to the dealers and the customer respectively. This will have a two way
benefit to the company as the local restaurants and cafes would be incentivized to sell the
product of the company Bee Tan Corp and would thus promote the same amongst the
customers rather than the product of the competitors (Alexander, 2016). Furthermore, with
discounts and offers, the customers and the end users will be encouraged to use it rather than
product of other company which would come at higher prices.
2. The company can implement different types of pricing schemes which are available in the
market. For example differential pricing can be used as one of the alternatives and the areas in
which are remote and competitors are not situated, higher prices can be charged and the places
and areas which is within the city and there is competitive pressure, lower prices can be charged
(Marques, 2018).
3. Furthermore, streamlining of all the operational activities and outsourcing the same to one
vendor totally or doing it in house can be considered and evaluated. This will not only result in
improving the work flow but there will be clarity of activities and the segregation of work and
good internal control on the processes can lead to efficiency and effectiveness in the conduction
of the operations and can fasten up the process (Raghupathi & Wu, 2018).
4. The company should also consider going into bulk contracts with the vendors by offering
discounts on the same. In this way, the entire production facilities will be utilised and the
company can go for economies of scale and thereby reducing the overall cost of production
(Werner, 2017). This can result in one of the major savings and thereby increasing the gross
margin as well as the net margin.
5. One of the other steps which needs to be taken up by the management is to reduce the
operational costs such as those of research and development expenses and the general
expenses of the business. This will help in reducing the operational costs and thereby helping in
increasing the margins. Fixed costs like those of rent, electricity and other fixed costs cannot be
reduced at times but the variable costs can be reduced by achieving economies of scale
(Meroño-Cerdán, et al., 2017).
6. The company should also be considering the option of outsourcing few of the food outlets and
launching of the new complimentary features on the mobile app like those of home delivery at
any time of the day, special incentive to first order, referral and bonus schemes to attract the
5 | P a g e
⊘ This is a preview!⊘
Do you want full access?
Subscribe today to unlock all pages.
Trusted by 1+ million students worldwide
6
crowd (Kewell & Linsley, 2017). This will help in increasing the traffic on the sites and increasing
the number of clicks.
Conclusion
From the above discussion and analysis, we can conclude that the business of Bee Tan Corp has been a
growing and prospering one in the last 3 years. It has made a huge improvement in increasing the
overall sales revenue and has also been able to attract a huge market base and number of customers.
But the major constraint with the company has been that it has not been in profits off late and has been
suffering the operating losses and therefore the management of the company is concerned for the
same. In the above section the financial analysis of the company has been done and ways have been
suggested so as to improve the profitability and reduce the costs in the coming future. The heavy
competition from Makan Group and its online app Makan Corp Mobile can be negotiated with the help
of incentives and offers for the customer and dealers. Furthermore if the quality is good, it will lead to
acquisition of customer base and help the company in becoming the market leader. Cost per transaction
is one area which needs to be worked upon and reduced so that the company can make use of
economies of scale.
6 | P a g e
Paraphrase This Document
Need a fresh take? Get an instant paraphrase of this document with our AI Paraphraser
7
References
Alexander, F., 2016. The Changing Face of Accountability. The Journal of Higher Education, 71(4), pp.
411-431.
Belton, P., 2017. Competitive Strategy: Creating and Sustaining Superior Performance. London: Macat
International ltd.
Choy, Y. K., 2018. Cost-benefit Analysis, Values, Wellbeing and Ethics: An Indigenous Worldview Analysis.
Ecological Economics, p. 145.
Erik, H. & Jan, B., 2017. Supply chain management and activity-based costing: Current status and
directions for the future. International Journal of Physical Distribution & Logistics Management, 47(8),
pp. 712-735.
Goldmann, K., 2016. Financial Liquidity and Profitability Management in Practice of Polish Business.
Financial Environment and Business Development, Volume 4, pp. 103-112.
Heminway, J., 2017. Shareholder Wealth Maximization as a Function of Statutes, Decisional Law, and
Organic Documents. SSRN, pp. 1-35.
Jefferson, M., 2017. Energy, Complexity and Wealth Maximization, R. Ayres. Springer, Switzerland.
Technological Forecasting and Social Change, pp. 353-354.
Kewell, B. & Linsley, P., 2017. Risk tools and risk technologies.. The Routledge Companion to Accounting
and Risk, 15.
Linden, B. & Freeman, R., 2017. Profit and Other Values: Thick Evaluation in Decision Making. Business
Ethics Quarterly, 27(3), pp. 353-379.
Marques, R. P. F., 2018. Continuous Assurance and the Use of Technology for Business Compliance.
Encyclopedia of Information Science and Technology, pp. 820-830.
Meroño-Cerdán, A., Lopez-Nicolas, C. & Molina-Castillo, F., 2017. Risk aversion, innovation and
performance in family firms. Economics of Innovation and new technology, pp. 1-15.
Raghupathi, W. & Wu, S., 2018. The Strategic Association Between Information and Communication
Technologies and Sustainability: A Country-Level Study. IGI Global, disseminator of knowledge, p. 26.
Trieu, V., 2017. Getting value from Business Intelligence systems: A review and research agenda.
Decision Support Systems, Volume 93, pp. 111-124.
7 | P a g e
8
Werner, M., 2017. Financial process mining - Accounting data structure dependent control flow
inference. International Journal of Accounting Information Systems, Volume 25, pp. 57-80.
8 | P a g e
Werner, M., 2017. Financial process mining - Accounting data structure dependent control flow
inference. International Journal of Accounting Information Systems, Volume 25, pp. 57-80.
8 | P a g e
⊘ This is a preview!⊘
Do you want full access?
Subscribe today to unlock all pages.
Trusted by 1+ million students worldwide
1 out of 9
Related Documents


Your All-in-One AI-Powered Toolkit for Academic Success.
+13062052269
info@desklib.com
Available 24*7 on WhatsApp / Email
![[object Object]](/_next/static/media/star-bottom.7253800d.svg)
Unlock your academic potential
Copyright © 2020–2026 A2Z Services. All Rights Reserved. Developed and managed by ZUCOL.