University Finance Assignment: Investment, Risk, and Return
VerifiedAdded on 2020/02/24
|12
|1806
|57
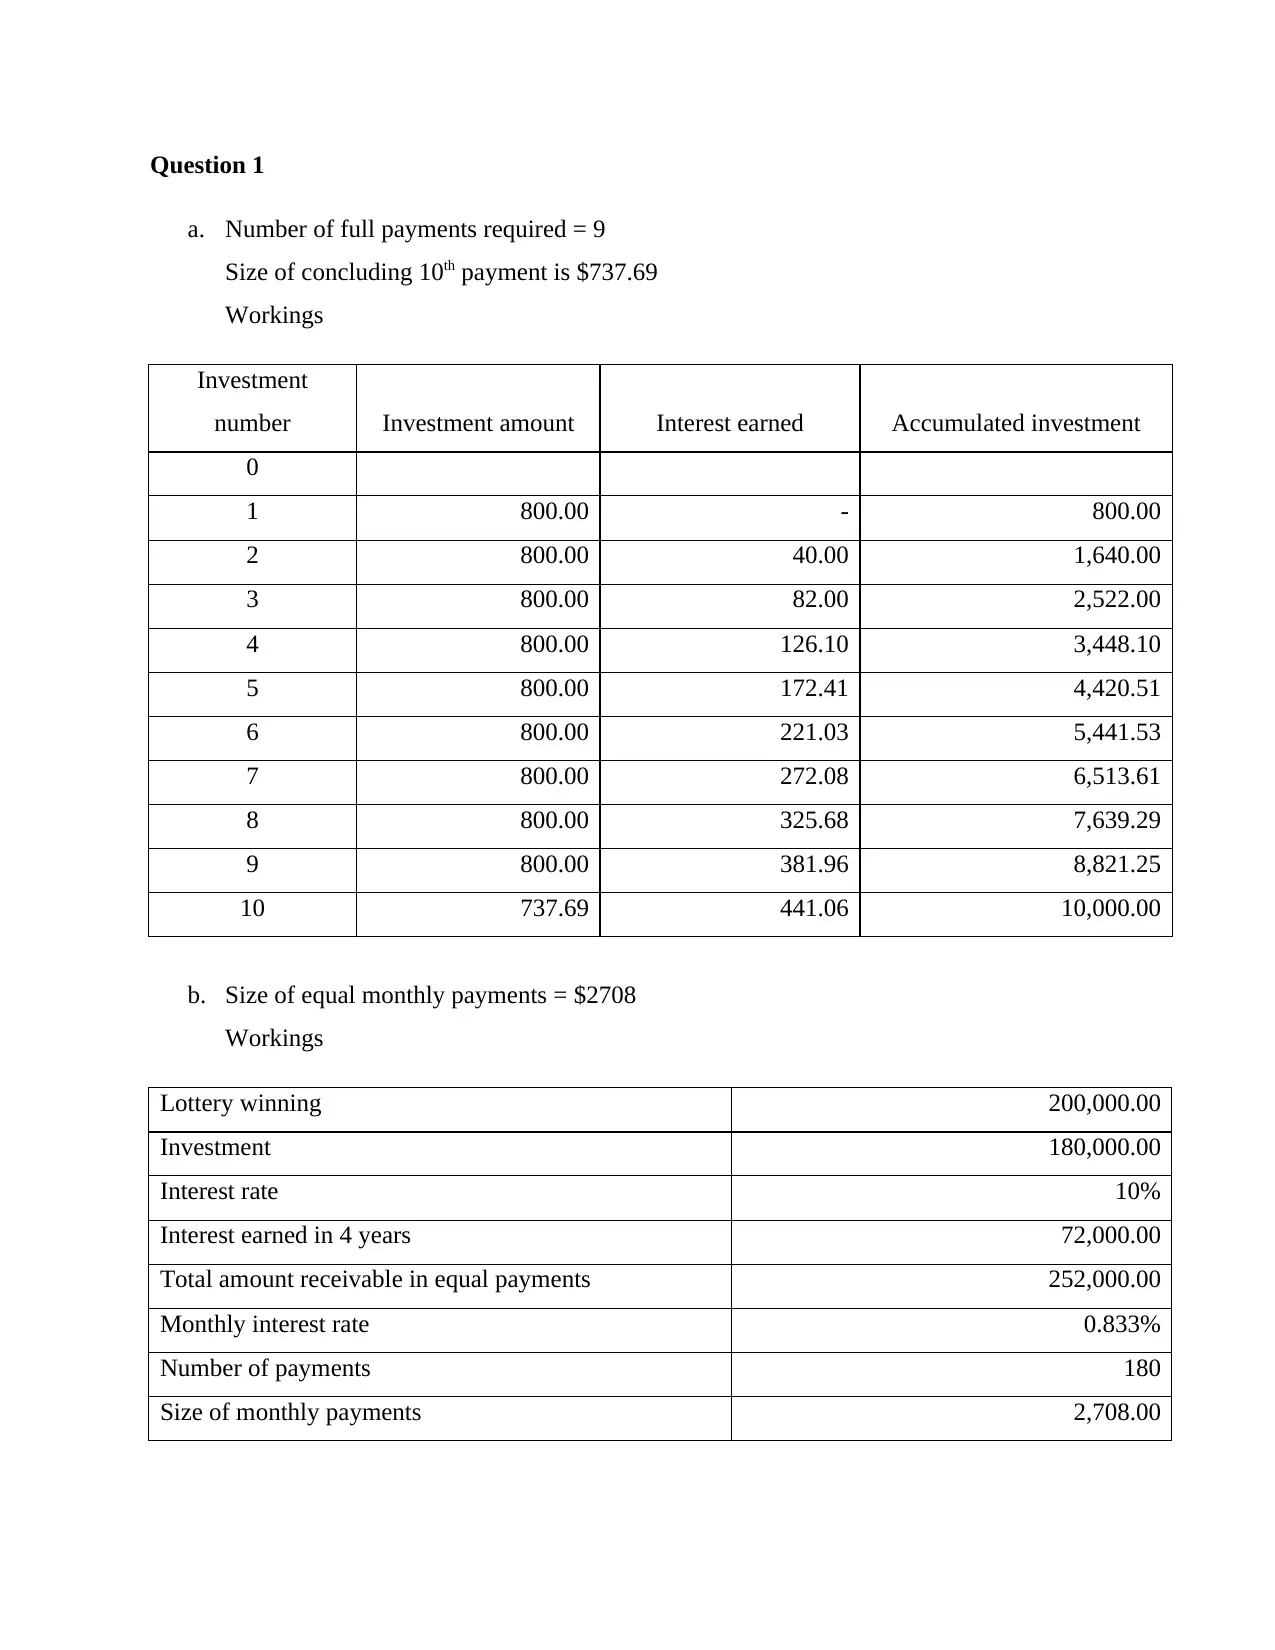
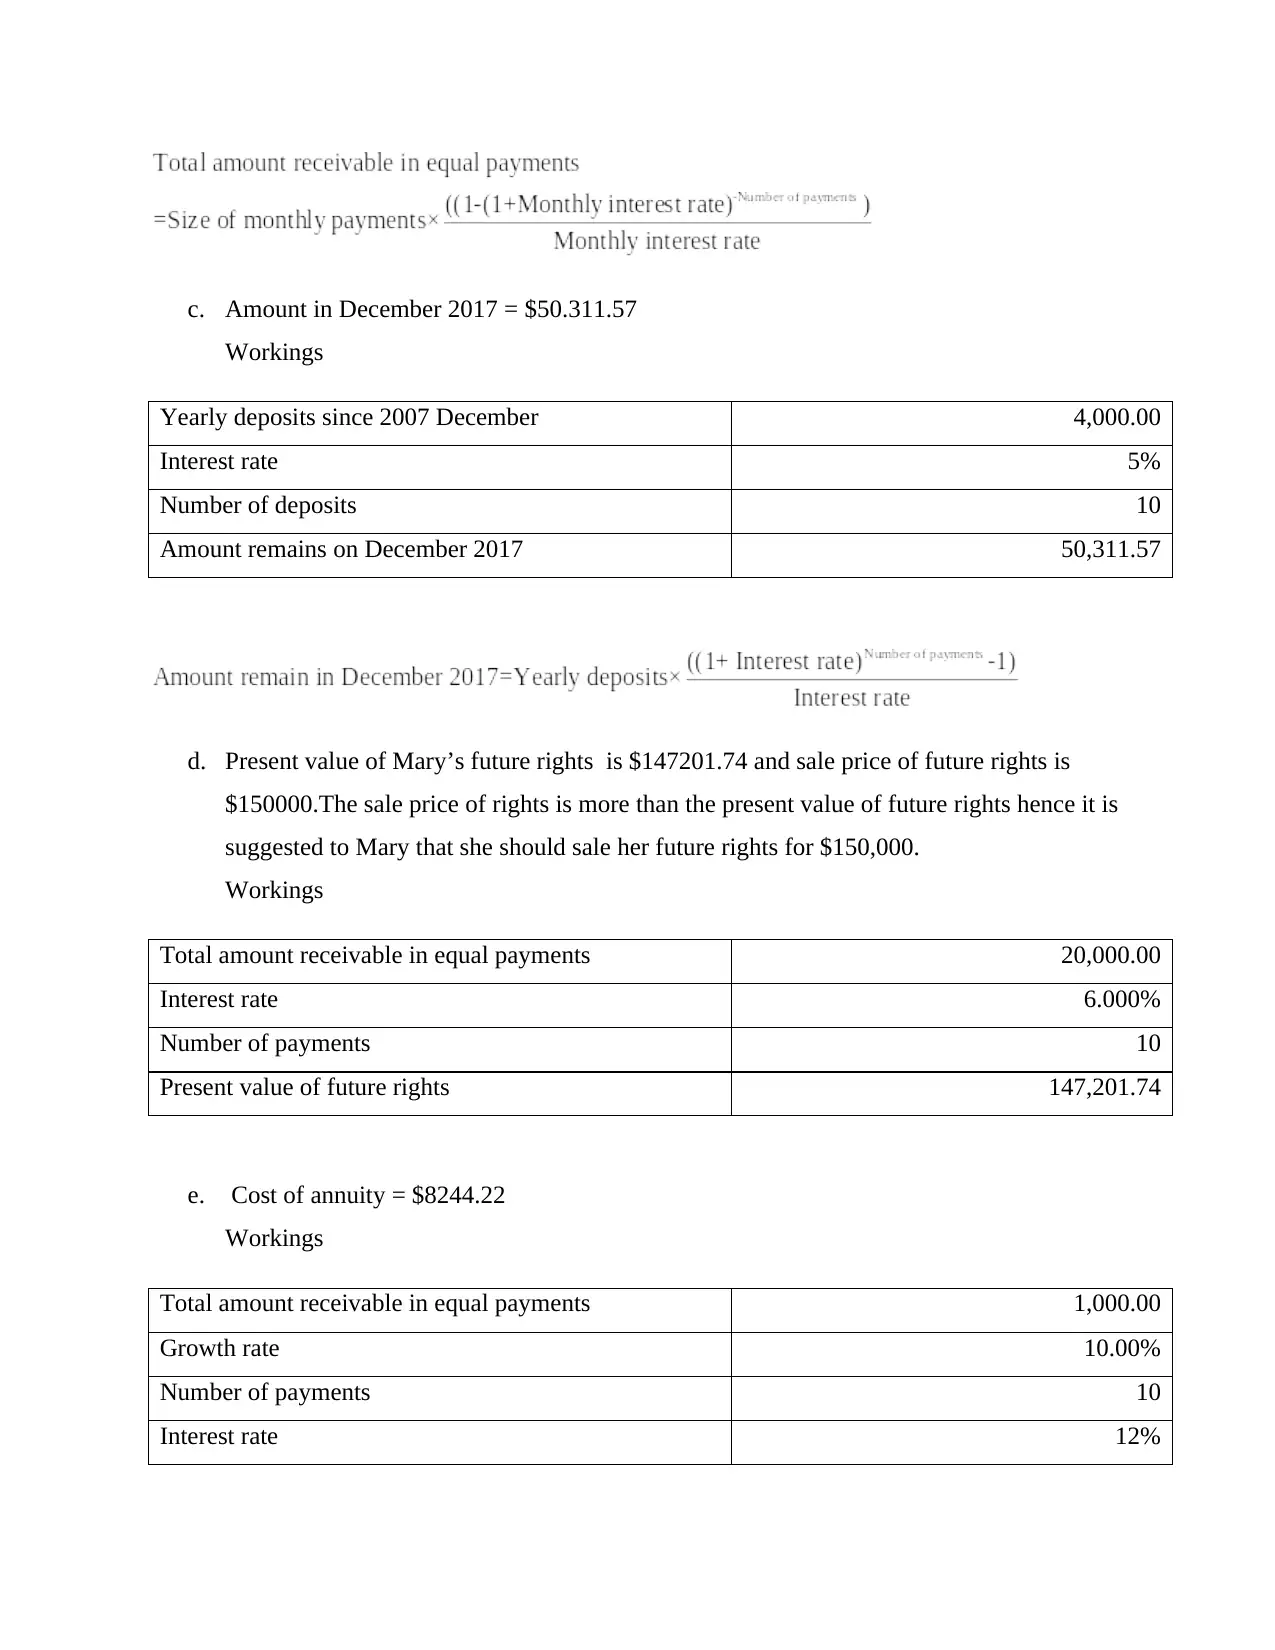
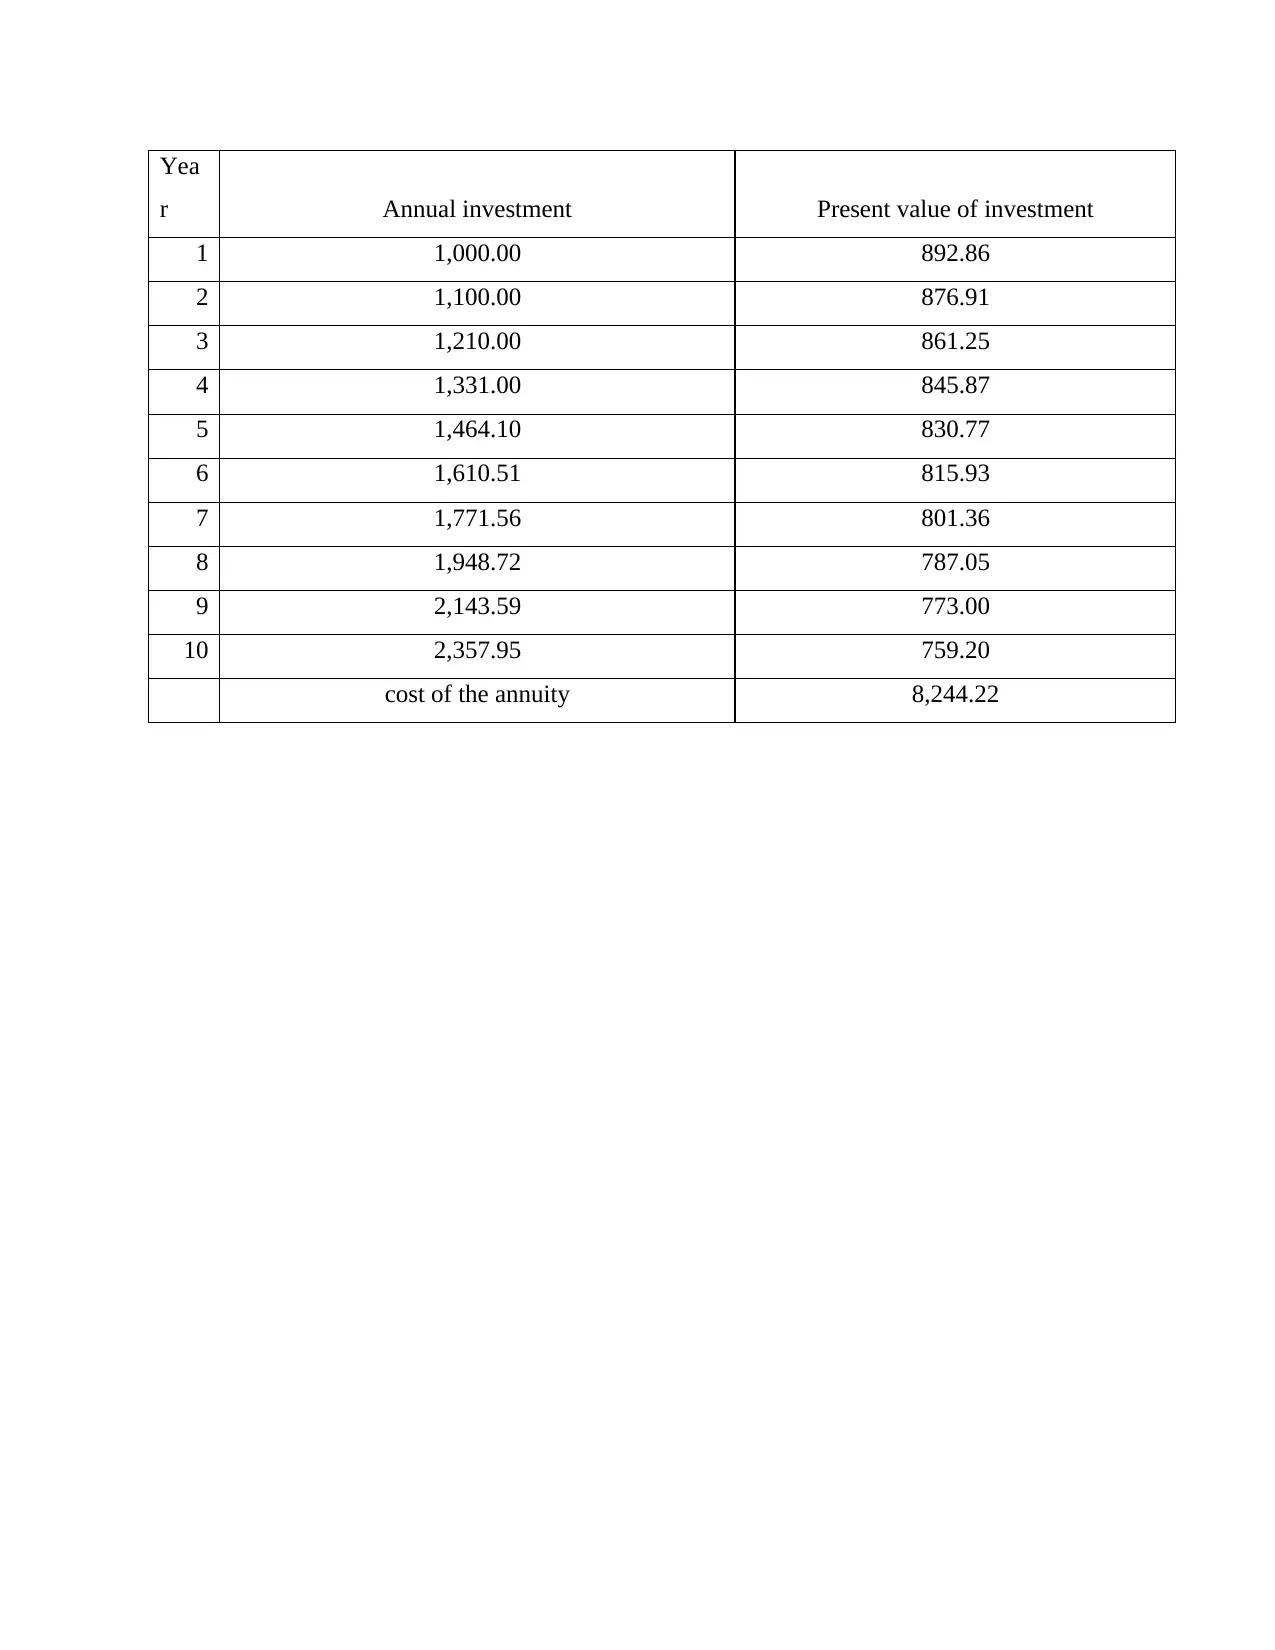
Homework Assignment
AI Summary
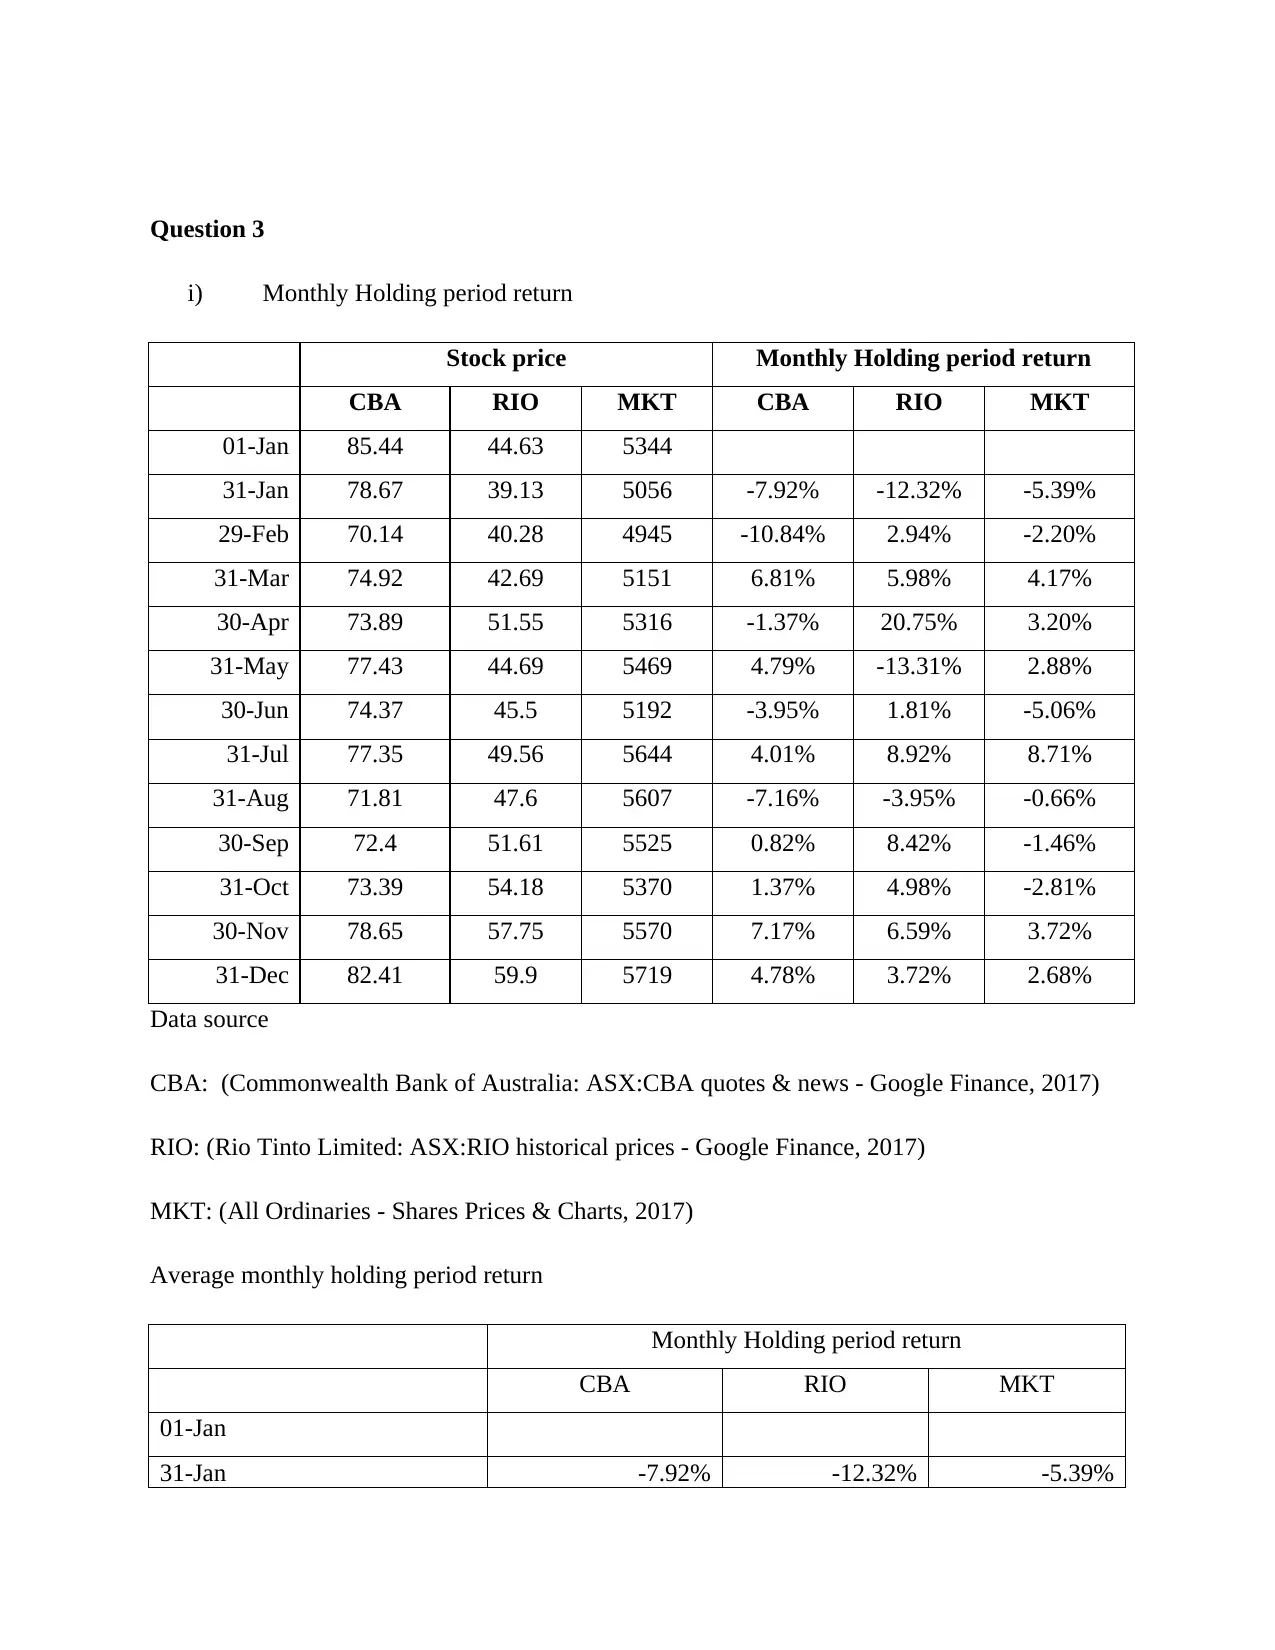
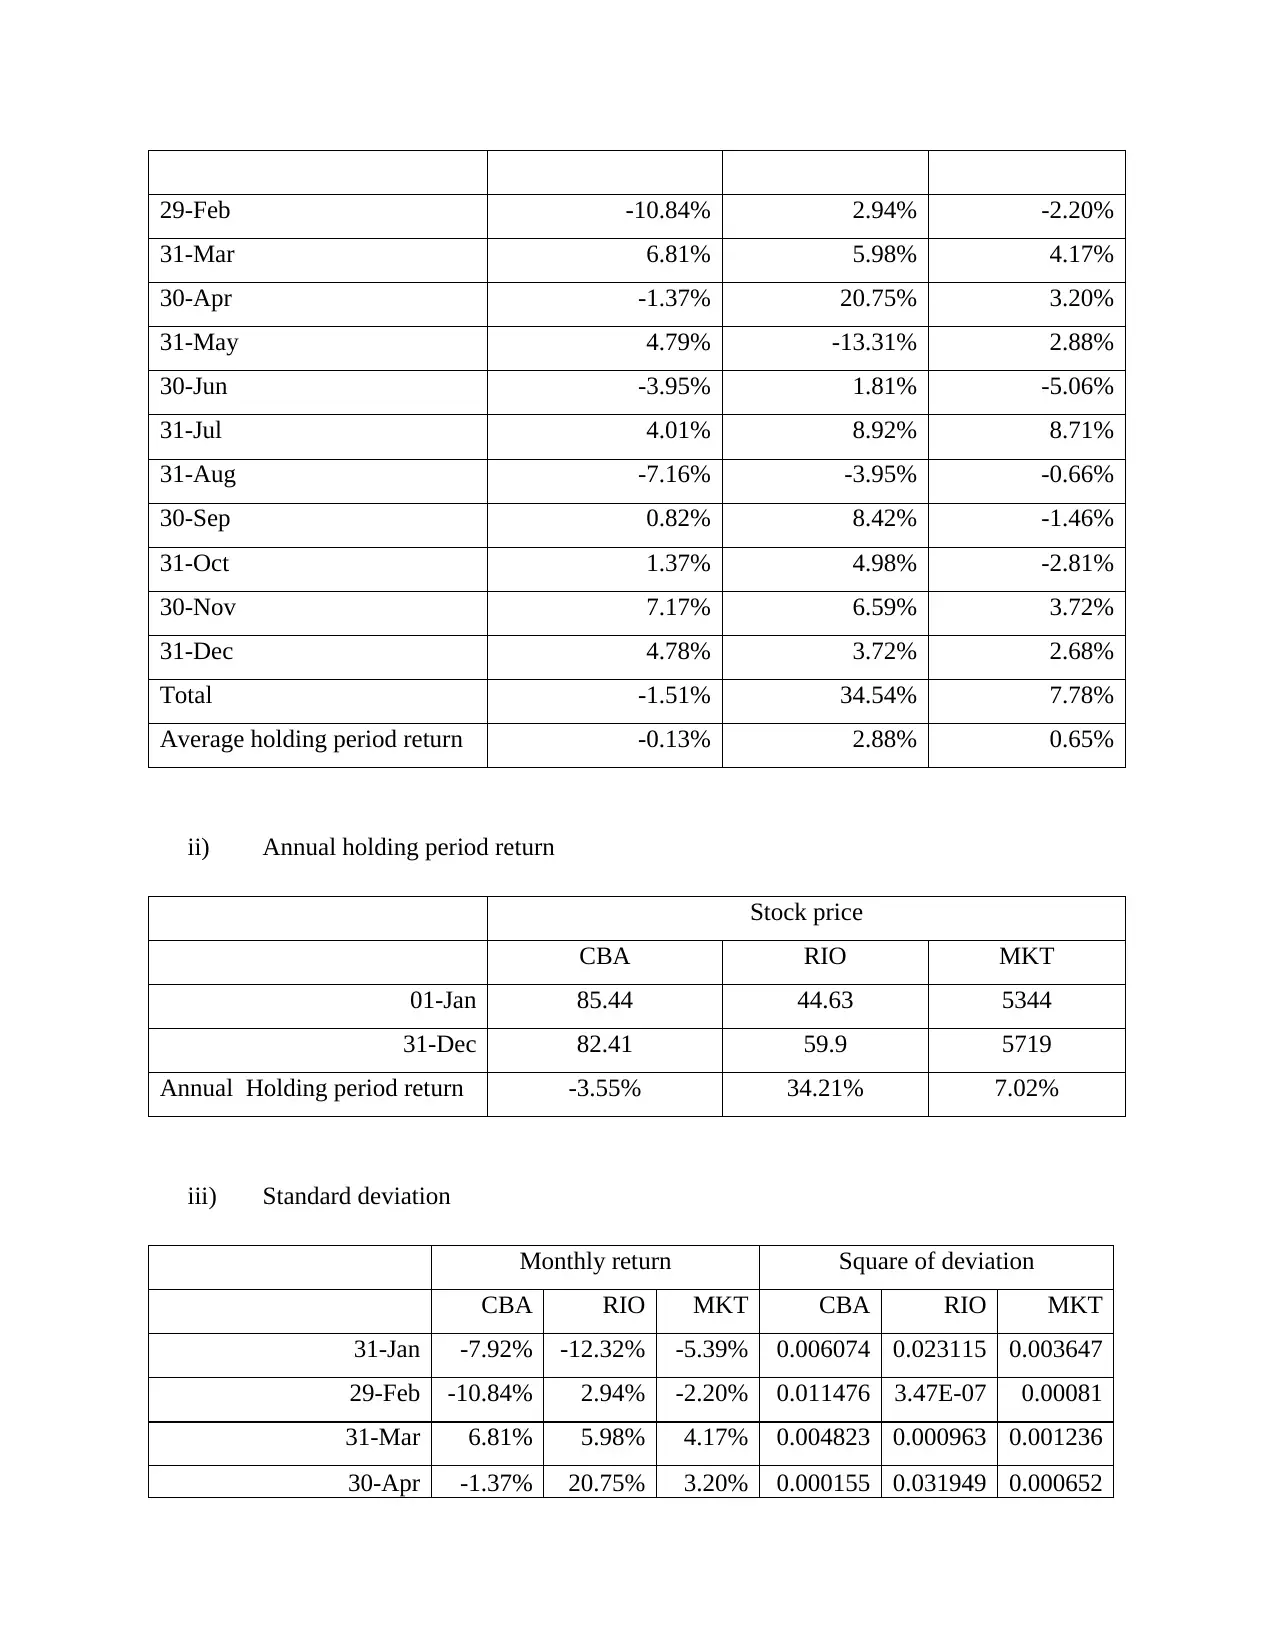
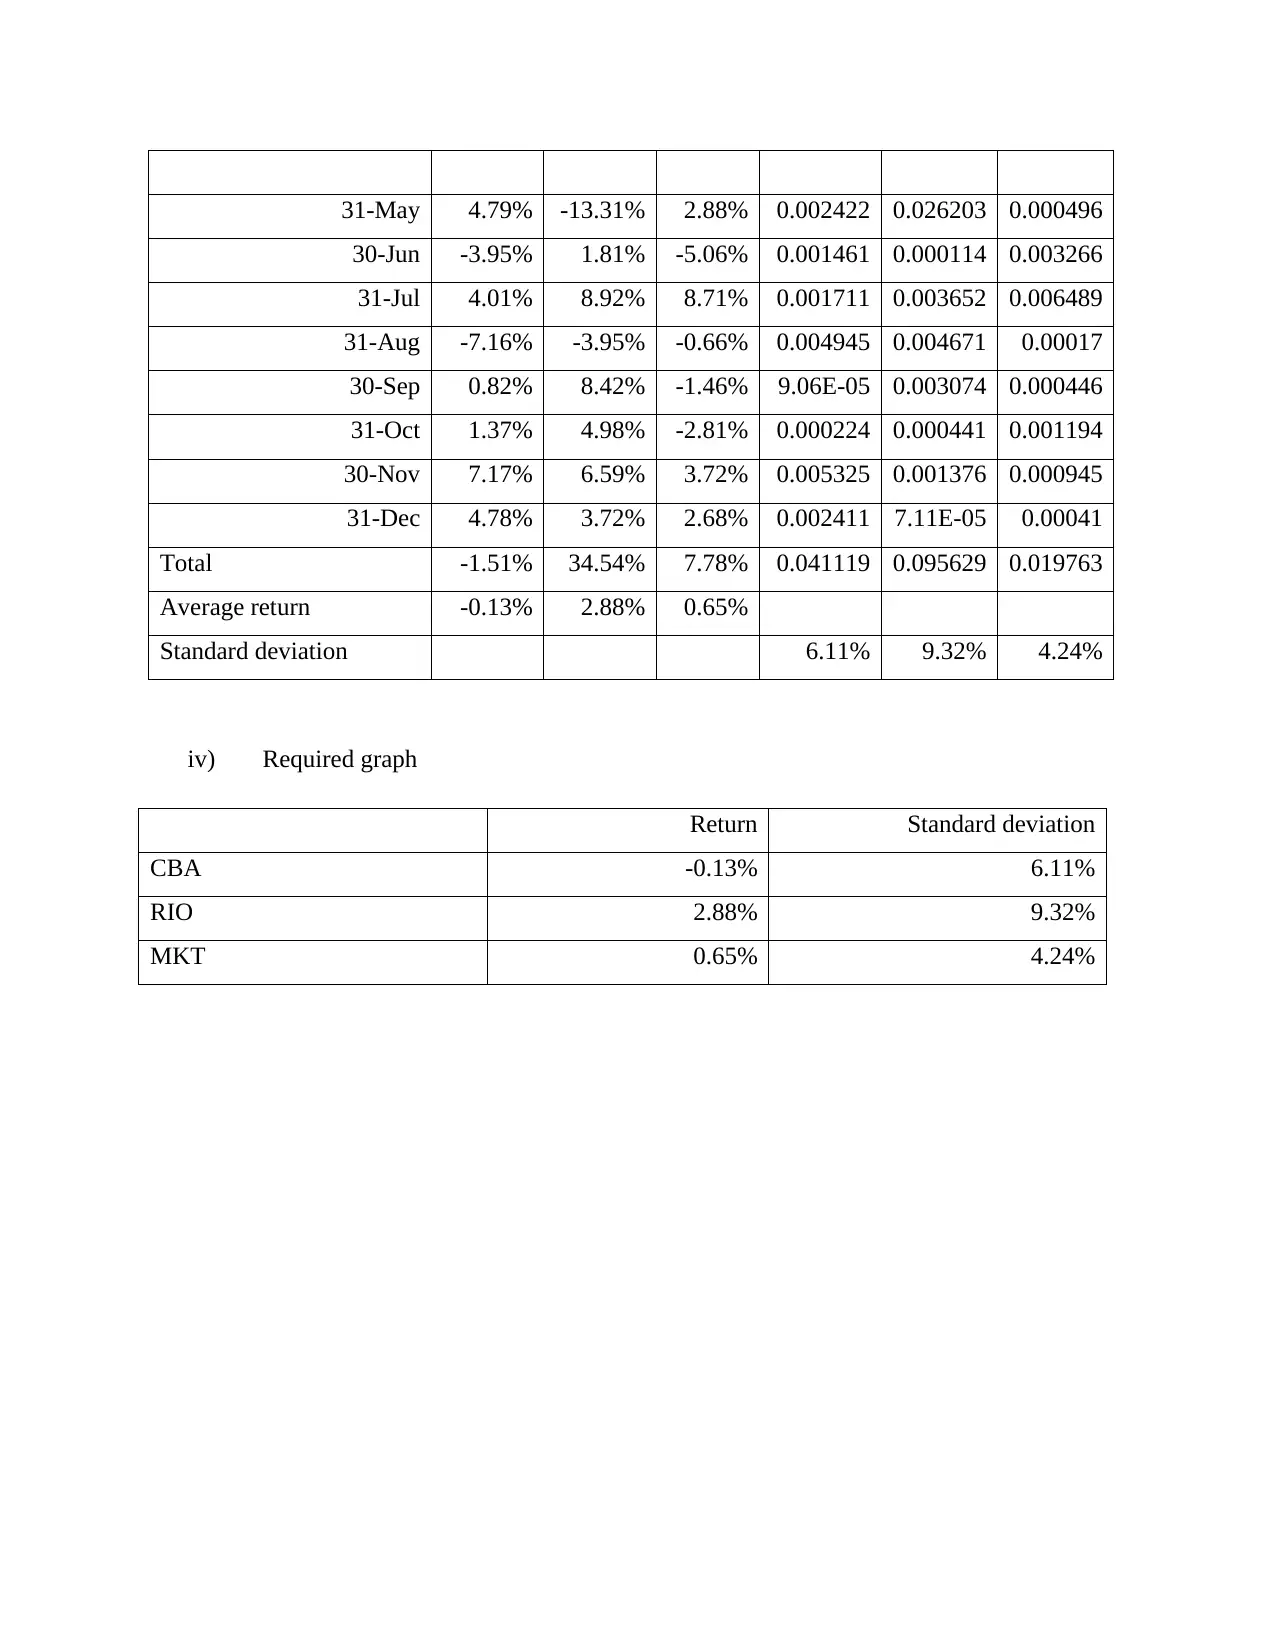
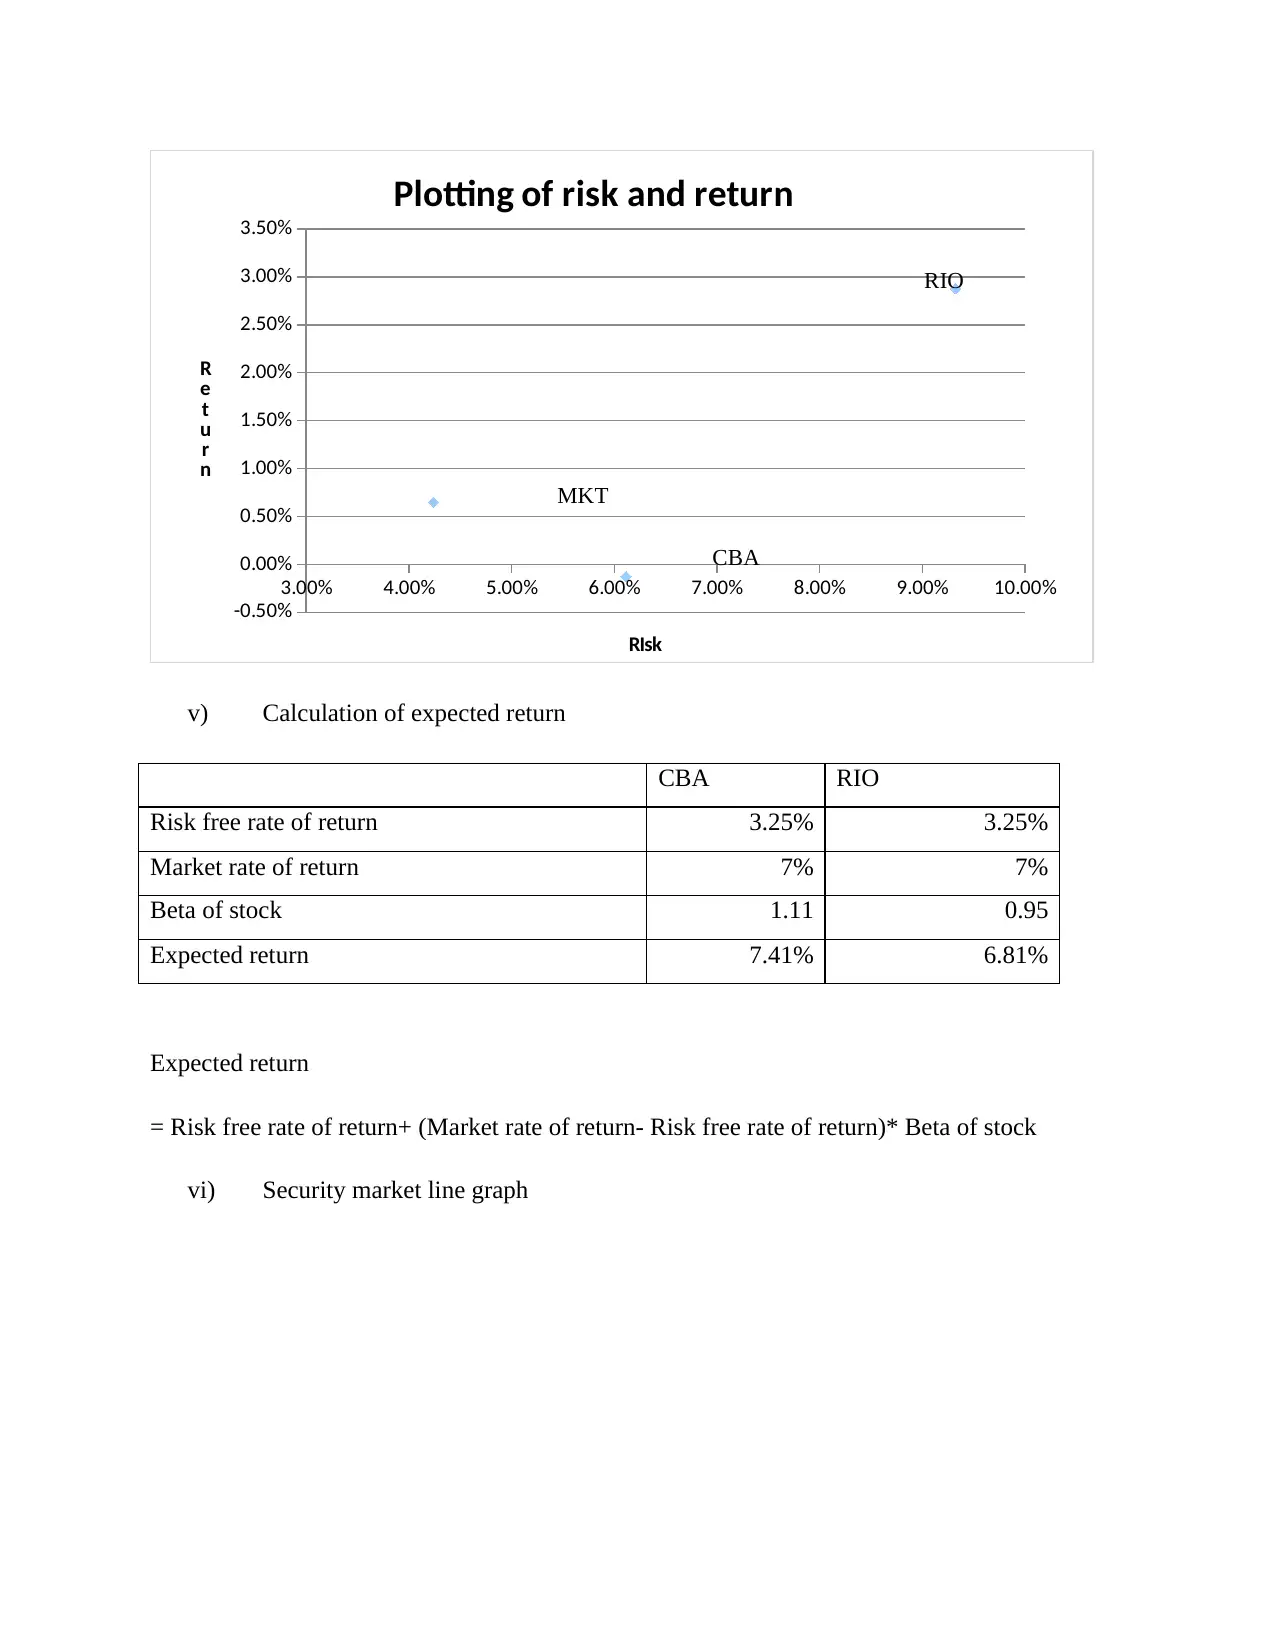
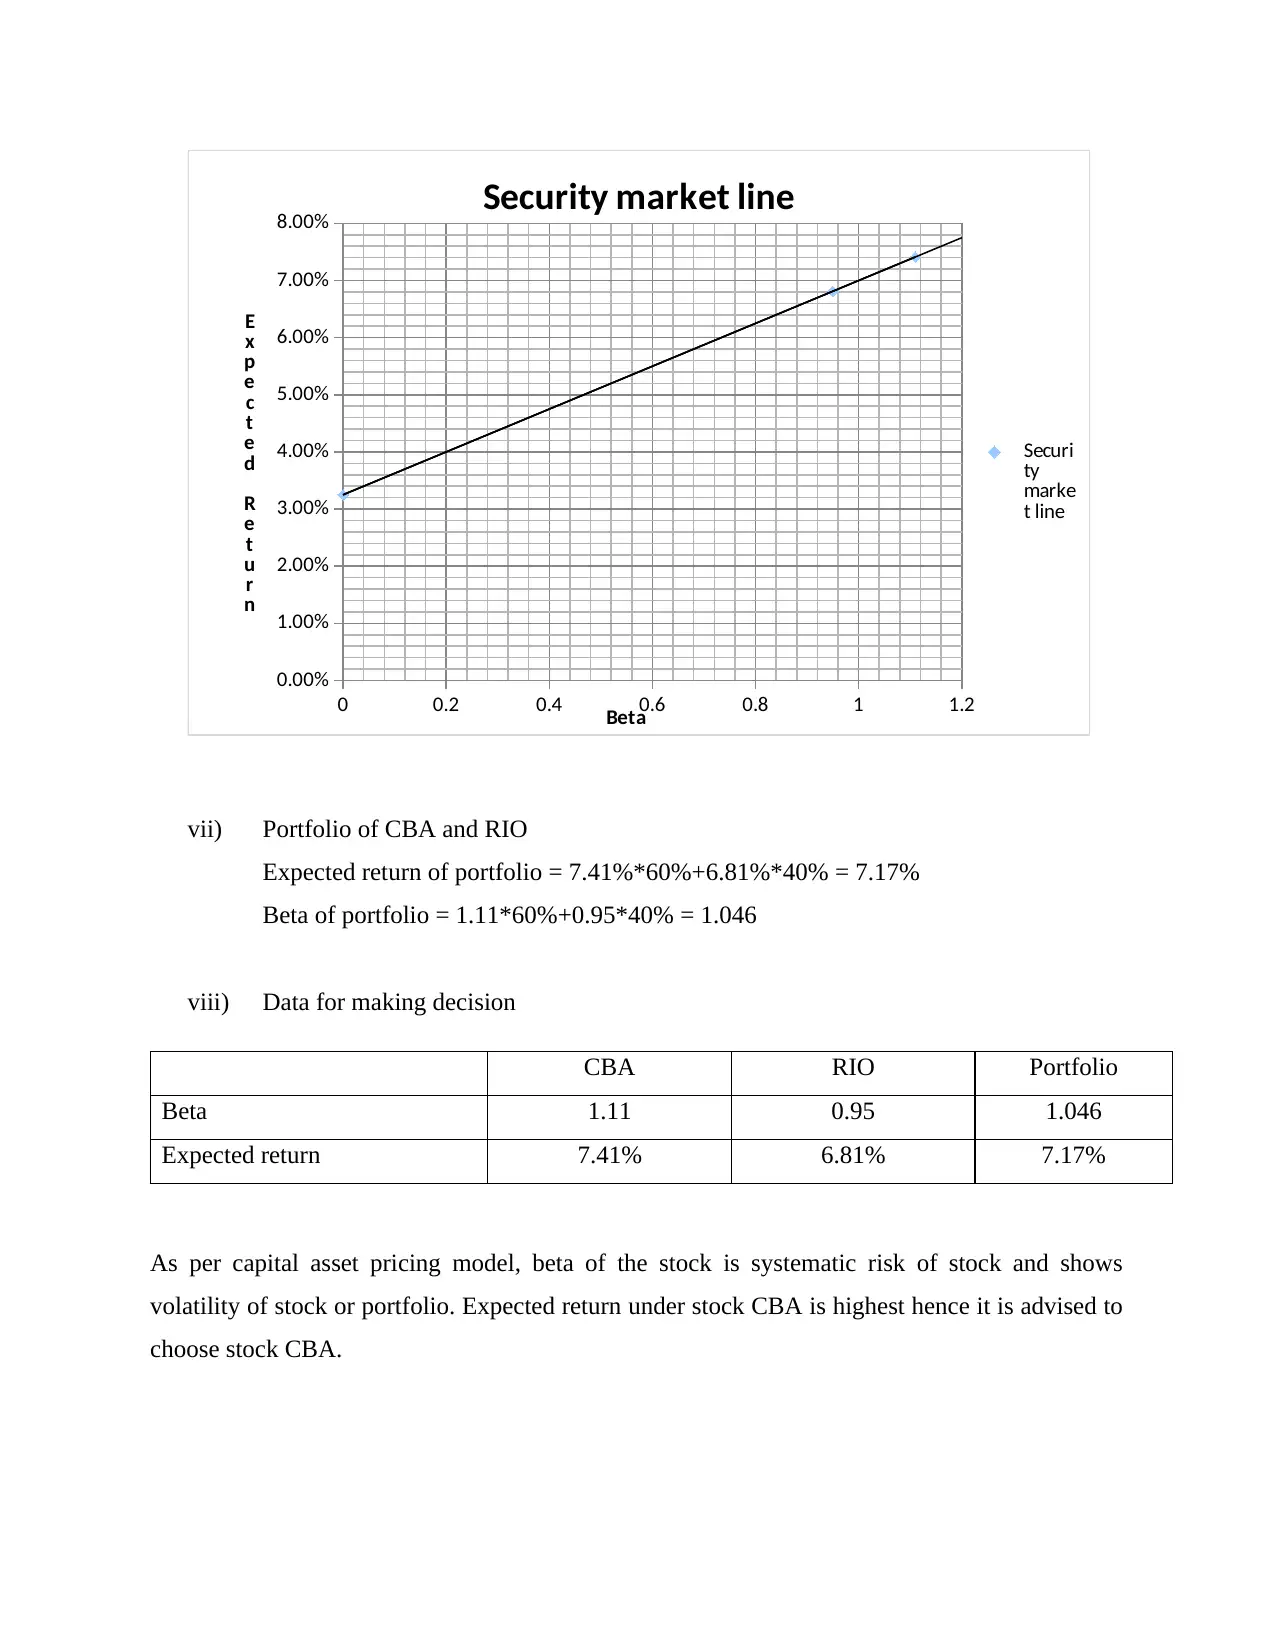
This finance assignment provides detailed solutions to three key questions. The first question involves financial calculations, including present value, future value, and annuity calculations. The second question delves into the concept of shareholder wealth maximization versus profit maximization, exploring risk aversion and its implications. The third question focuses on portfolio analysis, calculating monthly and annual holding period returns for two stocks (CBA and RIO), standard deviations, and expected returns. The assignment also includes the construction of a security market line graph and the calculation of a portfolio's expected return and beta, offering insights into investment decisions. The assignment also provides references to the sources used.

1 out of 12
Related Documents


Your All-in-One AI-Powered Toolkit for Academic Success.
+13062052269
info@desklib.com
Available 24*7 on WhatsApp / Email
![[object Object]](/_next/static/media/star-bottom.7253800d.svg)
Copyright © 2020–2026 A2Z Services. All Rights Reserved. Developed and managed by ZUCOL.