Finance Assignment: Portfolio Analysis, VaR, and Efficient Frontier
VerifiedAdded on 2023/02/01
|16
|3519
|35
Homework Assignment
AI Summary
This finance assignment analyzes a portfolio consisting of Apple Inc., Coca-Cola, and Netflix stocks. It includes calculating monthly returns, mean, variance, standard deviation, and correlation coefficients. The assignment determines portfolio weights, mean, variance, and standard deviation. It assesses portfolio return with a loss of 10% and calculates Value at Risk (VaR) at a 99% confidence level. An efficient frontier is drawn to optimize portfolio returns. The assignment further discusses the role of data analysis in the business, using a revenue data analyst's perspective at Hertz, and concludes with a case study of General Motors' change management strategies, emphasizing market analysis and adaptation.

Running head: FINANCE
Finance
Name of the Student:
Name of the University:
Author’s Note:
Course ID:
Finance
Name of the Student:
Name of the University:
Author’s Note:
Course ID:
Paraphrase This Document
Need a fresh take? Get an instant paraphrase of this document with our AI Paraphraser
1FINANCE
Table of Contents
Question 1:.......................................................................................................................................2
Question 2:.......................................................................................................................................8
Question 3:.....................................................................................................................................10
References:....................................................................................................................................15
2FINANCE
Question 1:
1. Selecting the stock of three publicly traded companies from different industries, while
depicting about the selection criteria:
The stocks selected from the portfolio are Apple Inc., Coco Cola and Netflix, as all the
three companies fall in different industries. Moreover, the stock selected for investment is
considered one of the market leaders, which can allow the portfolio to adequately improve their
overall returns from investment. The main criteria for the selection were to detect stock with the
highest market cap and market value.
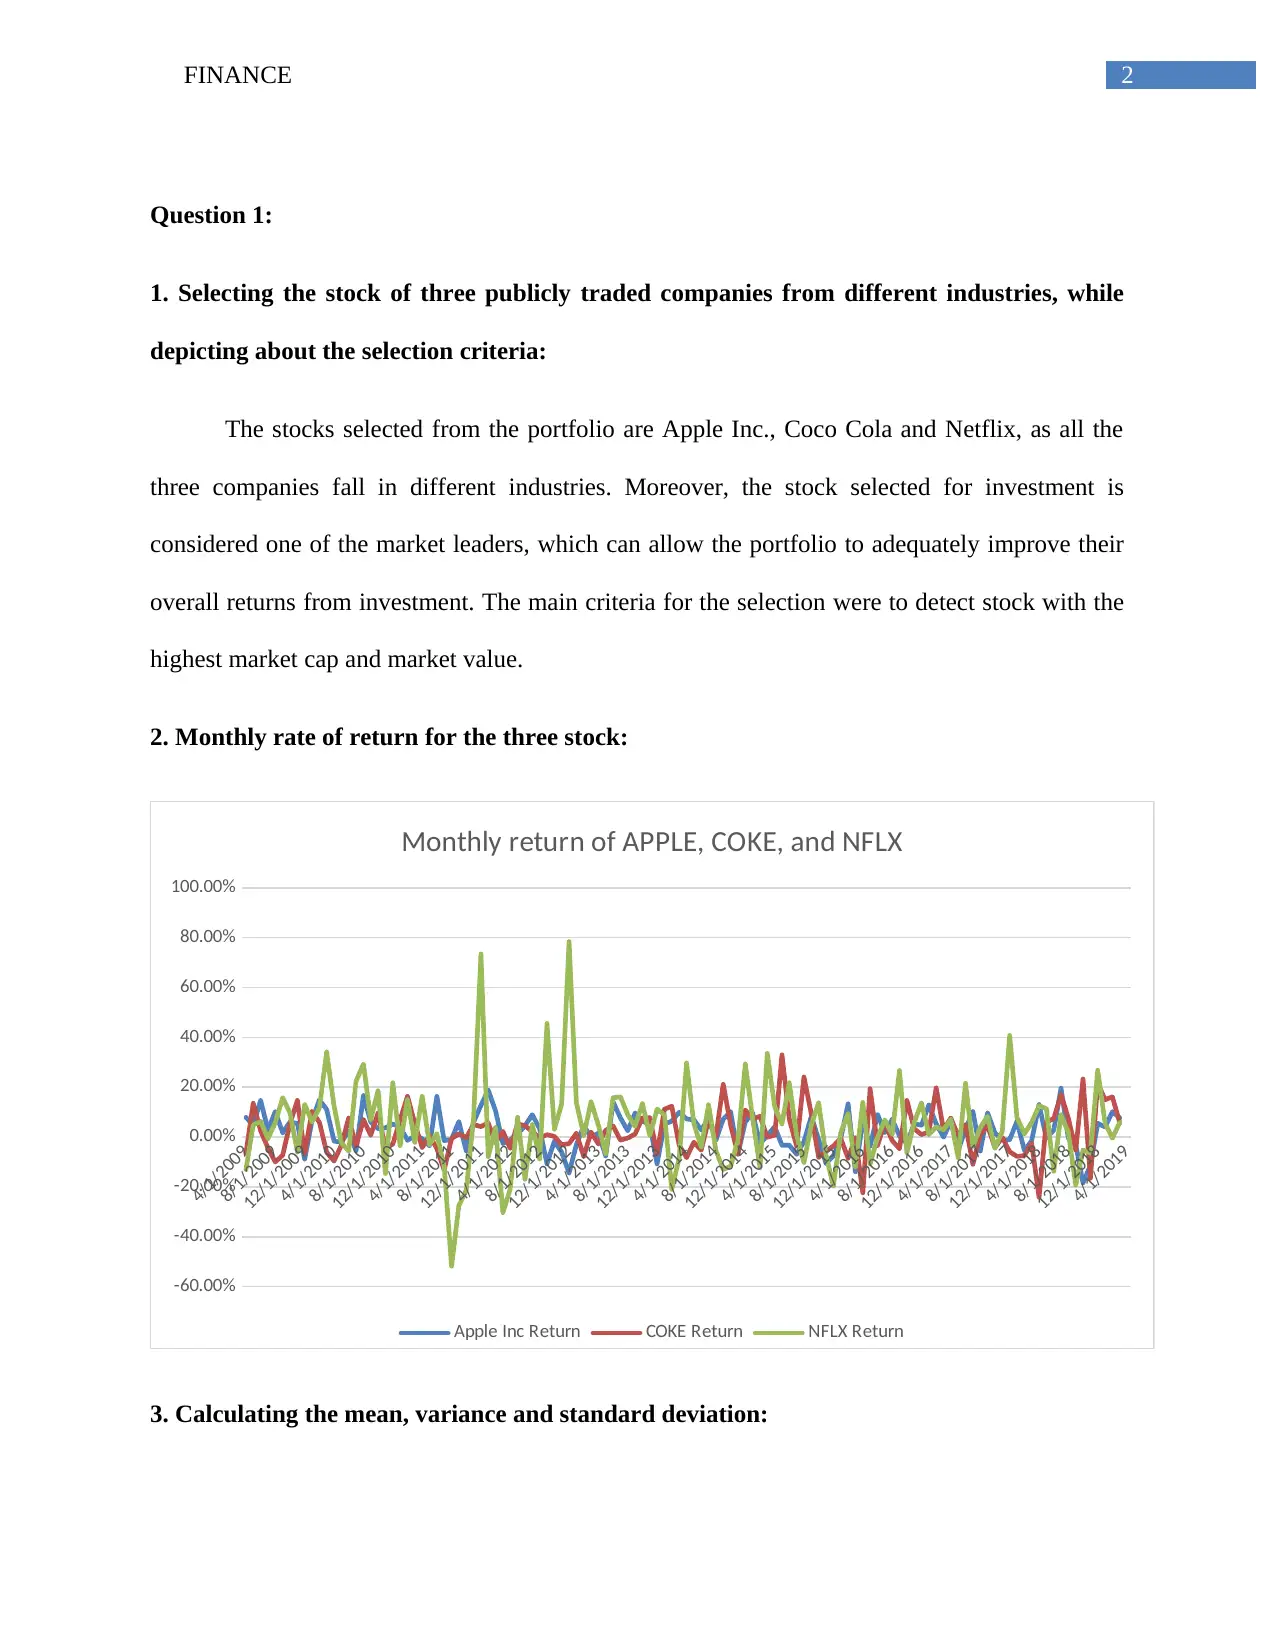
2. Monthly rate of return for the three stock:
4/1/2009
8/1/2009
12/1/2009
4/1/2010
8/1/2010
12/1/2010
4/1/2011
8/1/2011
12/1/2011
4/1/2012
8/1/2012
12/1/2012
4/1/2013
8/1/2013
12/1/2013
4/1/2014
8/1/2014
12/1/2014
4/1/2015
8/1/2015
12/1/2015
4/1/2016
8/1/2016
12/1/2016
4/1/2017
8/1/2017
12/1/2017
4/1/2018
8/1/2018
12/1/2018
4/1/2019
-60.00%
-40.00%
-20.00%
0.00%
20.00%
40.00%
60.00%
80.00%
100.00%
Monthly return of APPLE, COKE, and NFLX
Apple Inc Return COKE Return NFLX Return
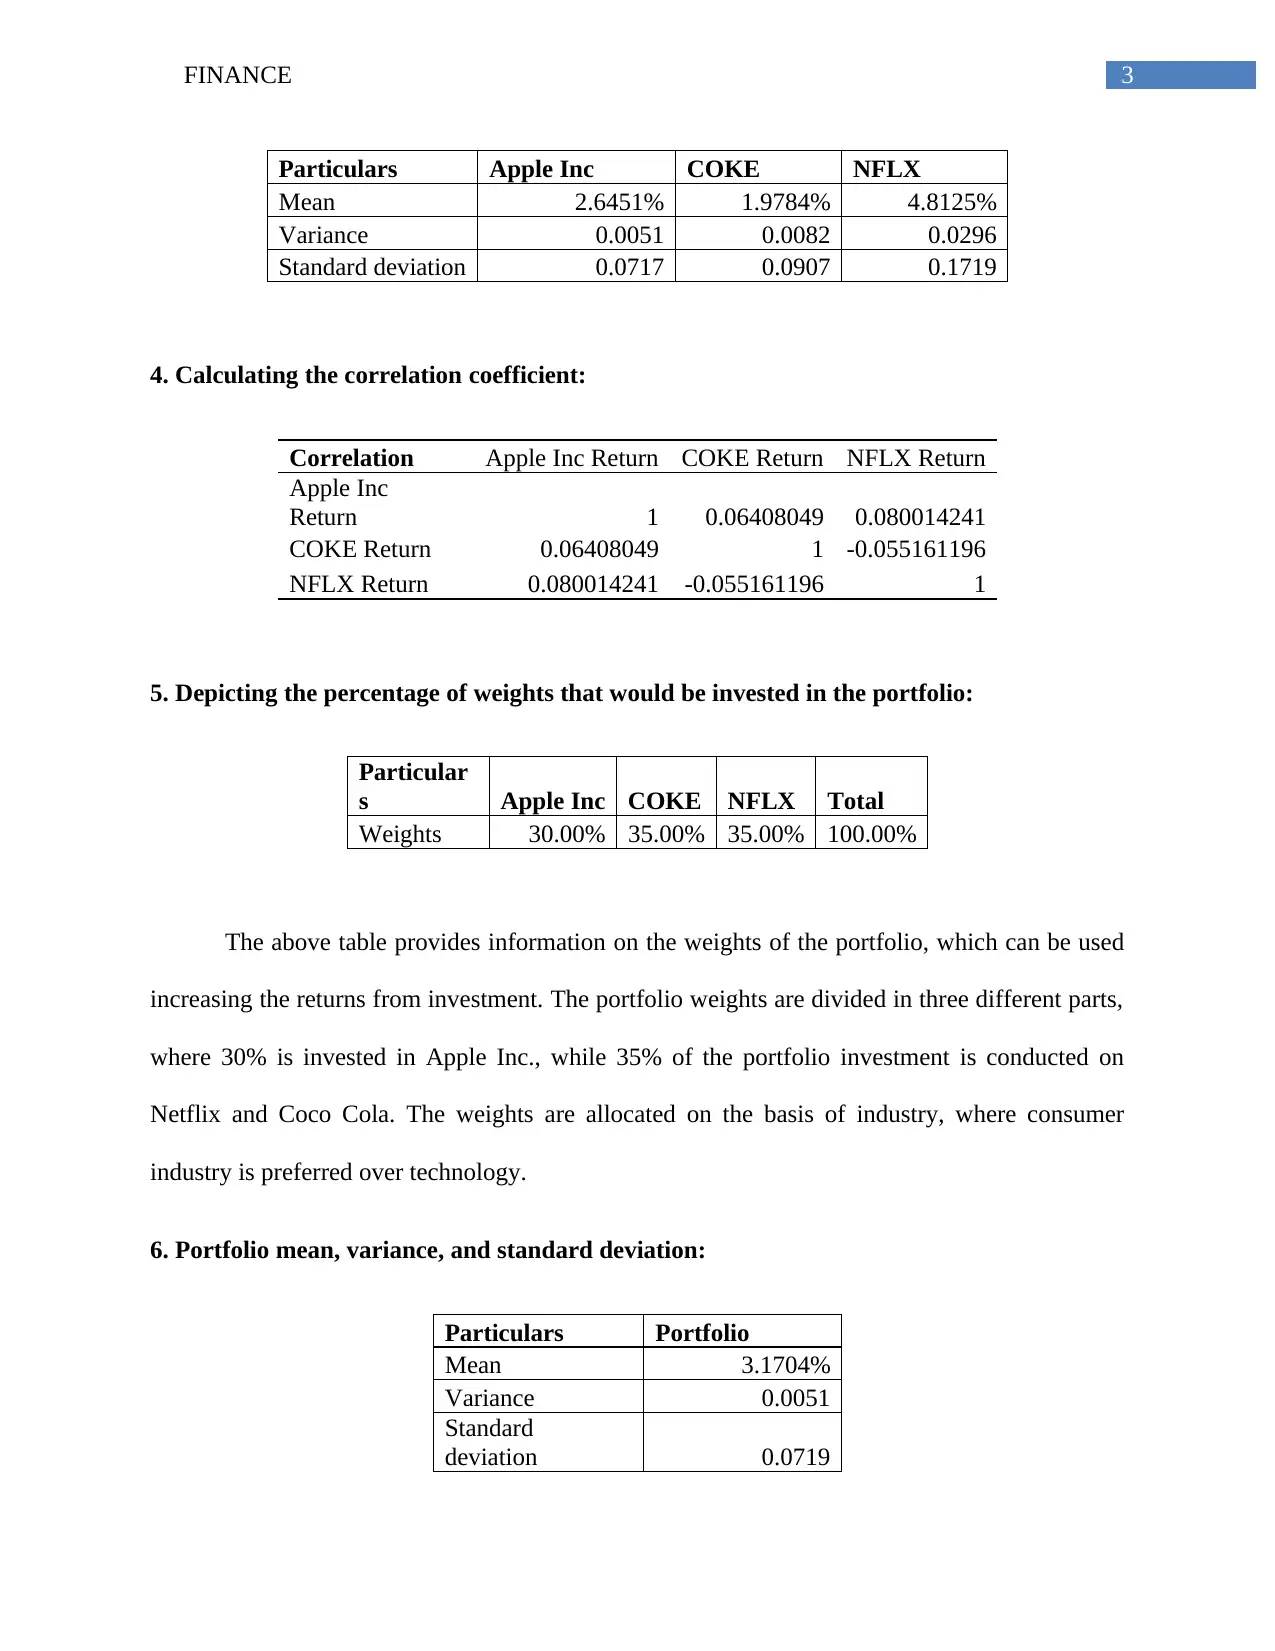
3. Calculating the mean, variance and standard deviation:
Question 1:
1. Selecting the stock of three publicly traded companies from different industries, while
depicting about the selection criteria:
The stocks selected from the portfolio are Apple Inc., Coco Cola and Netflix, as all the
three companies fall in different industries. Moreover, the stock selected for investment is
considered one of the market leaders, which can allow the portfolio to adequately improve their
overall returns from investment. The main criteria for the selection were to detect stock with the
highest market cap and market value.
2. Monthly rate of return for the three stock:
4/1/2009
8/1/2009
12/1/2009
4/1/2010
8/1/2010
12/1/2010
4/1/2011
8/1/2011
12/1/2011
4/1/2012
8/1/2012
12/1/2012
4/1/2013
8/1/2013
12/1/2013
4/1/2014
8/1/2014
12/1/2014
4/1/2015
8/1/2015
12/1/2015
4/1/2016
8/1/2016
12/1/2016
4/1/2017
8/1/2017
12/1/2017
4/1/2018
8/1/2018
12/1/2018
4/1/2019
-60.00%
-40.00%
-20.00%
0.00%
20.00%
40.00%
60.00%
80.00%
100.00%
Monthly return of APPLE, COKE, and NFLX
Apple Inc Return COKE Return NFLX Return
3. Calculating the mean, variance and standard deviation:
⊘ This is a preview!⊘
Do you want full access?
Subscribe today to unlock all pages.
Trusted by 1+ million students worldwide
3FINANCE
Particulars Apple Inc COKE NFLX
Mean 2.6451% 1.9784% 4.8125%
Variance 0.0051 0.0082 0.0296
Standard deviation 0.0717 0.0907 0.1719
4. Calculating the correlation coefficient:
Correlation Apple Inc Return COKE Return NFLX Return
Apple Inc
Return 1 0.06408049 0.080014241
COKE Return 0.06408049 1 -0.055161196
NFLX Return 0.080014241 -0.055161196 1
5. Depicting the percentage of weights that would be invested in the portfolio:
Particular
s Apple Inc COKE NFLX Total
Weights 30.00% 35.00% 35.00% 100.00%
The above table provides information on the weights of the portfolio, which can be used
increasing the returns from investment. The portfolio weights are divided in three different parts,
where 30% is invested in Apple Inc., while 35% of the portfolio investment is conducted on
Netflix and Coco Cola. The weights are allocated on the basis of industry, where consumer
industry is preferred over technology.
6. Portfolio mean, variance, and standard deviation:
Particulars Portfolio
Mean 3.1704%
Variance 0.0051
Standard
deviation 0.0719
Paraphrase This Document
Need a fresh take? Get an instant paraphrase of this document with our AI Paraphraser
4FINANCE
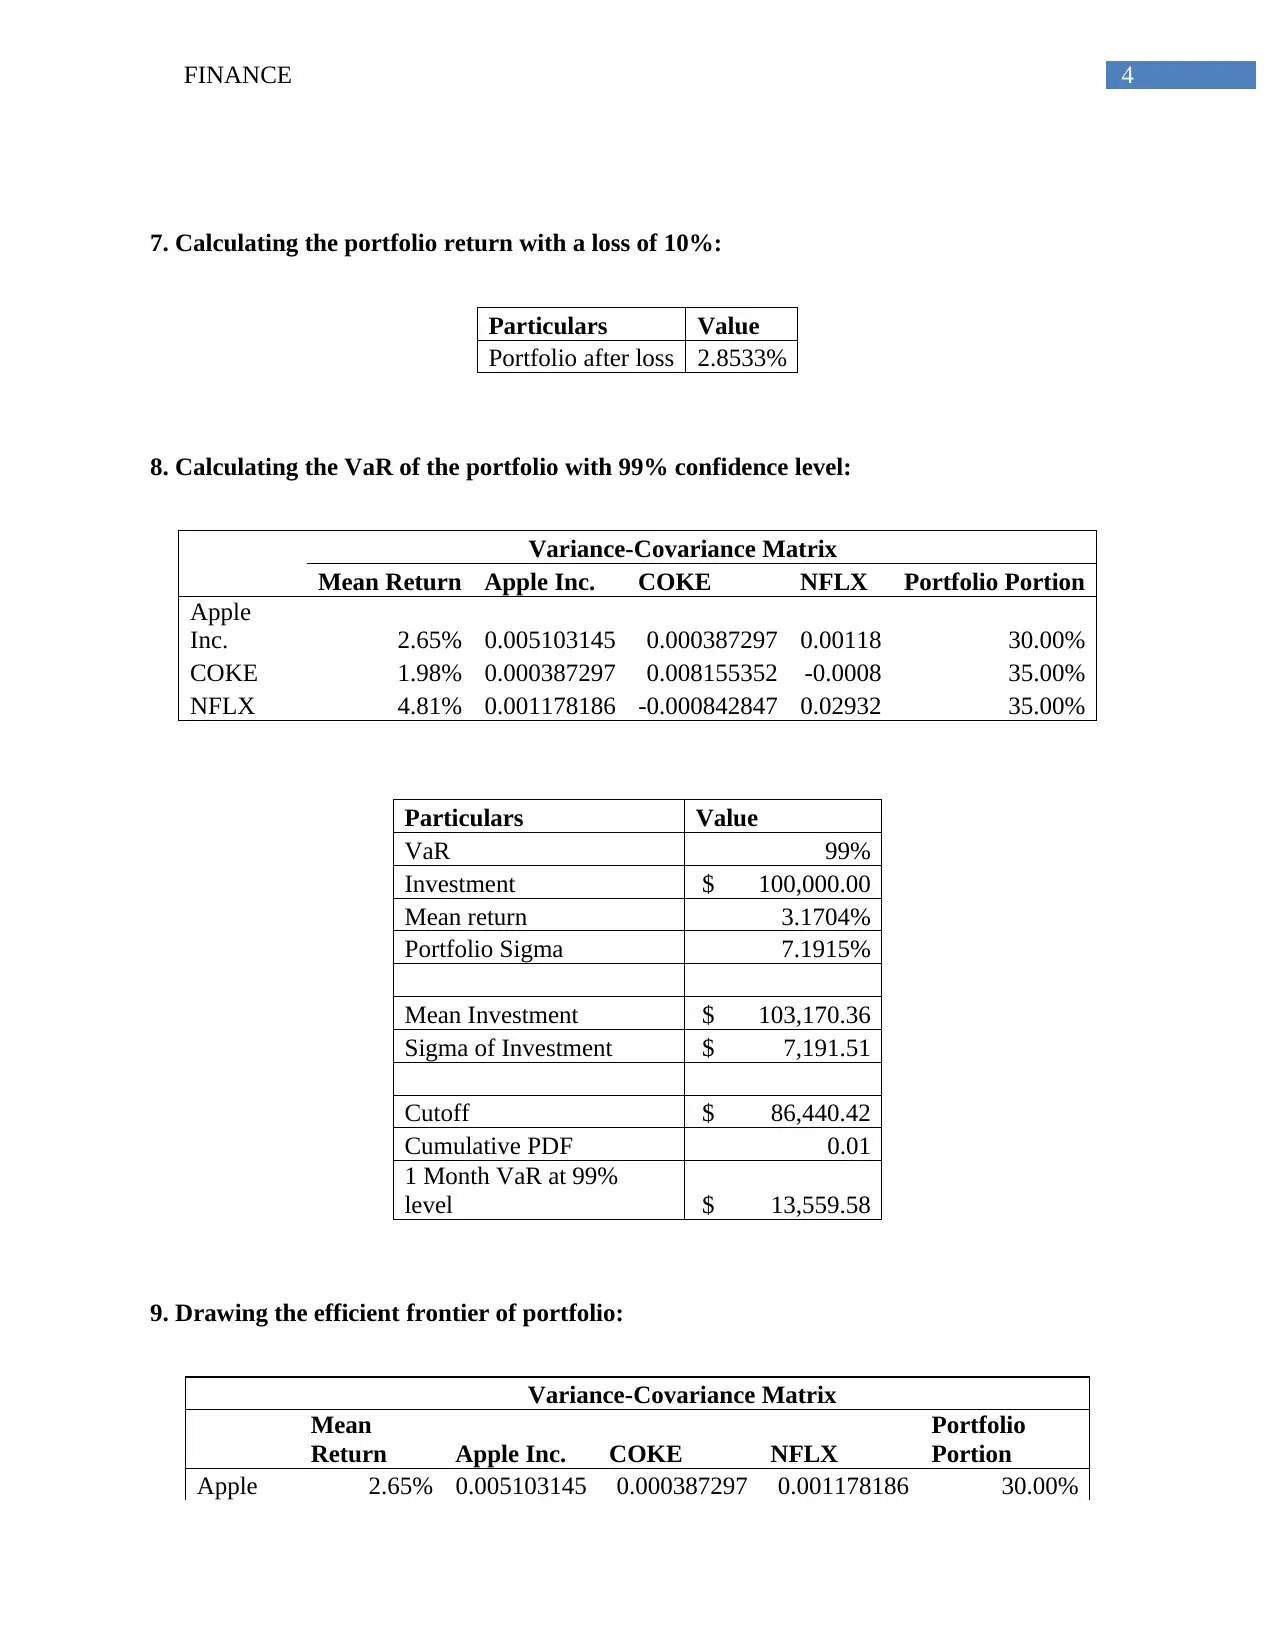
7. Calculating the portfolio return with a loss of 10%:
Particulars Value
Portfolio after loss 2.8533%
8. Calculating the VaR of the portfolio with 99% confidence level:
Variance-Covariance Matrix
Mean Return Apple Inc. COKE NFLX Portfolio Portion
Apple
Inc. 2.65% 0.005103145 0.000387297 0.00118 30.00%
COKE 1.98% 0.000387297 0.008155352 -0.0008 35.00%
NFLX 4.81% 0.001178186 -0.000842847 0.02932 35.00%
Particulars Value
VaR 99%
Investment $ 100,000.00
Mean return 3.1704%
Portfolio Sigma 7.1915%
Mean Investment $ 103,170.36
Sigma of Investment $ 7,191.51
Cutoff $ 86,440.42
Cumulative PDF 0.01
1 Month VaR at 99%
level $ 13,559.58
9. Drawing the efficient frontier of portfolio:
Variance-Covariance Matrix
Mean
Return Apple Inc. COKE NFLX
Portfolio
Portion
Apple 2.65% 0.005103145 0.000387297 0.001178186 30.00%
5FINANCE
Inc
COKE 1.98% 0.000387297 0.008155352
-
0.000842847 35.00%
NFLX 4.81% 0.001178186
-
0.000842847 0.029315994 35.00%
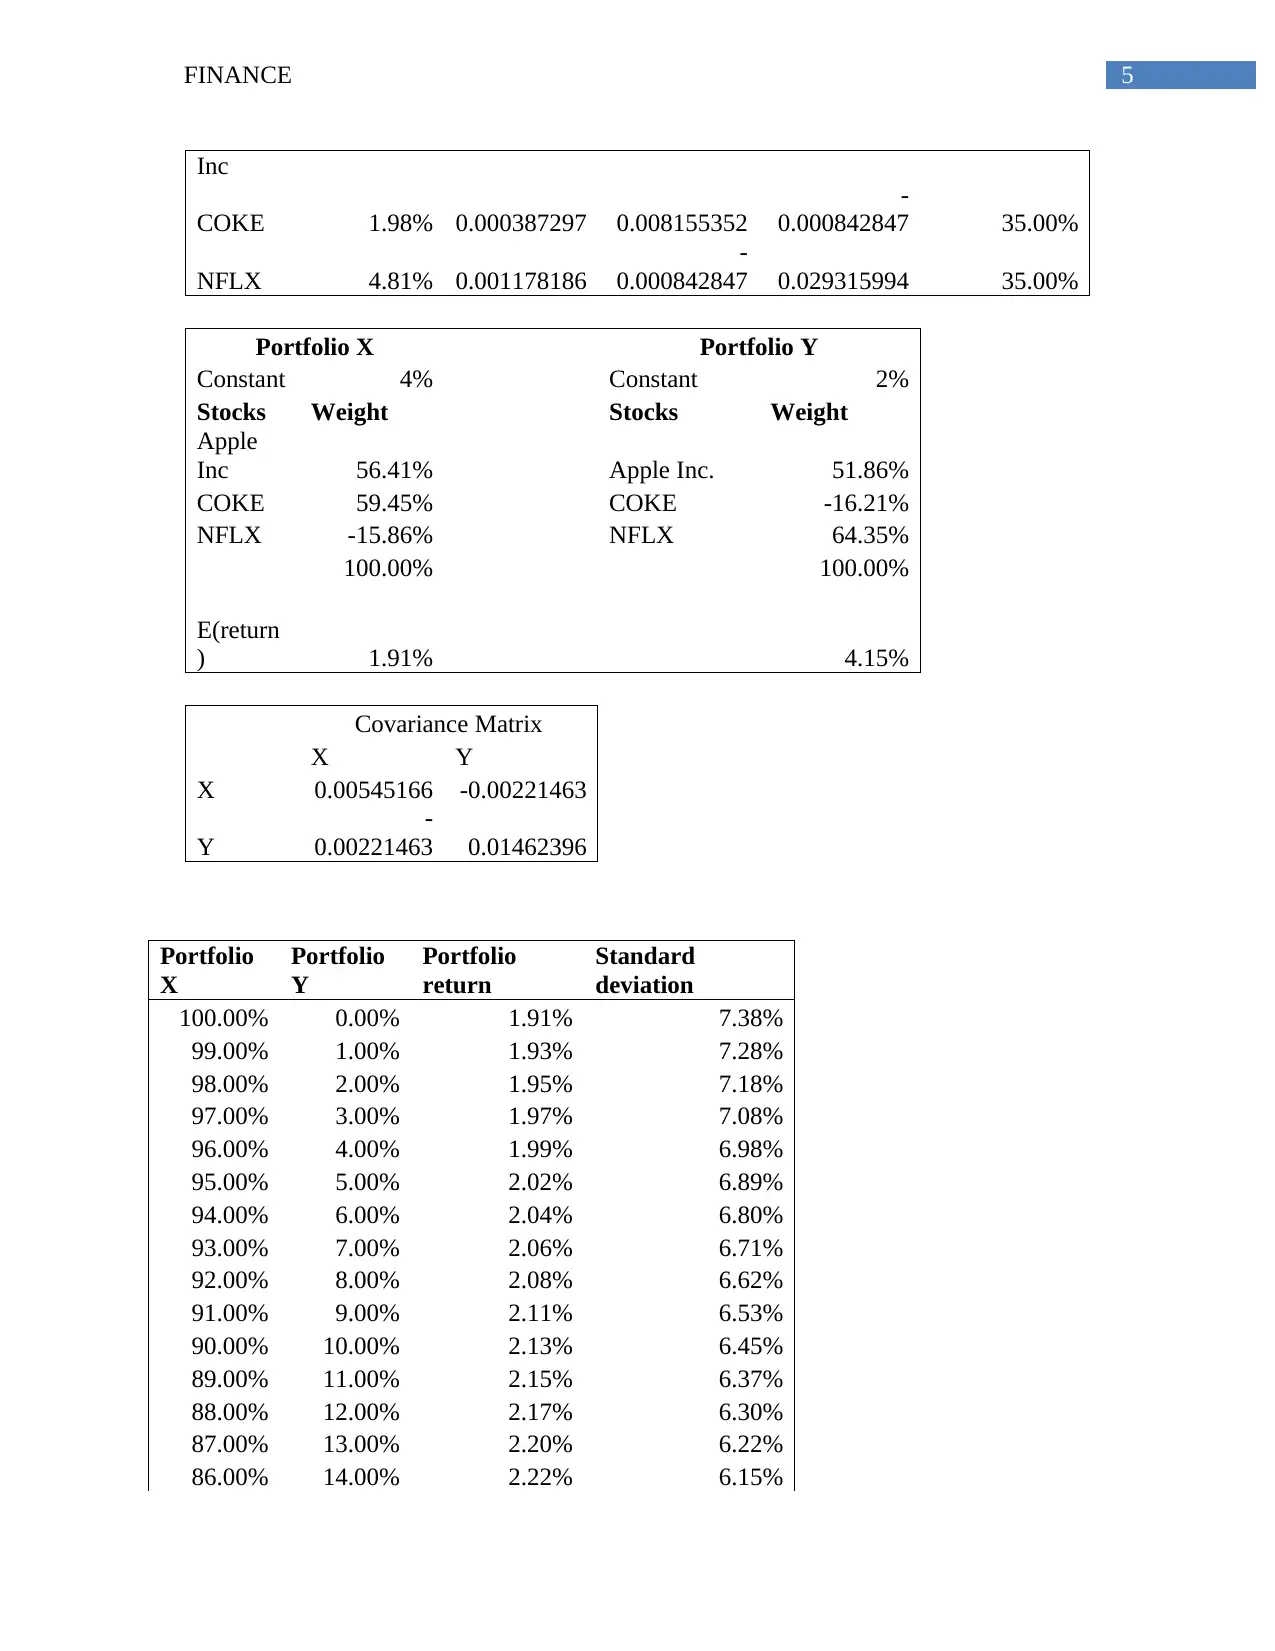
Portfolio X Portfolio Y
Constant 4% Constant 2%
Stocks Weight Stocks Weight
Apple
Inc 56.41% Apple Inc. 51.86%
COKE 59.45% COKE -16.21%
NFLX -15.86% NFLX 64.35%
100.00% 100.00%
E(return
) 1.91% 4.15%
Covariance Matrix
X Y
X 0.00545166 -0.00221463
Y
-
0.00221463 0.01462396
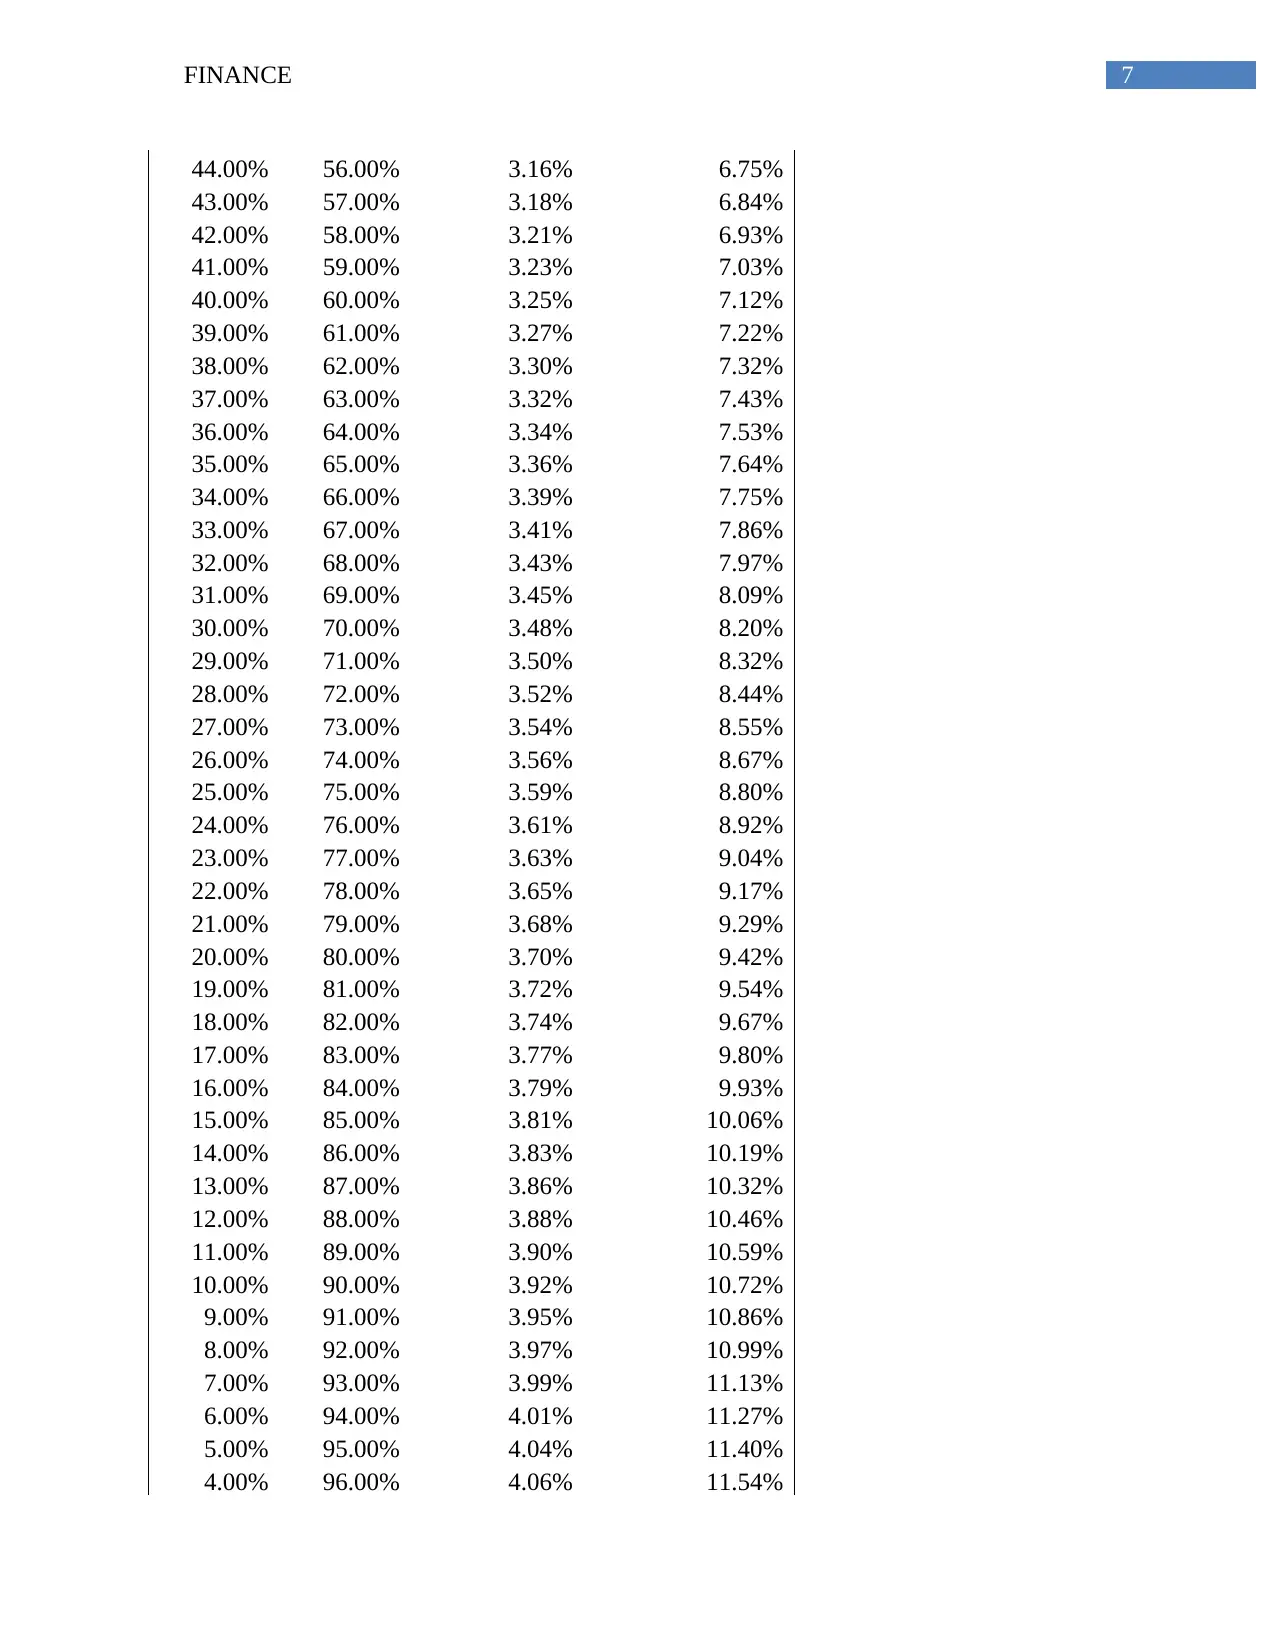
Portfolio
X
Portfolio
Y
Portfolio
return
Standard
deviation
100.00% 0.00% 1.91% 7.38%
99.00% 1.00% 1.93% 7.28%
98.00% 2.00% 1.95% 7.18%
97.00% 3.00% 1.97% 7.08%
96.00% 4.00% 1.99% 6.98%
95.00% 5.00% 2.02% 6.89%
94.00% 6.00% 2.04% 6.80%
93.00% 7.00% 2.06% 6.71%
92.00% 8.00% 2.08% 6.62%
91.00% 9.00% 2.11% 6.53%
90.00% 10.00% 2.13% 6.45%
89.00% 11.00% 2.15% 6.37%
88.00% 12.00% 2.17% 6.30%
87.00% 13.00% 2.20% 6.22%
86.00% 14.00% 2.22% 6.15%
Inc
COKE 1.98% 0.000387297 0.008155352
-
0.000842847 35.00%
NFLX 4.81% 0.001178186
-
0.000842847 0.029315994 35.00%
Portfolio X Portfolio Y
Constant 4% Constant 2%
Stocks Weight Stocks Weight
Apple
Inc 56.41% Apple Inc. 51.86%
COKE 59.45% COKE -16.21%
NFLX -15.86% NFLX 64.35%
100.00% 100.00%
E(return
) 1.91% 4.15%
Covariance Matrix
X Y
X 0.00545166 -0.00221463
Y
-
0.00221463 0.01462396
Portfolio
X
Portfolio
Y
Portfolio
return
Standard
deviation
100.00% 0.00% 1.91% 7.38%
99.00% 1.00% 1.93% 7.28%
98.00% 2.00% 1.95% 7.18%
97.00% 3.00% 1.97% 7.08%
96.00% 4.00% 1.99% 6.98%
95.00% 5.00% 2.02% 6.89%
94.00% 6.00% 2.04% 6.80%
93.00% 7.00% 2.06% 6.71%
92.00% 8.00% 2.08% 6.62%
91.00% 9.00% 2.11% 6.53%
90.00% 10.00% 2.13% 6.45%
89.00% 11.00% 2.15% 6.37%
88.00% 12.00% 2.17% 6.30%
87.00% 13.00% 2.20% 6.22%
86.00% 14.00% 2.22% 6.15%
⊘ This is a preview!⊘
Do you want full access?
Subscribe today to unlock all pages.
Trusted by 1+ million students worldwide

6FINANCE
85.00% 15.00% 2.24% 6.09%
84.00% 16.00% 2.26% 6.02%
83.00% 17.00% 2.29% 5.96%
82.00% 18.00% 2.31% 5.90%
81.00% 19.00% 2.33% 5.85%
80.00% 20.00% 2.35% 5.80%
79.00% 21.00% 2.38% 5.76%
78.00% 22.00% 2.40% 5.71%
77.00% 23.00% 2.42% 5.68%
76.00% 24.00% 2.44% 5.64%
75.00% 25.00% 2.47% 5.61%
74.00% 26.00% 2.49% 5.59%
73.00% 27.00% 2.51% 5.57%
72.00% 28.00% 2.53% 5.55%
71.00% 29.00% 2.56% 5.54%
70.00% 30.00% 2.58% 5.53%
69.00% 31.00% 2.60% 5.53%
68.00% 32.00% 2.62% 5.53%
67.00% 33.00% 2.65% 5.53%
66.00% 34.00% 2.67% 5.54%
65.00% 35.00% 2.69% 5.56%
64.00% 36.00% 2.71% 5.57%
63.00% 37.00% 2.73% 5.60%
62.00% 38.00% 2.76% 5.62%
61.00% 39.00% 2.78% 5.66%
60.00% 40.00% 2.80% 5.69%
59.00% 41.00% 2.82% 5.73%
58.00% 42.00% 2.85% 5.77%
57.00% 43.00% 2.87% 5.82%
56.00% 44.00% 2.89% 5.87%
55.00% 45.00% 2.91% 5.93%
54.00% 46.00% 2.94% 5.99%
53.00% 47.00% 2.96% 6.05%
52.00% 48.00% 2.98% 6.11%
51.00% 49.00% 3.00% 6.18%
50.00% 50.00% 3.03% 6.25%
49.00% 51.00% 3.05% 6.33%
48.00% 52.00% 3.07% 6.41%
47.00% 53.00% 3.09% 6.49%
46.00% 54.00% 3.12% 6.57%
45.00% 55.00% 3.14% 6.66%
Paraphrase This Document
Need a fresh take? Get an instant paraphrase of this document with our AI Paraphraser
7FINANCE
44.00% 56.00% 3.16% 6.75%
43.00% 57.00% 3.18% 6.84%
42.00% 58.00% 3.21% 6.93%
41.00% 59.00% 3.23% 7.03%
40.00% 60.00% 3.25% 7.12%
39.00% 61.00% 3.27% 7.22%
38.00% 62.00% 3.30% 7.32%
37.00% 63.00% 3.32% 7.43%
36.00% 64.00% 3.34% 7.53%
35.00% 65.00% 3.36% 7.64%
34.00% 66.00% 3.39% 7.75%
33.00% 67.00% 3.41% 7.86%
32.00% 68.00% 3.43% 7.97%
31.00% 69.00% 3.45% 8.09%
30.00% 70.00% 3.48% 8.20%
29.00% 71.00% 3.50% 8.32%
28.00% 72.00% 3.52% 8.44%
27.00% 73.00% 3.54% 8.55%
26.00% 74.00% 3.56% 8.67%
25.00% 75.00% 3.59% 8.80%
24.00% 76.00% 3.61% 8.92%
23.00% 77.00% 3.63% 9.04%
22.00% 78.00% 3.65% 9.17%
21.00% 79.00% 3.68% 9.29%
20.00% 80.00% 3.70% 9.42%
19.00% 81.00% 3.72% 9.54%
18.00% 82.00% 3.74% 9.67%
17.00% 83.00% 3.77% 9.80%
16.00% 84.00% 3.79% 9.93%
15.00% 85.00% 3.81% 10.06%
14.00% 86.00% 3.83% 10.19%
13.00% 87.00% 3.86% 10.32%
12.00% 88.00% 3.88% 10.46%
11.00% 89.00% 3.90% 10.59%
10.00% 90.00% 3.92% 10.72%
9.00% 91.00% 3.95% 10.86%
8.00% 92.00% 3.97% 10.99%
7.00% 93.00% 3.99% 11.13%
6.00% 94.00% 4.01% 11.27%
5.00% 95.00% 4.04% 11.40%
4.00% 96.00% 4.06% 11.54%
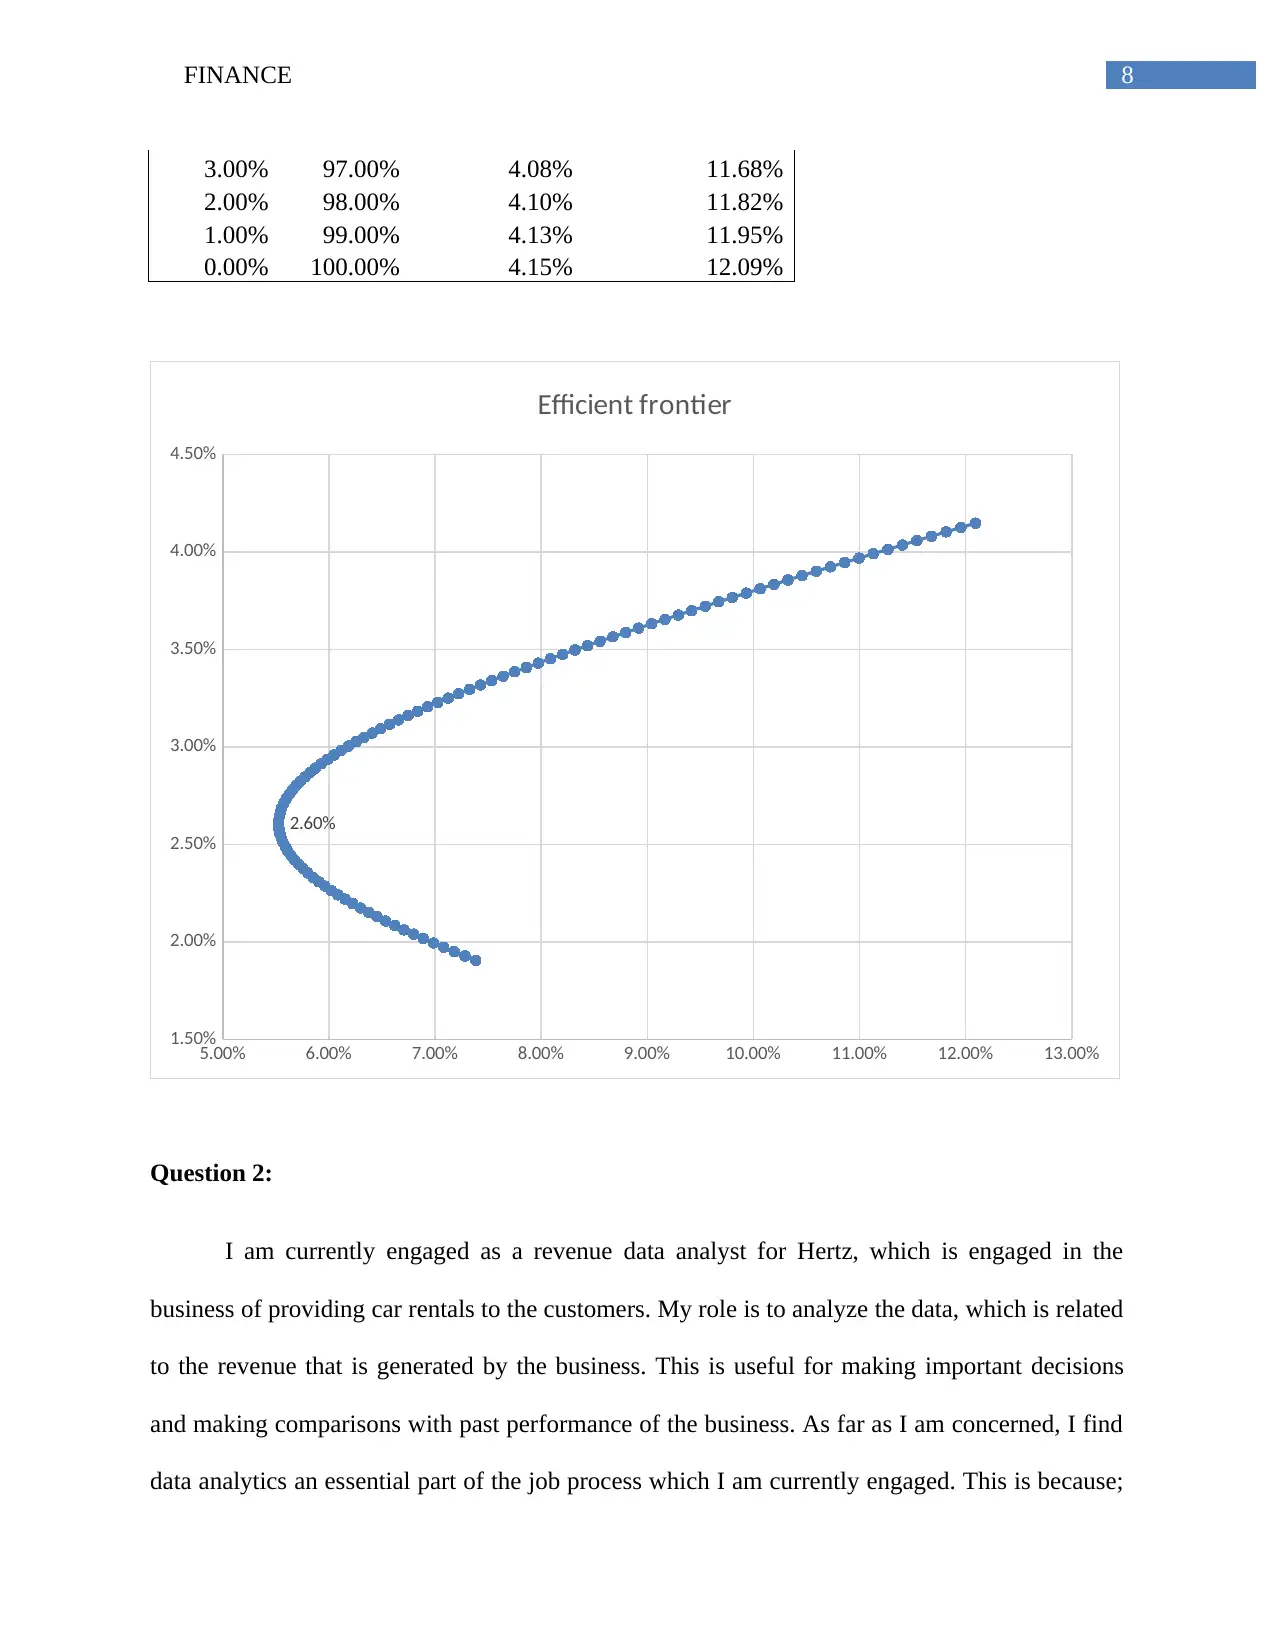
8FINANCE
3.00% 97.00% 4.08% 11.68%
2.00% 98.00% 4.10% 11.82%
1.00% 99.00% 4.13% 11.95%
0.00% 100.00% 4.15% 12.09%
5.00% 6.00% 7.00% 8.00% 9.00% 10.00% 11.00% 12.00% 13.00%
1.50%
2.00%
2.50%
3.00%
3.50%
4.00%
4.50%
2.60%
Efficient frontier
Question 2:
I am currently engaged as a revenue data analyst for Hertz, which is engaged in the
business of providing car rentals to the customers. My role is to analyze the data, which is related
to the revenue that is generated by the business. This is useful for making important decisions
and making comparisons with past performance of the business. As far as I am concerned, I find
data analytics an essential part of the job process which I am currently engaged. This is because;
⊘ This is a preview!⊘
Do you want full access?
Subscribe today to unlock all pages.
Trusted by 1+ million students worldwide

9FINANCE
it effectively identifies the hotspot in the population from where the business is able to derive
maximum revenue. In addition to this, the management of the company can recognize whether
the business is growing or not on the basis of the data which is available.
I have gained an interest in the subject where I first experienced the use of data and the
widespread application of the same. I am come to terms that no matter what the nature of the
business is, every business has some data and the management relies on such data for predicting
the likelihood of the business in near future. Similarly, the business which I am associated with is
engaged with is associated with car rentals. The company uses the data, which we collect for
estimating the future. I believe that they decide whether to invest more funds in the business and
expand its operations or just avoid risks and continue with the operations of the business. In
addition to this, I get to learn to operate different machine learning software for conducting data
analytics. As per present scenario, my company uses R programming language for analyzing the
data and modelling the same.
One thing that I become aware while doing my job as a revenue analyst is that data
analysis requires in-depth knowledge of statistics and important functions such as variances,
correlation, and regression analysis. Despite in-depth knowledge of statistics being important, in
practical life we need to have knowledge of different programs, which are used for the purpose
of analyzing data of a business. This post as revenue analysts has taught me a lot of about
application of programming language.
When I first started the job, I found it slightly difficult to run the programs for analyzing
the data, which was because I had more of a theoretical knowledge and limited practical
knowledge. In my studies, the data, which we used for analysis, was not so much in numbers.
Paraphrase This Document
Need a fresh take? Get an instant paraphrase of this document with our AI Paraphraser
10FINANCE
However, I started to find it much more comfortable as time passes. I am now confident that I
would be able to operate R programming language easily even if I switch my job. I want to learn
more data analytics programs such as RapidMiner, Tableau and SAS. I believe that I can excel in
this area and develop further. I have realized that data which is available to the management is
the basis on which trends are identified and major business decisions are taken with a view to
achieve the goals of the business.
Question 3:
1. Managing Changes in a Business
In a business, Change Management is essential especially in times when the level of
competition in the market is very high (Hayes, 2018). The nature of the change, which is to be
brought about by the management, depends on the market position of the business and
competitive pressure in the industry. The company, which is considered for this part, is General
Motors. In the case of General Motors, which was considered to be one of the biggest vehicle
manufacturing companies in the world, faced serious competition in the market from its biggest
competitor Toyota which had successfully captured the market which resulted in steep fall in the
sales of the business and ultimately led to bankruptcy of the business (Helper & Henderson,
2014).
2. Steps taken by the Management
It was due to the efforts of the management and the Government that the company was
revived and significant changes were brought about in the management of the company. The
managers of the company played a significant role in bringing about change in the business
(Kuipers et al., 2014). The managers of the company decide the approaches, which needs to be
11FINANCE
taken and identify what particular changes need to be brought about in the business. It is also to
be noted that the management also needs to take steps for the purpose of sustaining the changes
which is made by the management and ensure that the same are appropriate to the needs of the
business (Pugh, 2016). Therefore, it can be said that the management of the company has played
an important role in bringing about change management and ensuring that the business is able to
adapt to the market situation.
It is a known fact that resistance from the part of the employee often meets changes in the
business structure as they are of the opinion that the same can affect their lives. It is the role of
the management of the company to assure the employee that such changes are for the benefit of
everyone and ensure that the changes are implemented. In order to bring about changes in the
business, the management took a detailed analysis of the market. The management of the
company undertook SWOT Analysis for identifying the strength, weaknesses, opportunities and
threats of the business (Booth, 2015). This allowed the management to make the necessary
changes in the products and processes of the business so that the company can be reestablished in
the market. Some of the factors which have been recognized which needed to be changed are
cutting the costs of the business, introducing Hybrid engine system, bringing about new
innovation to the products which is offered by the business in order to combat competitive
pressure.
3. Lewin’s Change Model
In order to understand the areas, which needed change, the management applied Lewin’s
Change model (Cummings, Bridgman & Brown, 2016). This model effectively identified the
⊘ This is a preview!⊘
Do you want full access?
Subscribe today to unlock all pages.
Trusted by 1+ million students worldwide
1 out of 16
Related Documents


Your All-in-One AI-Powered Toolkit for Academic Success.
+13062052269
info@desklib.com
Available 24*7 on WhatsApp / Email
![[object Object]](/_next/static/media/star-bottom.7253800d.svg)
Unlock your academic potential
Copyright © 2020–2026 A2Z Services. All Rights Reserved. Developed and managed by ZUCOL.