Business Finance Project: Analyzing Portfolio Risk and Return (FIN205)
VerifiedAdded on 2022/09/18
|9
|1405
|24
Project
AI Summary
This business finance project examines portfolio risk and return, comparing the performance of five companies with the ASX200 index. The analysis includes calculating average returns, standard deviations, and beta values to assess the risk and volatility of each company and the equally weighted portfolio. The project identifies that while some stocks outperformed the market, others underperformed, and the equally weighted portfolio demonstrated lower risk compared to individual stocks. The report provides recommendations for a client of Tri-Star Management, suggesting investment in the equally weighted portfolio and highlighting the importance of balancing risk and return. The project utilizes financial metrics to evaluate investment opportunities and provide actionable insights, with references to relevant academic literature.

Running head: BUSINESS FINANCE
Business Finance
Student Name:
Student Number:
Authors Note:
Business Finance
Student Name:
Student Number:
Authors Note:
Paraphrase This Document
Need a fresh take? Get an instant paraphrase of this document with our AI Paraphraser
BUSINESS FINANCE
Table of Contents
Part 1:.........................................................................................................................................2
a) Comparing the average return on the ASX200 with each company:.....................................2
b) Identifying the average return of the portfolio, while explaining how the output was
derived:.......................................................................................................................................2
Part 2:.........................................................................................................................................3
a) Calculating the standard deviation of returns for the five companies, while depicting about
the overall risk of the companies:..............................................................................................3
b) Computing the standard deviation of the portfolio, while comparing it with the risk of
individual companies:................................................................................................................3
c) Comparing the standard deviation of returns of the ASX200 index with that of individual
shares and the equally weighted portfolio:.................................................................................3
Part 3:.........................................................................................................................................4
a) Estimating the beta for each company:..................................................................................4
b) Briefly explaining why each company has high/low of beta:................................................4
Part 4:.........................................................................................................................................4
a) Providing a short report for the client of Tri-Star Management:...........................................4
b) Providing relevant recommendations for Client of Tri-Star Management to invest of these
five companies:..........................................................................................................................6
References:.................................................................................................................................7
Appendices:................................................................................................................................8
BUSINESS FINANCE
Part 1:
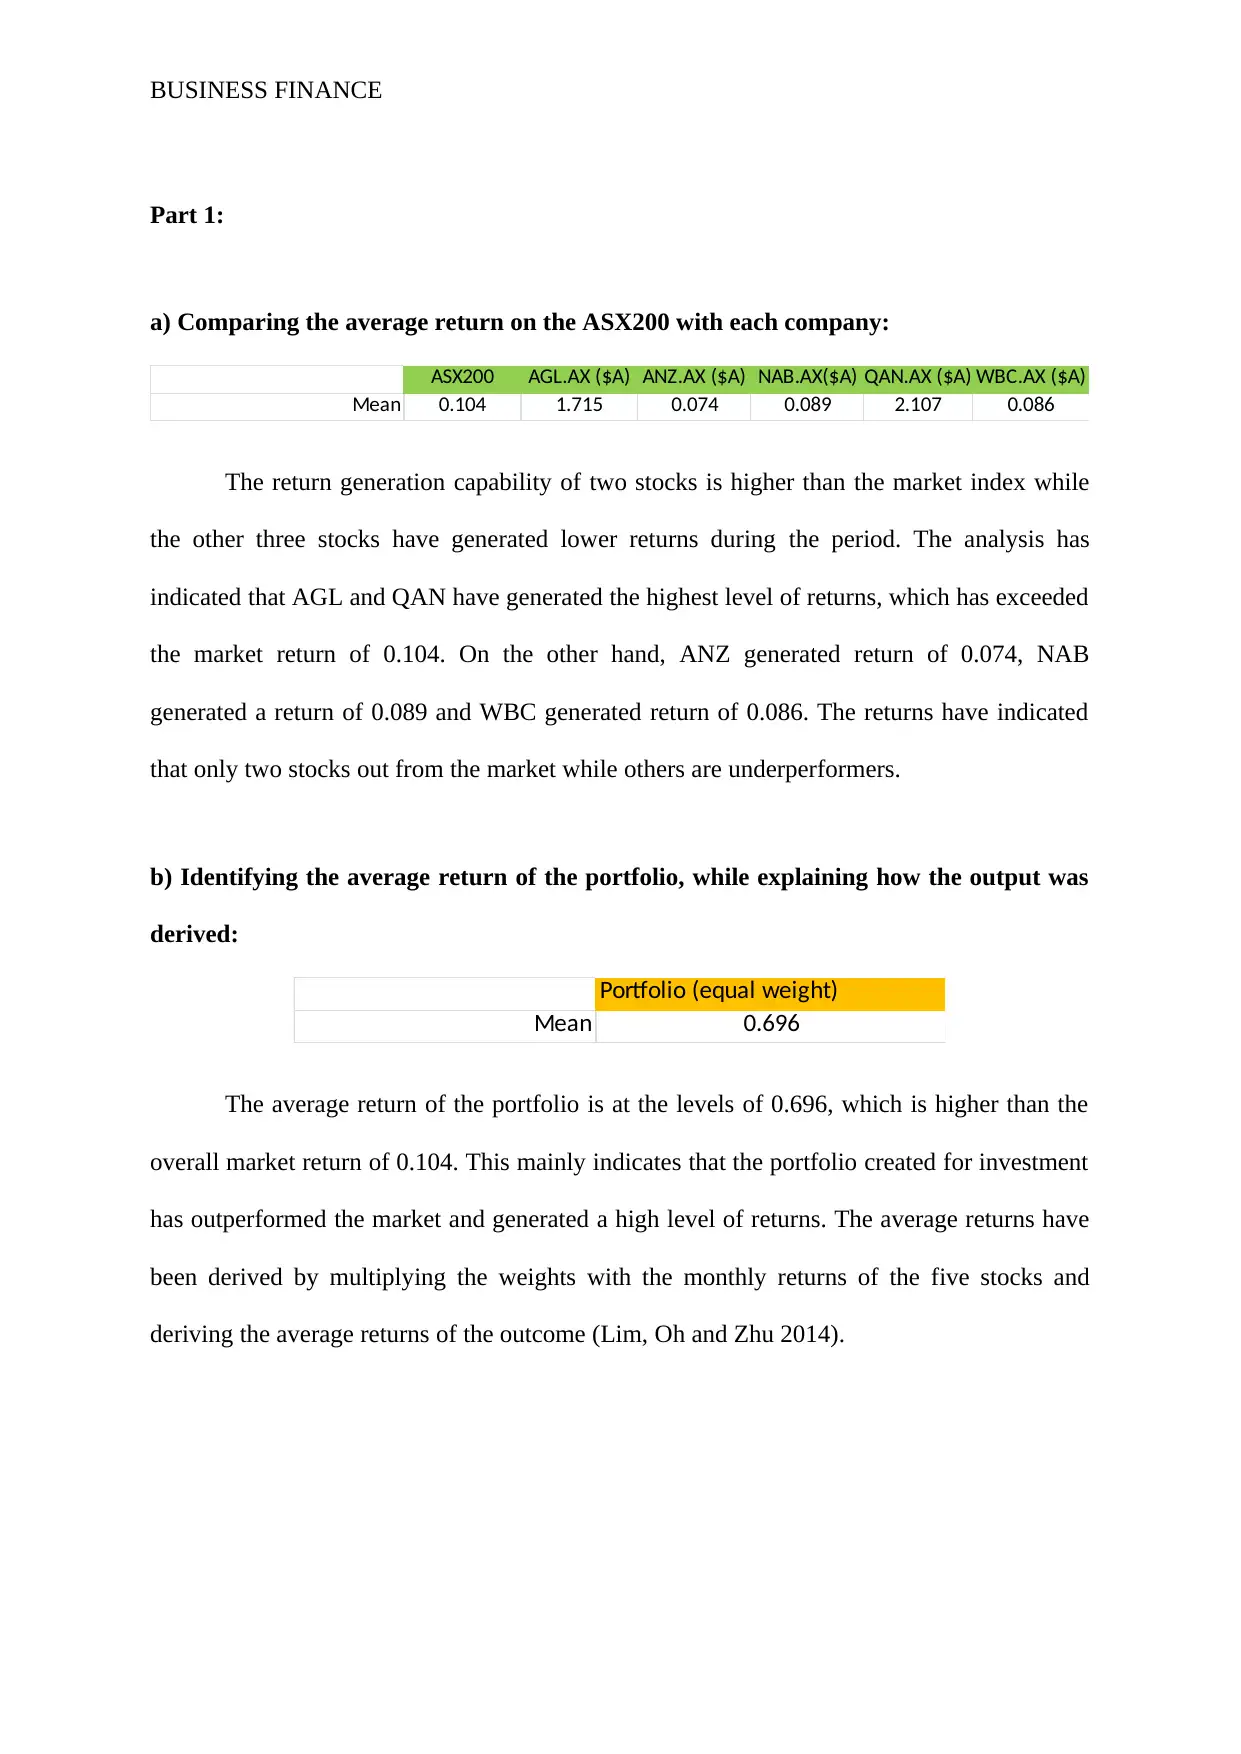
a) Comparing the average return on the ASX200 with each company:
ASX200 AGL.AX ($A) ANZ.AX ($A) NAB.AX($A) QAN.AX ($A) WBC.AX ($A)
Mean 0.104 1.715 0.074 0.089 2.107 0.086
The return generation capability of two stocks is higher than the market index while
the other three stocks have generated lower returns during the period. The analysis has
indicated that AGL and QAN have generated the highest level of returns, which has exceeded
the market return of 0.104. On the other hand, ANZ generated return of 0.074, NAB
generated a return of 0.089 and WBC generated return of 0.086. The returns have indicated
that only two stocks out from the market while others are underperformers.
b) Identifying the average return of the portfolio, while explaining how the output was
derived:
Portfolio (equal weight)
Mean 0.696
The average return of the portfolio is at the levels of 0.696, which is higher than the
overall market return of 0.104. This mainly indicates that the portfolio created for investment
has outperformed the market and generated a high level of returns. The average returns have
been derived by multiplying the weights with the monthly returns of the five stocks and
deriving the average returns of the outcome (Lim, Oh and Zhu 2014).
Part 1:
a) Comparing the average return on the ASX200 with each company:
ASX200 AGL.AX ($A) ANZ.AX ($A) NAB.AX($A) QAN.AX ($A) WBC.AX ($A)
Mean 0.104 1.715 0.074 0.089 2.107 0.086
The return generation capability of two stocks is higher than the market index while
the other three stocks have generated lower returns during the period. The analysis has
indicated that AGL and QAN have generated the highest level of returns, which has exceeded
the market return of 0.104. On the other hand, ANZ generated return of 0.074, NAB
generated a return of 0.089 and WBC generated return of 0.086. The returns have indicated
that only two stocks out from the market while others are underperformers.
b) Identifying the average return of the portfolio, while explaining how the output was
derived:
Portfolio (equal weight)
Mean 0.696
The average return of the portfolio is at the levels of 0.696, which is higher than the
overall market return of 0.104. This mainly indicates that the portfolio created for investment
has outperformed the market and generated a high level of returns. The average returns have
been derived by multiplying the weights with the monthly returns of the five stocks and
deriving the average returns of the outcome (Lim, Oh and Zhu 2014).
⊘ This is a preview!⊘
Do you want full access?
Subscribe today to unlock all pages.
Trusted by 1+ million students worldwide
BUSINESS FINANCE
Part 2:
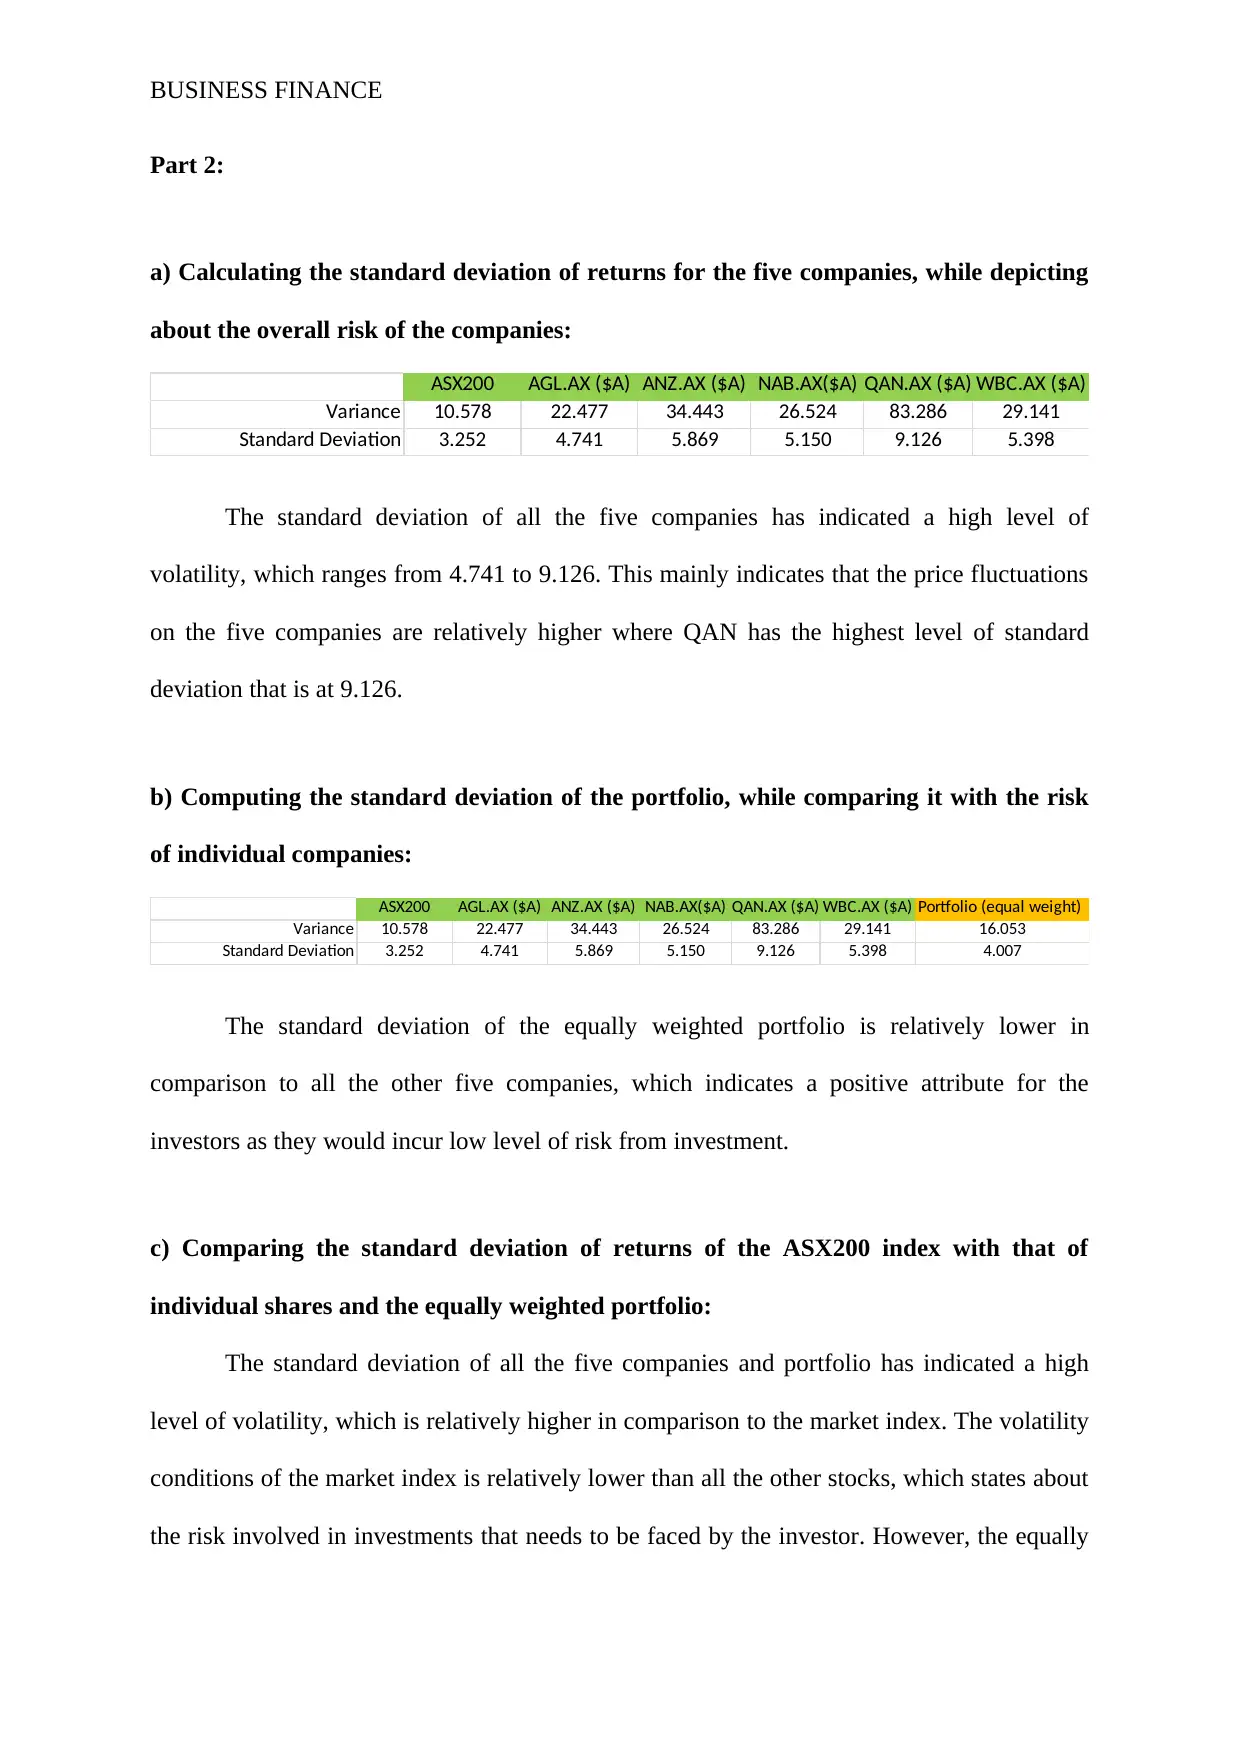
a) Calculating the standard deviation of returns for the five companies, while depicting
about the overall risk of the companies:
ASX200 AGL.AX ($A) ANZ.AX ($A) NAB.AX($A) QAN.AX ($A) WBC.AX ($A)
Variance 10.578 22.477 34.443 26.524 83.286 29.141
Standard Deviation 3.252 4.741 5.869 5.150 9.126 5.398
The standard deviation of all the five companies has indicated a high level of
volatility, which ranges from 4.741 to 9.126. This mainly indicates that the price fluctuations
on the five companies are relatively higher where QAN has the highest level of standard
deviation that is at 9.126.
b) Computing the standard deviation of the portfolio, while comparing it with the risk
of individual companies:
ASX200 AGL.AX ($A) ANZ.AX ($A) NAB.AX($A) QAN.AX ($A) WBC.AX ($A) Portfolio (equal weight)
Variance 10.578 22.477 34.443 26.524 83.286 29.141 16.053
Standard Deviation 3.252 4.741 5.869 5.150 9.126 5.398 4.007
The standard deviation of the equally weighted portfolio is relatively lower in
comparison to all the other five companies, which indicates a positive attribute for the
investors as they would incur low level of risk from investment.
c) Comparing the standard deviation of returns of the ASX200 index with that of
individual shares and the equally weighted portfolio:
The standard deviation of all the five companies and portfolio has indicated a high
level of volatility, which is relatively higher in comparison to the market index. The volatility
conditions of the market index is relatively lower than all the other stocks, which states about
the risk involved in investments that needs to be faced by the investor. However, the equally
Part 2:
a) Calculating the standard deviation of returns for the five companies, while depicting
about the overall risk of the companies:
ASX200 AGL.AX ($A) ANZ.AX ($A) NAB.AX($A) QAN.AX ($A) WBC.AX ($A)
Variance 10.578 22.477 34.443 26.524 83.286 29.141
Standard Deviation 3.252 4.741 5.869 5.150 9.126 5.398
The standard deviation of all the five companies has indicated a high level of
volatility, which ranges from 4.741 to 9.126. This mainly indicates that the price fluctuations
on the five companies are relatively higher where QAN has the highest level of standard
deviation that is at 9.126.
b) Computing the standard deviation of the portfolio, while comparing it with the risk
of individual companies:
ASX200 AGL.AX ($A) ANZ.AX ($A) NAB.AX($A) QAN.AX ($A) WBC.AX ($A) Portfolio (equal weight)
Variance 10.578 22.477 34.443 26.524 83.286 29.141 16.053
Standard Deviation 3.252 4.741 5.869 5.150 9.126 5.398 4.007
The standard deviation of the equally weighted portfolio is relatively lower in
comparison to all the other five companies, which indicates a positive attribute for the
investors as they would incur low level of risk from investment.
c) Comparing the standard deviation of returns of the ASX200 index with that of
individual shares and the equally weighted portfolio:
The standard deviation of all the five companies and portfolio has indicated a high
level of volatility, which is relatively higher in comparison to the market index. The volatility
conditions of the market index is relatively lower than all the other stocks, which states about
the risk involved in investments that needs to be faced by the investor. However, the equally
Paraphrase This Document
Need a fresh take? Get an instant paraphrase of this document with our AI Paraphraser
BUSINESS FINANCE
weighted portfolio has generated the lowest level of risk or standard deviation in comparison
to other stocks, as all the relevant fluctuations in the price is curbed due to the equal weights
of investment in the five stocks (McLean and Pontiff 2016).
Part 3:
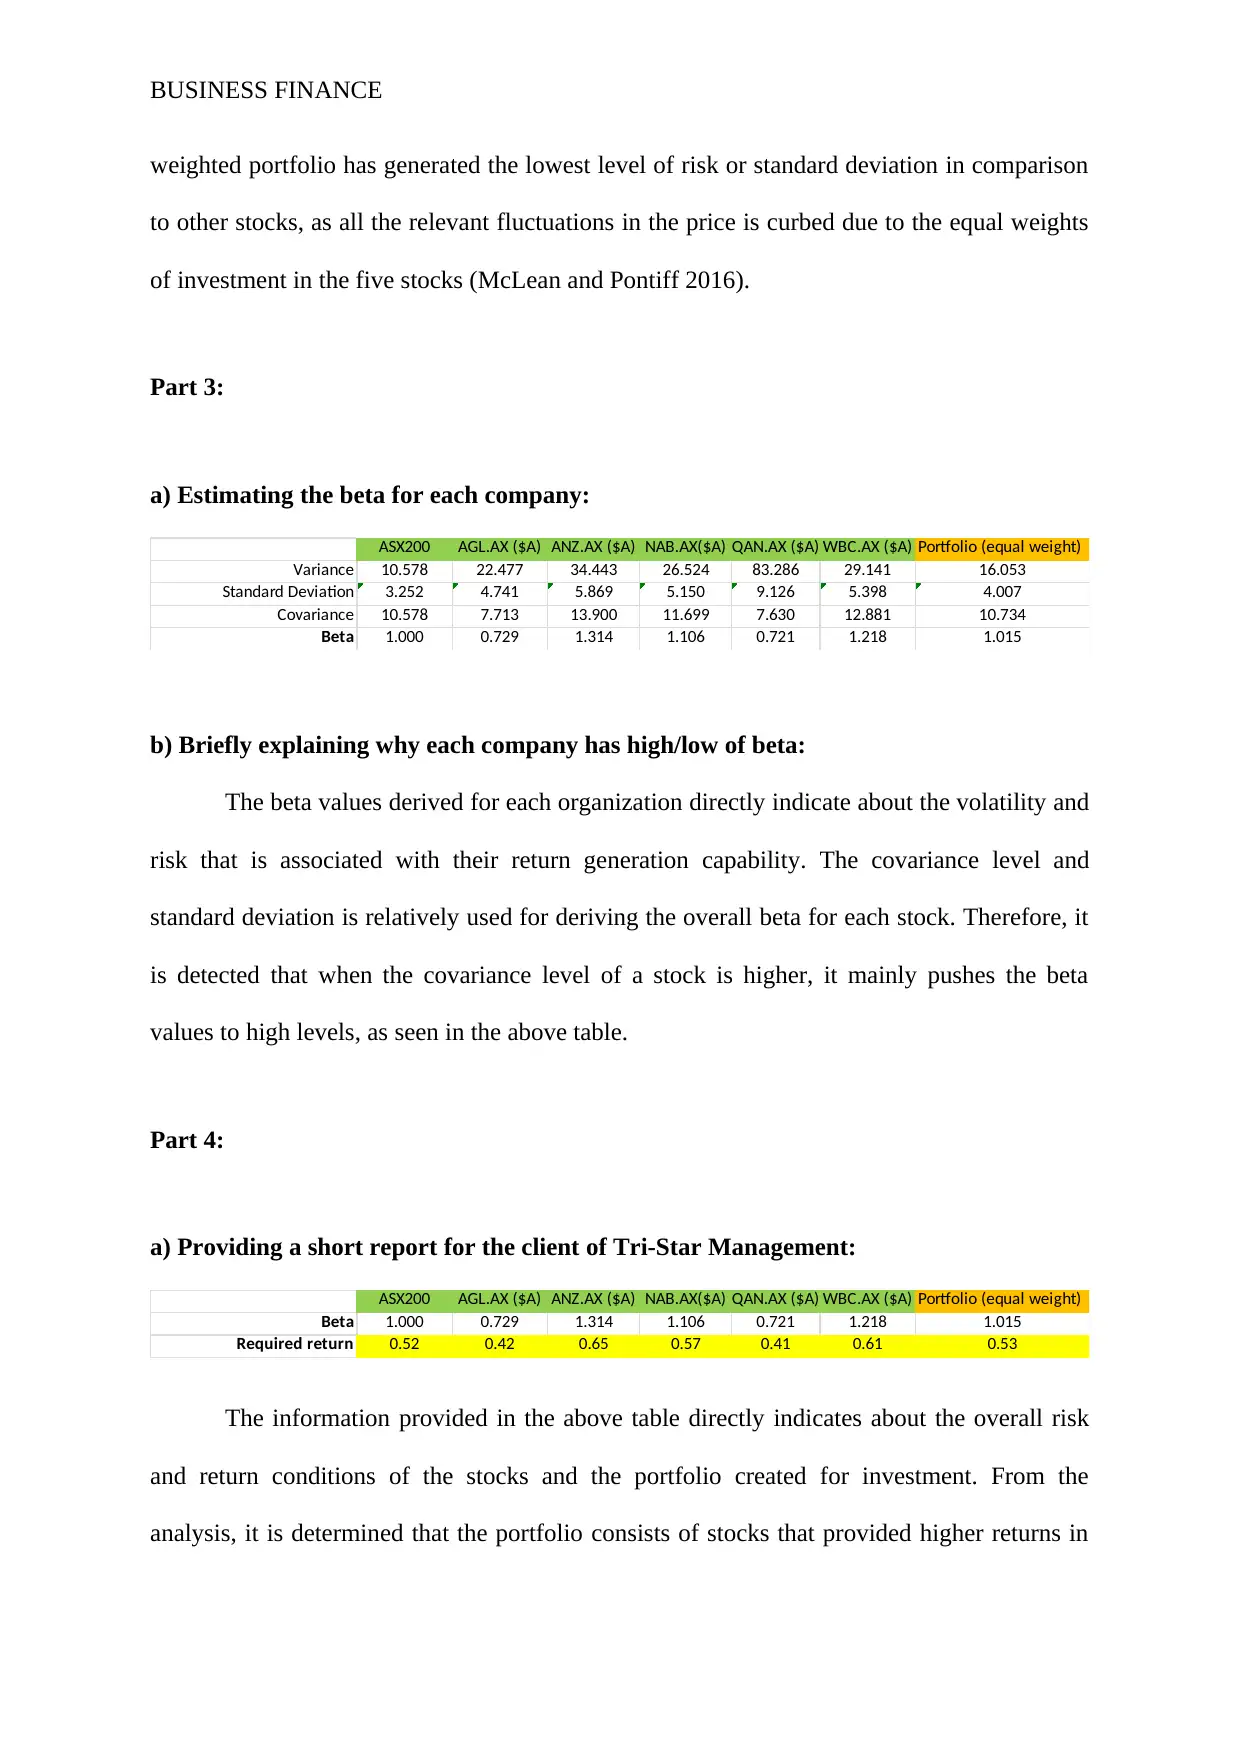
a) Estimating the beta for each company:
ASX200 AGL.AX ($A) ANZ.AX ($A) NAB.AX($A) QAN.AX ($A) WBC.AX ($A) Portfolio (equal weight)
Variance 10.578 22.477 34.443 26.524 83.286 29.141 16.053
Standard Deviation 3.252 4.741 5.869 5.150 9.126 5.398 4.007
Covariance 10.578 7.713 13.900 11.699 7.630 12.881 10.734
Beta 1.000 0.729 1.314 1.106 0.721 1.218 1.015
b) Briefly explaining why each company has high/low of beta:
The beta values derived for each organization directly indicate about the volatility and
risk that is associated with their return generation capability. The covariance level and
standard deviation is relatively used for deriving the overall beta for each stock. Therefore, it
is detected that when the covariance level of a stock is higher, it mainly pushes the beta
values to high levels, as seen in the above table.
Part 4:
a) Providing a short report for the client of Tri-Star Management:
ASX200 AGL.AX ($A) ANZ.AX ($A) NAB.AX($A) QAN.AX ($A) WBC.AX ($A) Portfolio (equal weight)
Beta 1.000 0.729 1.314 1.106 0.721 1.218 1.015
Required return 0.52 0.42 0.65 0.57 0.41 0.61 0.53
The information provided in the above table directly indicates about the overall risk
and return conditions of the stocks and the portfolio created for investment. From the
analysis, it is determined that the portfolio consists of stocks that provided higher returns in
weighted portfolio has generated the lowest level of risk or standard deviation in comparison
to other stocks, as all the relevant fluctuations in the price is curbed due to the equal weights
of investment in the five stocks (McLean and Pontiff 2016).
Part 3:
a) Estimating the beta for each company:
ASX200 AGL.AX ($A) ANZ.AX ($A) NAB.AX($A) QAN.AX ($A) WBC.AX ($A) Portfolio (equal weight)
Variance 10.578 22.477 34.443 26.524 83.286 29.141 16.053
Standard Deviation 3.252 4.741 5.869 5.150 9.126 5.398 4.007
Covariance 10.578 7.713 13.900 11.699 7.630 12.881 10.734
Beta 1.000 0.729 1.314 1.106 0.721 1.218 1.015
b) Briefly explaining why each company has high/low of beta:
The beta values derived for each organization directly indicate about the volatility and
risk that is associated with their return generation capability. The covariance level and
standard deviation is relatively used for deriving the overall beta for each stock. Therefore, it
is detected that when the covariance level of a stock is higher, it mainly pushes the beta
values to high levels, as seen in the above table.
Part 4:
a) Providing a short report for the client of Tri-Star Management:
ASX200 AGL.AX ($A) ANZ.AX ($A) NAB.AX($A) QAN.AX ($A) WBC.AX ($A) Portfolio (equal weight)
Beta 1.000 0.729 1.314 1.106 0.721 1.218 1.015
Required return 0.52 0.42 0.65 0.57 0.41 0.61 0.53
The information provided in the above table directly indicates about the overall risk
and return conditions of the stocks and the portfolio created for investment. From the
analysis, it is determined that the portfolio consists of stocks that provided higher returns in
BUSINESS FINANCE
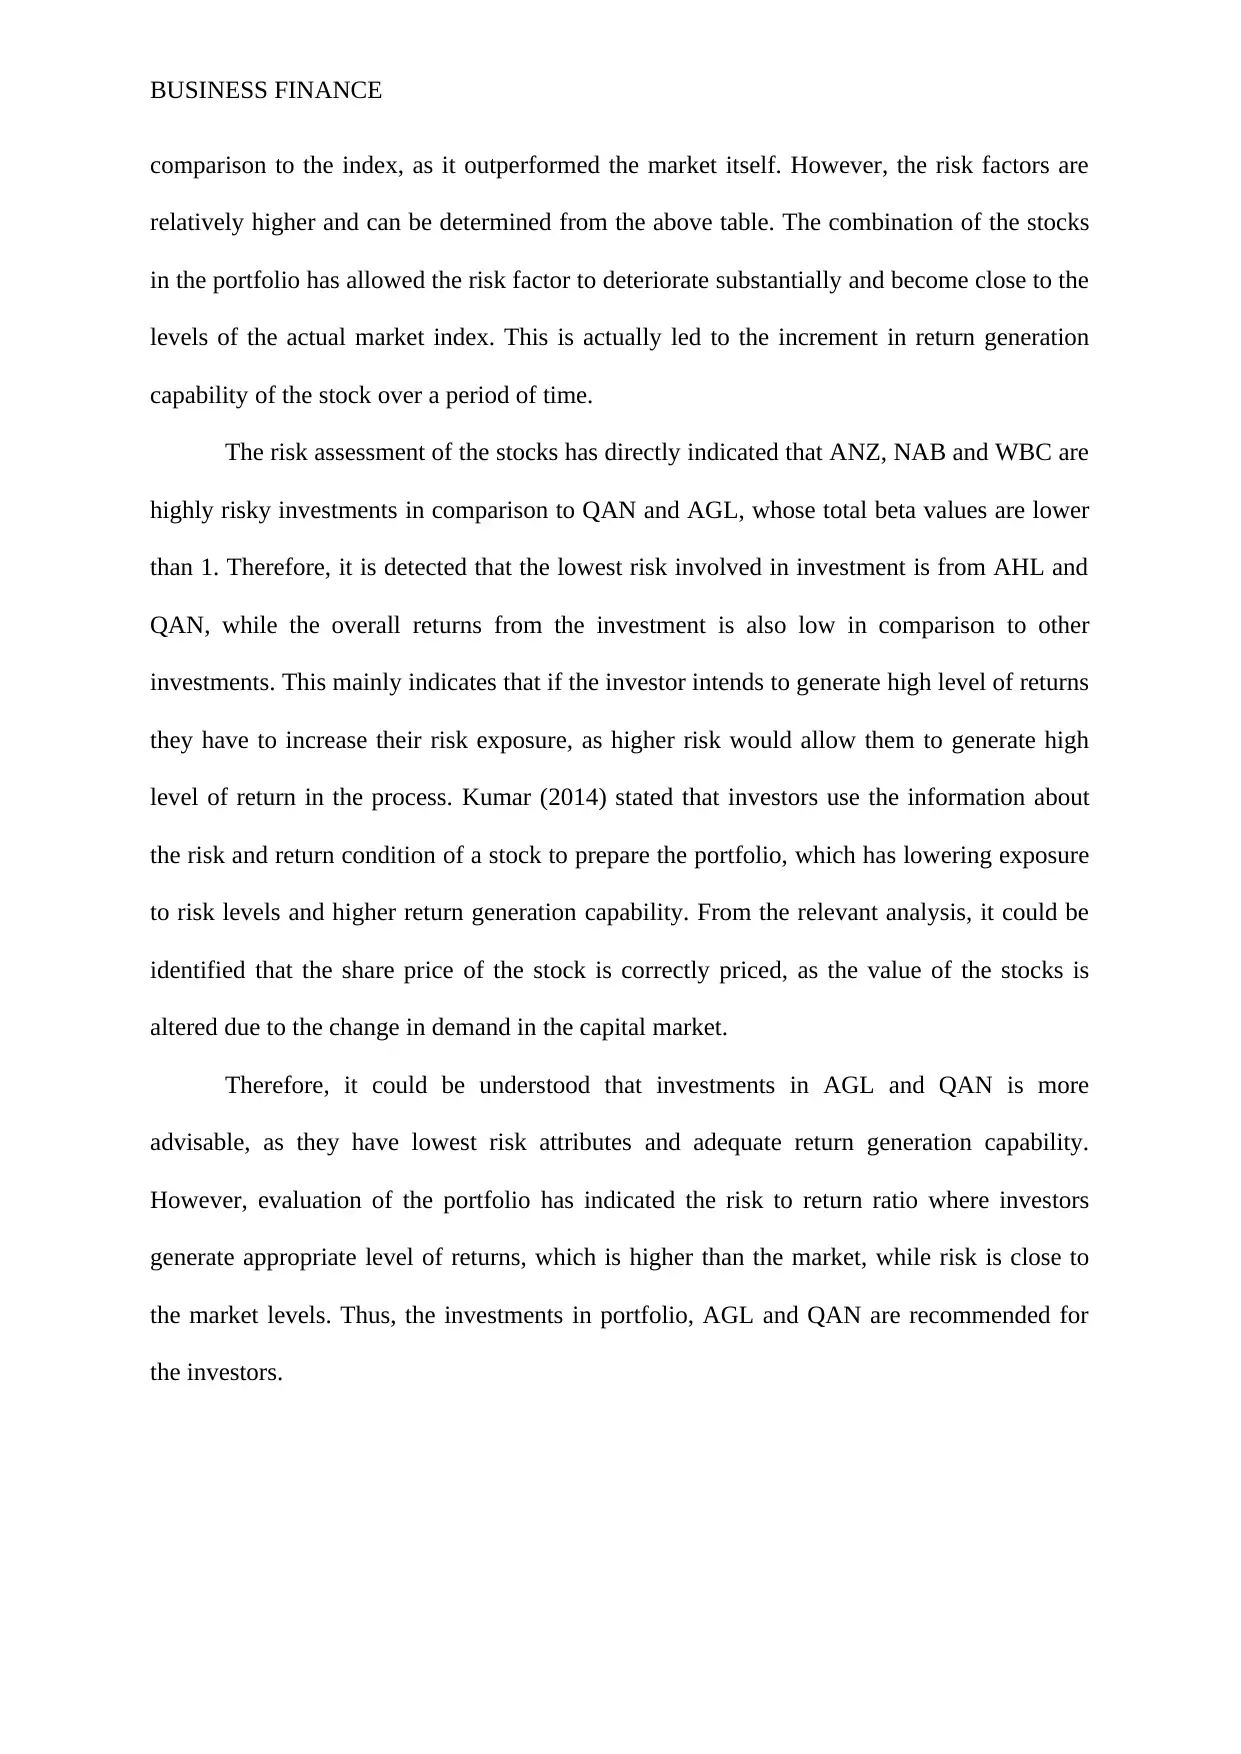
comparison to the index, as it outperformed the market itself. However, the risk factors are
relatively higher and can be determined from the above table. The combination of the stocks
in the portfolio has allowed the risk factor to deteriorate substantially and become close to the
levels of the actual market index. This is actually led to the increment in return generation
capability of the stock over a period of time.
The risk assessment of the stocks has directly indicated that ANZ, NAB and WBC are
highly risky investments in comparison to QAN and AGL, whose total beta values are lower
than 1. Therefore, it is detected that the lowest risk involved in investment is from AHL and
QAN, while the overall returns from the investment is also low in comparison to other
investments. This mainly indicates that if the investor intends to generate high level of returns
they have to increase their risk exposure, as higher risk would allow them to generate high
level of return in the process. Kumar (2014) stated that investors use the information about
the risk and return condition of a stock to prepare the portfolio, which has lowering exposure
to risk levels and higher return generation capability. From the relevant analysis, it could be
identified that the share price of the stock is correctly priced, as the value of the stocks is
altered due to the change in demand in the capital market.
Therefore, it could be understood that investments in AGL and QAN is more
advisable, as they have lowest risk attributes and adequate return generation capability.
However, evaluation of the portfolio has indicated the risk to return ratio where investors
generate appropriate level of returns, which is higher than the market, while risk is close to
the market levels. Thus, the investments in portfolio, AGL and QAN are recommended for
the investors.
⊘ This is a preview!⊘
Do you want full access?
Subscribe today to unlock all pages.
Trusted by 1+ million students worldwide
BUSINESS FINANCE
b) Providing relevant recommendations for Client of Tri-Star Management to invest of
these five companies:
The client would be recommended for investing in the equally weighted portfolio, as
it would allow them to reduce the level of risk involved in investment and generate adequate
returns, which is higher than the overall market index. The portfolio directly reduces the level
of risk involved in investment and allows the investor to generate high level of returns, which
cannot be conducted in a single investment. However, changes to the portfolio weights can
also increase the level of returns and reduce the risk involved in investment for Tri-Star
management.
Paraphrase This Document
Need a fresh take? Get an instant paraphrase of this document with our AI Paraphraser
BUSINESS FINANCE
References:
Kumar, D., 2014. Return and volatility transmission between gold and stock sectors:
Application of portfolio management and hedging effectiveness. IIMB Management
Review, 26(1), pp.5-16.
Lim, S., Oh, K.W. and Zhu, J., 2014. Use of DEA cross-efficiency evaluation in portfolio
selection: An application to Korean stock market. European Journal of Operational
Research, 236(1), pp.361-368.
McLean, R.D. and Pontiff, J., 2016. Does academic research destroy stock return
predictability?. The Journal of Finance, 71(1), pp.5-32.
BUSINESS FINANCE
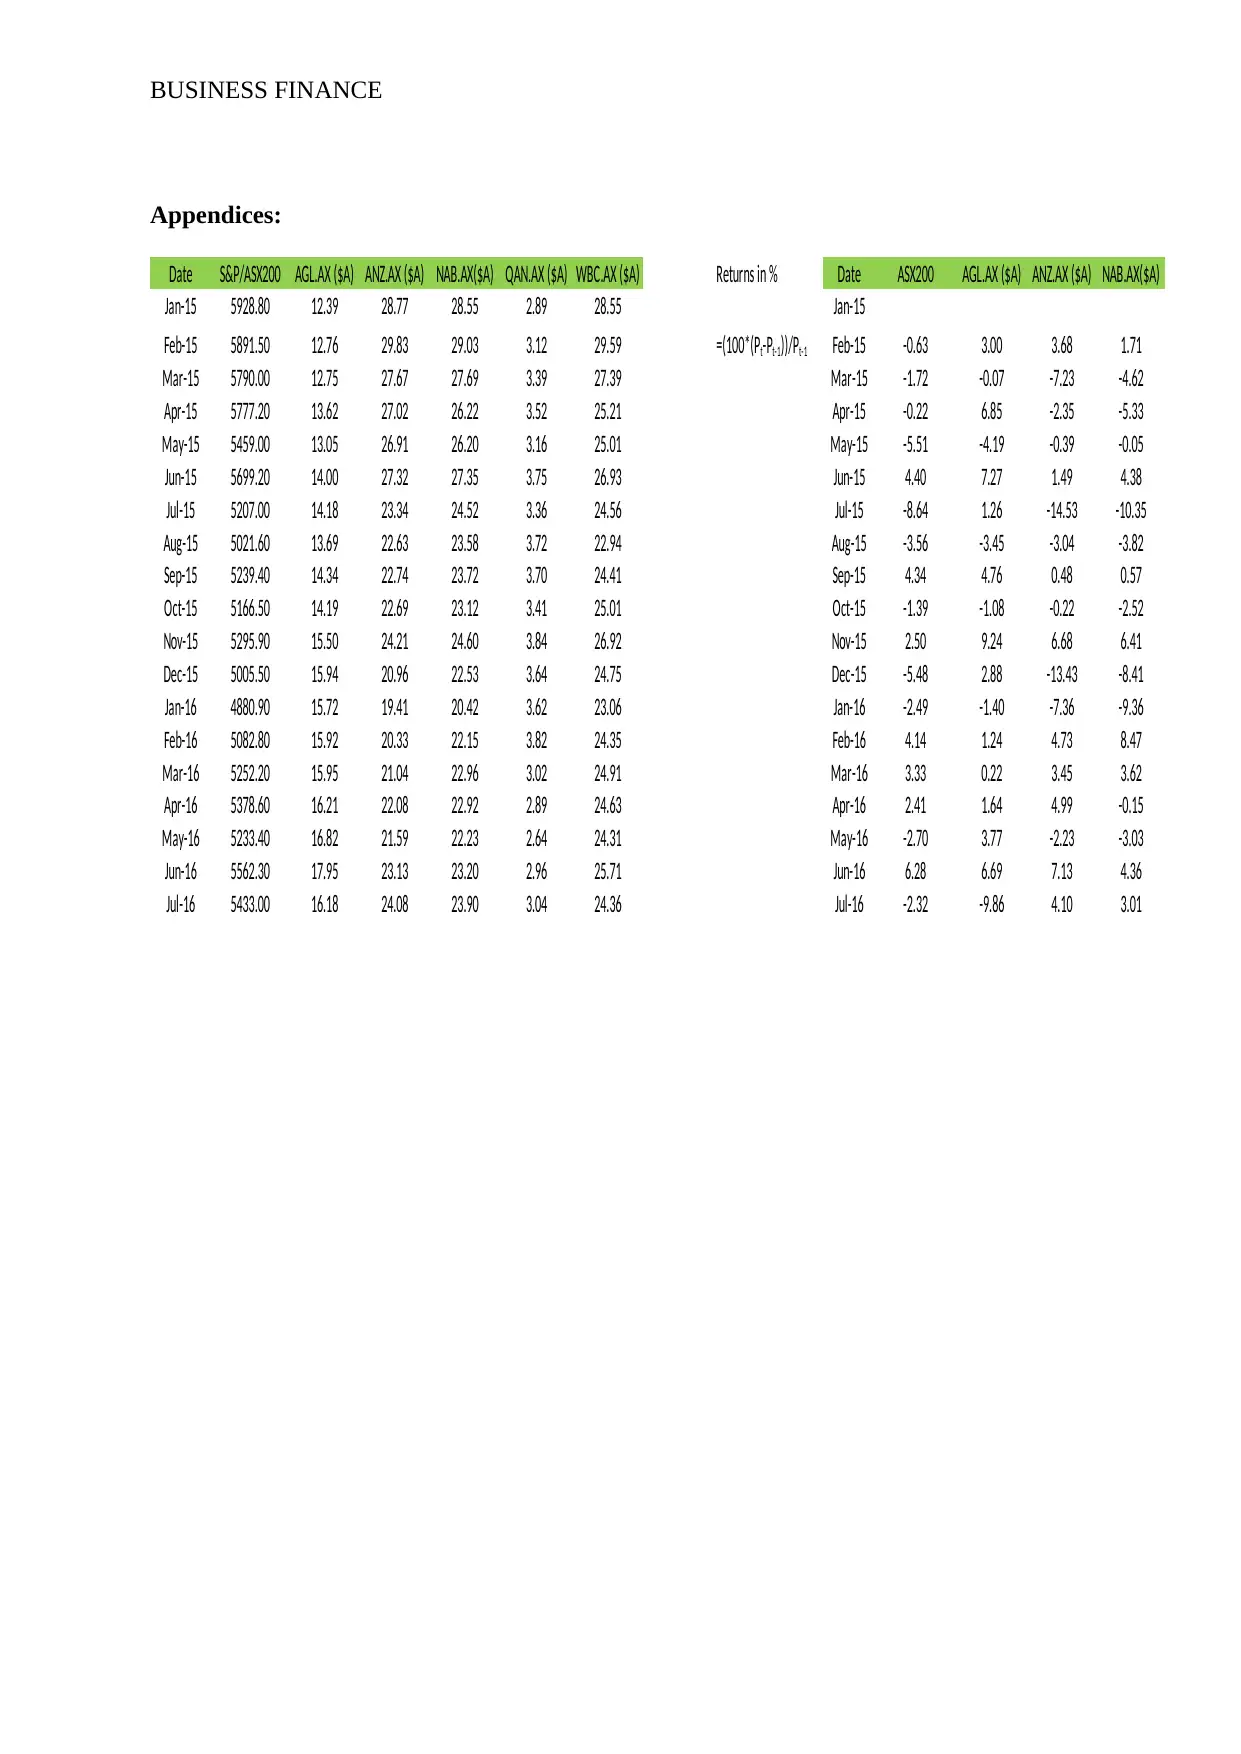
Appendices:
Date S&P/ASX200 AGL.AX ($A) ANZ.AX ($A) NAB.AX($A) QAN.AX ($A) WBC.AX ($A) Returns in % Date ASX200 AGL.AX ($A) ANZ.AX ($A) NAB.AX($A)
Jan-15 5928.80 12.39 28.77 28.55 2.89 28.55 Jan-15
Feb-15 5891.50 12.76 29.83 29.03 3.12 29.59 Feb-15 -0.63 3.00 3.68 1.71
Mar-15 5790.00 12.75 27.67 27.69 3.39 27.39 Mar-15 -1.72 -0.07 -7.23 -4.62
Apr-15 5777.20 13.62 27.02 26.22 3.52 25.21 Apr-15 -0.22 6.85 -2.35 -5.33
May-15 5459.00 13.05 26.91 26.20 3.16 25.01 May-15 -5.51 -4.19 -0.39 -0.05
Jun-15 5699.20 14.00 27.32 27.35 3.75 26.93 Jun-15 4.40 7.27 1.49 4.38
Jul-15 5207.00 14.18 23.34 24.52 3.36 24.56 Jul-15 -8.64 1.26 -14.53 -10.35
Aug-15 5021.60 13.69 22.63 23.58 3.72 22.94 Aug-15 -3.56 -3.45 -3.04 -3.82
Sep-15 5239.40 14.34 22.74 23.72 3.70 24.41 Sep-15 4.34 4.76 0.48 0.57
Oct-15 5166.50 14.19 22.69 23.12 3.41 25.01 Oct-15 -1.39 -1.08 -0.22 -2.52
Nov-15 5295.90 15.50 24.21 24.60 3.84 26.92 Nov-15 2.50 9.24 6.68 6.41
Dec-15 5005.50 15.94 20.96 22.53 3.64 24.75 Dec-15 -5.48 2.88 -13.43 -8.41
Jan-16 4880.90 15.72 19.41 20.42 3.62 23.06 Jan-16 -2.49 -1.40 -7.36 -9.36
Feb-16 5082.80 15.92 20.33 22.15 3.82 24.35 Feb-16 4.14 1.24 4.73 8.47
Mar-16 5252.20 15.95 21.04 22.96 3.02 24.91 Mar-16 3.33 0.22 3.45 3.62
Apr-16 5378.60 16.21 22.08 22.92 2.89 24.63 Apr-16 2.41 1.64 4.99 -0.15
May-16 5233.40 16.82 21.59 22.23 2.64 24.31 May-16 -2.70 3.77 -2.23 -3.03
Jun-16 5562.30 17.95 23.13 23.20 2.96 25.71 Jun-16 6.28 6.69 7.13 4.36
Jul-16 5433.00 16.18 24.08 23.90 3.04 24.36 Jul-16 -2.32 -9.86 4.10 3.01
=(100*(Pt-Pt-1))/Pt-1
⊘ This is a preview!⊘
Do you want full access?
Subscribe today to unlock all pages.
Trusted by 1+ million students worldwide
1 out of 9
Related Documents


Your All-in-One AI-Powered Toolkit for Academic Success.
+13062052269
info@desklib.com
Available 24*7 on WhatsApp / Email
![[object Object]](/_next/static/media/star-bottom.7253800d.svg)
Unlock your academic potential
Copyright © 2020–2026 A2Z Services. All Rights Reserved. Developed and managed by ZUCOL.