Finance: Portfolio Management, Investor Utility, Curves, Allocation

Verified

Added on  2023/06/15

|8
|939
|152
Practical Assignment
AI Summary
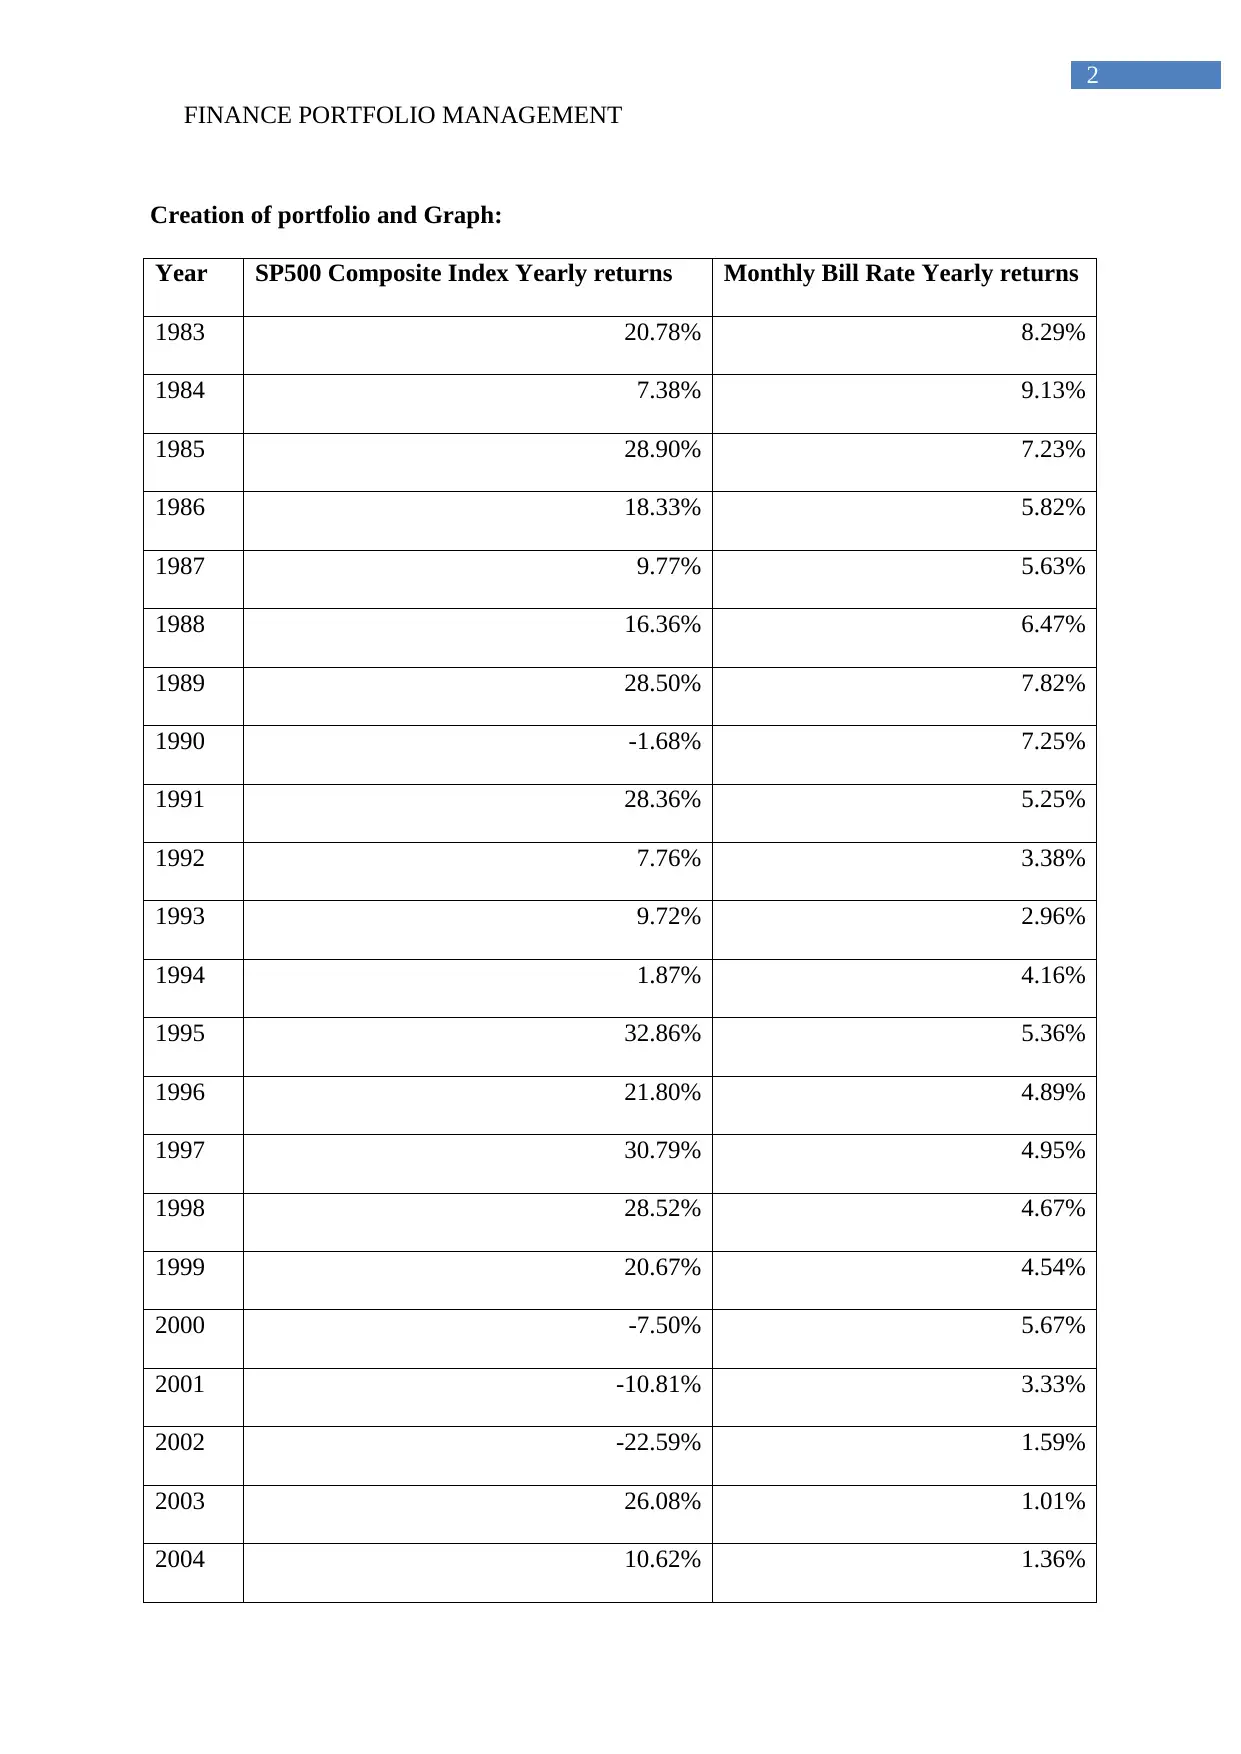
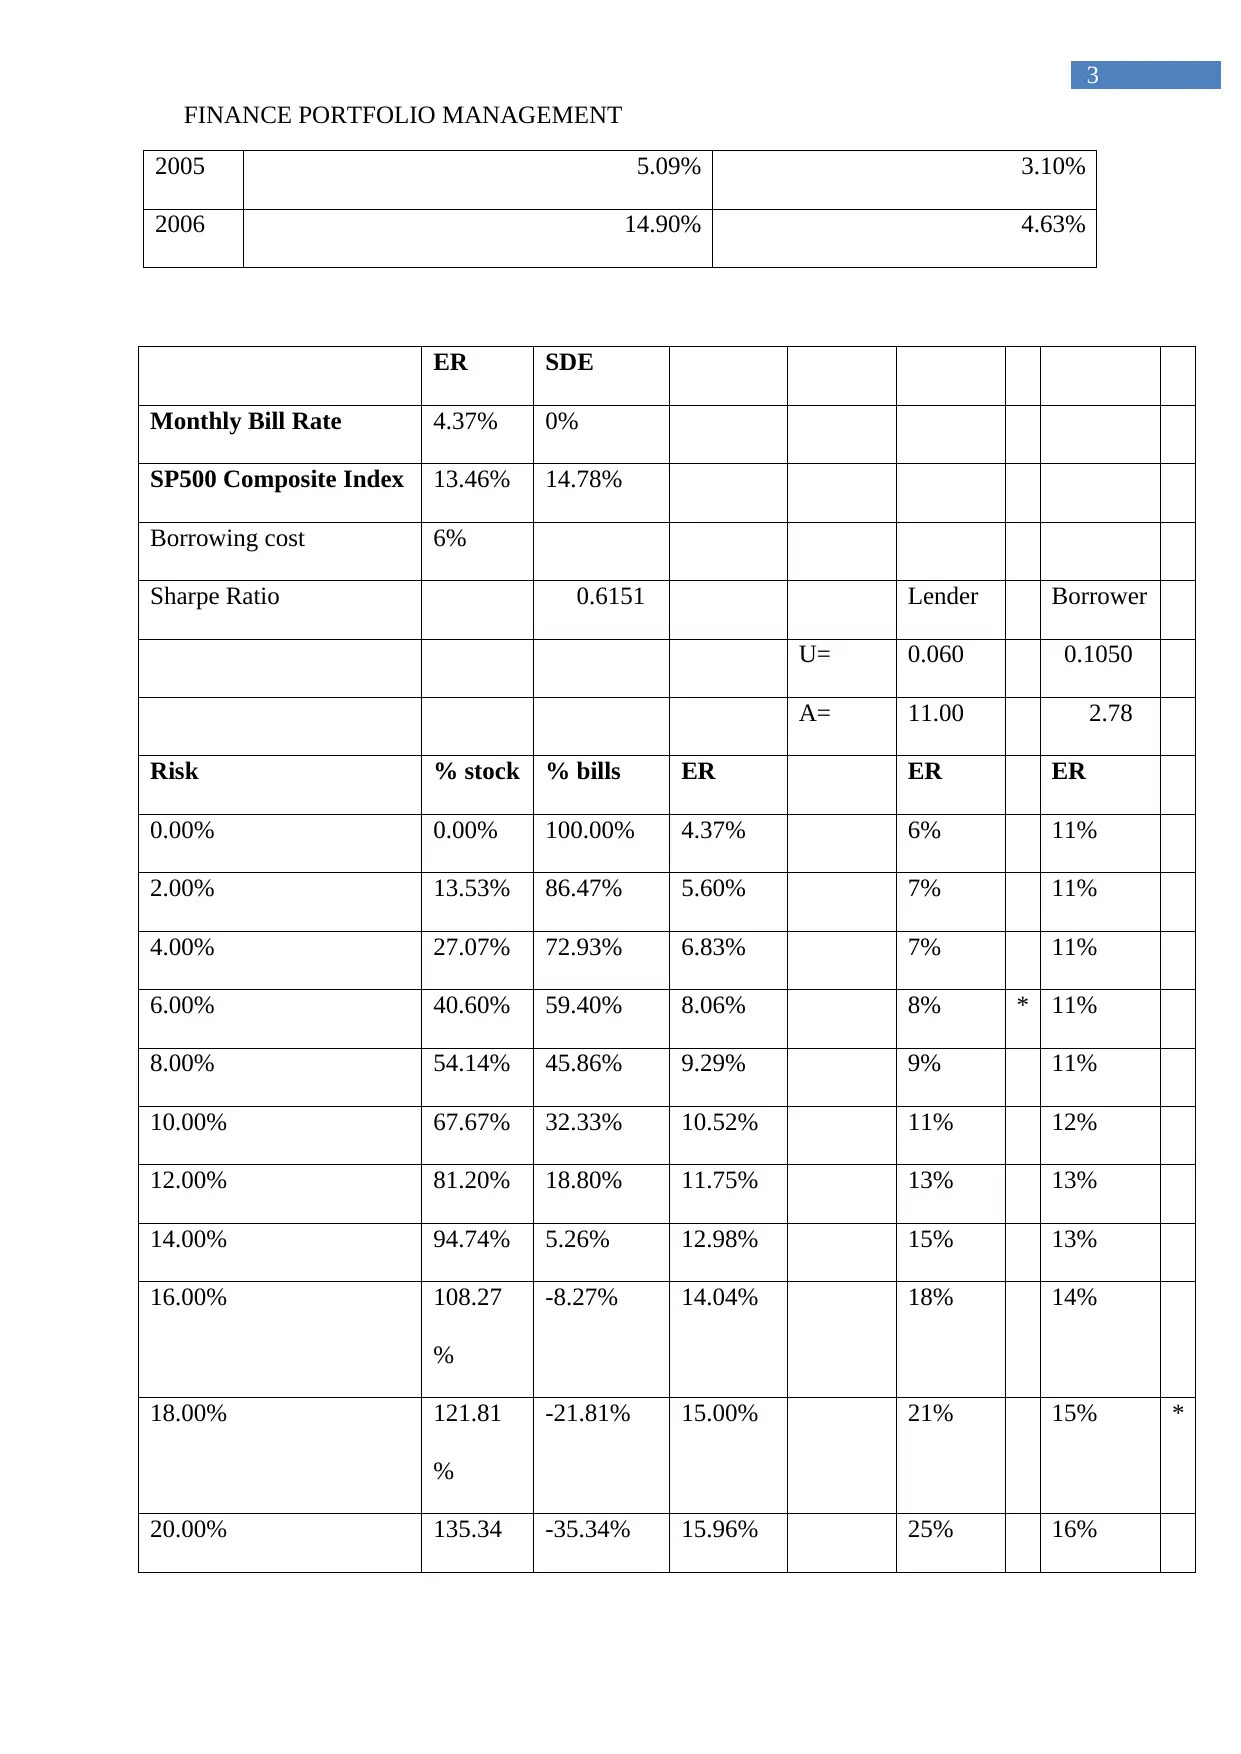
This assignment focuses on creating a portfolio management spreadsheet to plot utility curves and estimate the optimal combination of risky and risk-free assets based on an investor's risk aversion. The model uses historical data from the S&P 500 Index and T-Bills to calculate annual geometric mean returns and standard deviations. The spreadsheet includes calculations for borrowing costs, Sharpe ratios, and expected returns for both lenders and borrowers under varying risk percentages. It analyzes how changes in utility values (U) and risk aversion (A) impact investment returns, demonstrating the trade-offs between risk and return in asset allocation. The assignment also discusses the significance of the Sharpe ratio in evaluating portfolio performance relative to risk-free returns.
Document Page
Running head: FINANCE PORTFOLIO MANAGEMENT
Finance Portfolio Management
Name of the Student:
Name of the University:
Authors Note:
tabler-icon-diamond-filled.svg

Secure Best Marks with AI Grader

Need help grading? Try our AI Grader for instant feedback on your assignments.
Document Page
FINANCE PORTFOLIO MANAGEMENT
1
Table of Contents
Creation of portfolio and Graph:................................................................................................2
4.1 Depicting the values of U results in a tangent for the lender and borrower:.......................4
4.2 Depicting what happens if values of A are changed:...........................................................5
4.3 Depicting the change in U for borrower if borrowing rate is changed:...............................5
4.4 Depicting whether Sharpe ratio is computed to lender or borrower:...................................5
Reference:..................................................................................................................................6
Document Page
FINANCE PORTFOLIO MANAGEMENT
2
Creation of portfolio and Graph:
Year SP500 Composite Index Yearly returns Monthly Bill Rate Yearly returns
1983 20.78% 8.29%
1984 7.38% 9.13%
1985 28.90% 7.23%
1986 18.33% 5.82%
1987 9.77% 5.63%
1988 16.36% 6.47%
1989 28.50% 7.82%
1990 -1.68% 7.25%
1991 28.36% 5.25%
1992 7.76% 3.38%
1993 9.72% 2.96%
1994 1.87% 4.16%
1995 32.86% 5.36%
1996 21.80% 4.89%
1997 30.79% 4.95%
1998 28.52% 4.67%
1999 20.67% 4.54%
2000 -7.50% 5.67%
2001 -10.81% 3.33%
2002 -22.59% 1.59%
2003 26.08% 1.01%
2004 10.62% 1.36%
Document Page
FINANCE PORTFOLIO MANAGEMENT
3
2005 5.09% 3.10%
2006 14.90% 4.63%
ER SDE
Monthly Bill Rate 4.37% 0%
SP500 Composite Index 13.46% 14.78%
Borrowing cost 6%
Sharpe Ratio 0.6151 Lender Borrower
U= 0.060 0.1050
A= 11.00 2.78
Risk % stock % bills ER ER ER
0.00% 0.00% 100.00% 4.37% 6% 11%
2.00% 13.53% 86.47% 5.60% 7% 11%
4.00% 27.07% 72.93% 6.83% 7% 11%
6.00% 40.60% 59.40% 8.06% 8% * 11%
8.00% 54.14% 45.86% 9.29% 9% 11%
10.00% 67.67% 32.33% 10.52% 11% 12%
12.00% 81.20% 18.80% 11.75% 13% 13%
14.00% 94.74% 5.26% 12.98% 15% 13%
16.00% 108.27
%
-8.27% 14.04% 18% 14%
18.00% 121.81
%
-21.81% 15.00% 21% 15% *
20.00% 135.34 -35.34% 15.96% 25% 16%
tabler-icon-diamond-filled.svg

Secure Best Marks with AI Grader

Need help grading? Try our AI Grader for instant feedback on your assignments.
Document Page
FINANCE PORTFOLIO MANAGEMENT
4
%
22.00% 148.87
%
-48.87% 16.92% 29% 17%
24.00% 162.41
%
-62.41% 17.88% 33% 19%
26.00% 175.94
%
-75.94% 18.84% 37% 20%
28.00% 189.47
%
-89.47% 19.80% 42% 21%
30.00% 203.01
%
-103.01% 20.76% 48% 23%
32.00% 216.54
%
-116.54% 21.72% 53% 25%
34.00% 230.08
%
-130.08% 22.68% 60% 27%
36.00% 243.61
%
-143.61% 23.64% 66% 29%
38.00% 257.14
%
-157.14% 24.60% 73% 31%
40.00% 270.68
%
-170.68% 25.56% 80% 33%
42.00% 284.21
%
-184.21% 26.52% 88% 35%
Document Page
FINANCE PORTFOLIO MANAGEMENT
5
0.00% 5.00% 10.00%15.00%20.00%25.00%30.00%35.00%40.00%45.00%
0.00%
20.00%
40.00%
60.00%
80.00%
100.00%
120.00%
4.1 Depicting the values of U results in a tangent for the lender and borrower:
The values for U is relatively different for lender and borrower, as it directly increases
return of both lender and borrower. In addition, the changes in U values is due to the extra
expenses, which is incurred from operations. The U value of ER is low, as the borrower
needs to pay for borrowing cost (Leung, Banks and Saary-Littman 2016).
4.2 Depicting what happens if values of A are changed:
The changes in value of A directly changes the overall returns that is provided by the
lender and borrower. In addition, the assumption of A is mainly helpful in identifying the
financial improvement, which could be generated from investment.
4.3 Depicting the change in U for borrower if borrowing rate is changed:
The changes in borrowing cost could eventually alter the overall return that will be
provided from borrower. This could eventually help in improving the return from investment,
if borrowing rate is changed.
Document Page
FINANCE PORTFOLIO MANAGEMENT
6
4.4 Depicting whether Sharpe ratio is computed to lender or borrower:
The Sharpe ratio is mainly computed for both lender and borrower, which helps in
identifying the actual return that could be provided from investment. In addition, the Sharpe
ratio is calculated for identifying the return, which is higher than risk free returns. The
performance of the portfolio is associated with risk taking activities are mainly inaccessible
(Titman, Keown and Martin 2017).
tabler-icon-diamond-filled.svg

Paraphrase This Document

Need a fresh take? Get an instant paraphrase of this document with our AI Paraphraser
Document Page
FINANCE PORTFOLIO MANAGEMENT
7
Reference:
Leung, S.L., Banks, M. and Saary-Littman, J., 2016. International Association of Credit
Portfolio Managers Principles and Practices: 2015: Expanding Role of Credit Portfolio
Management. Global Credit Review, 6, pp.11-20.
Titman, S., Keown, A.J. and Martin, J.D., 2017. Financial management: Principles and
applications. Pearson.
chevron_up_icon
1 out of 8
circle_padding
hide_on_mobile
zoom_out_icon
logo.png

Your All-in-One AI-Powered Toolkit for Academic Success.

Available 24*7 on WhatsApp / Email

[object Object]