Comprehensive Finance Assignment: Portfolio and Cash Flow Analysis
VerifiedAdded on 2022/10/12
|6
|862
|121
Homework Assignment
AI Summary
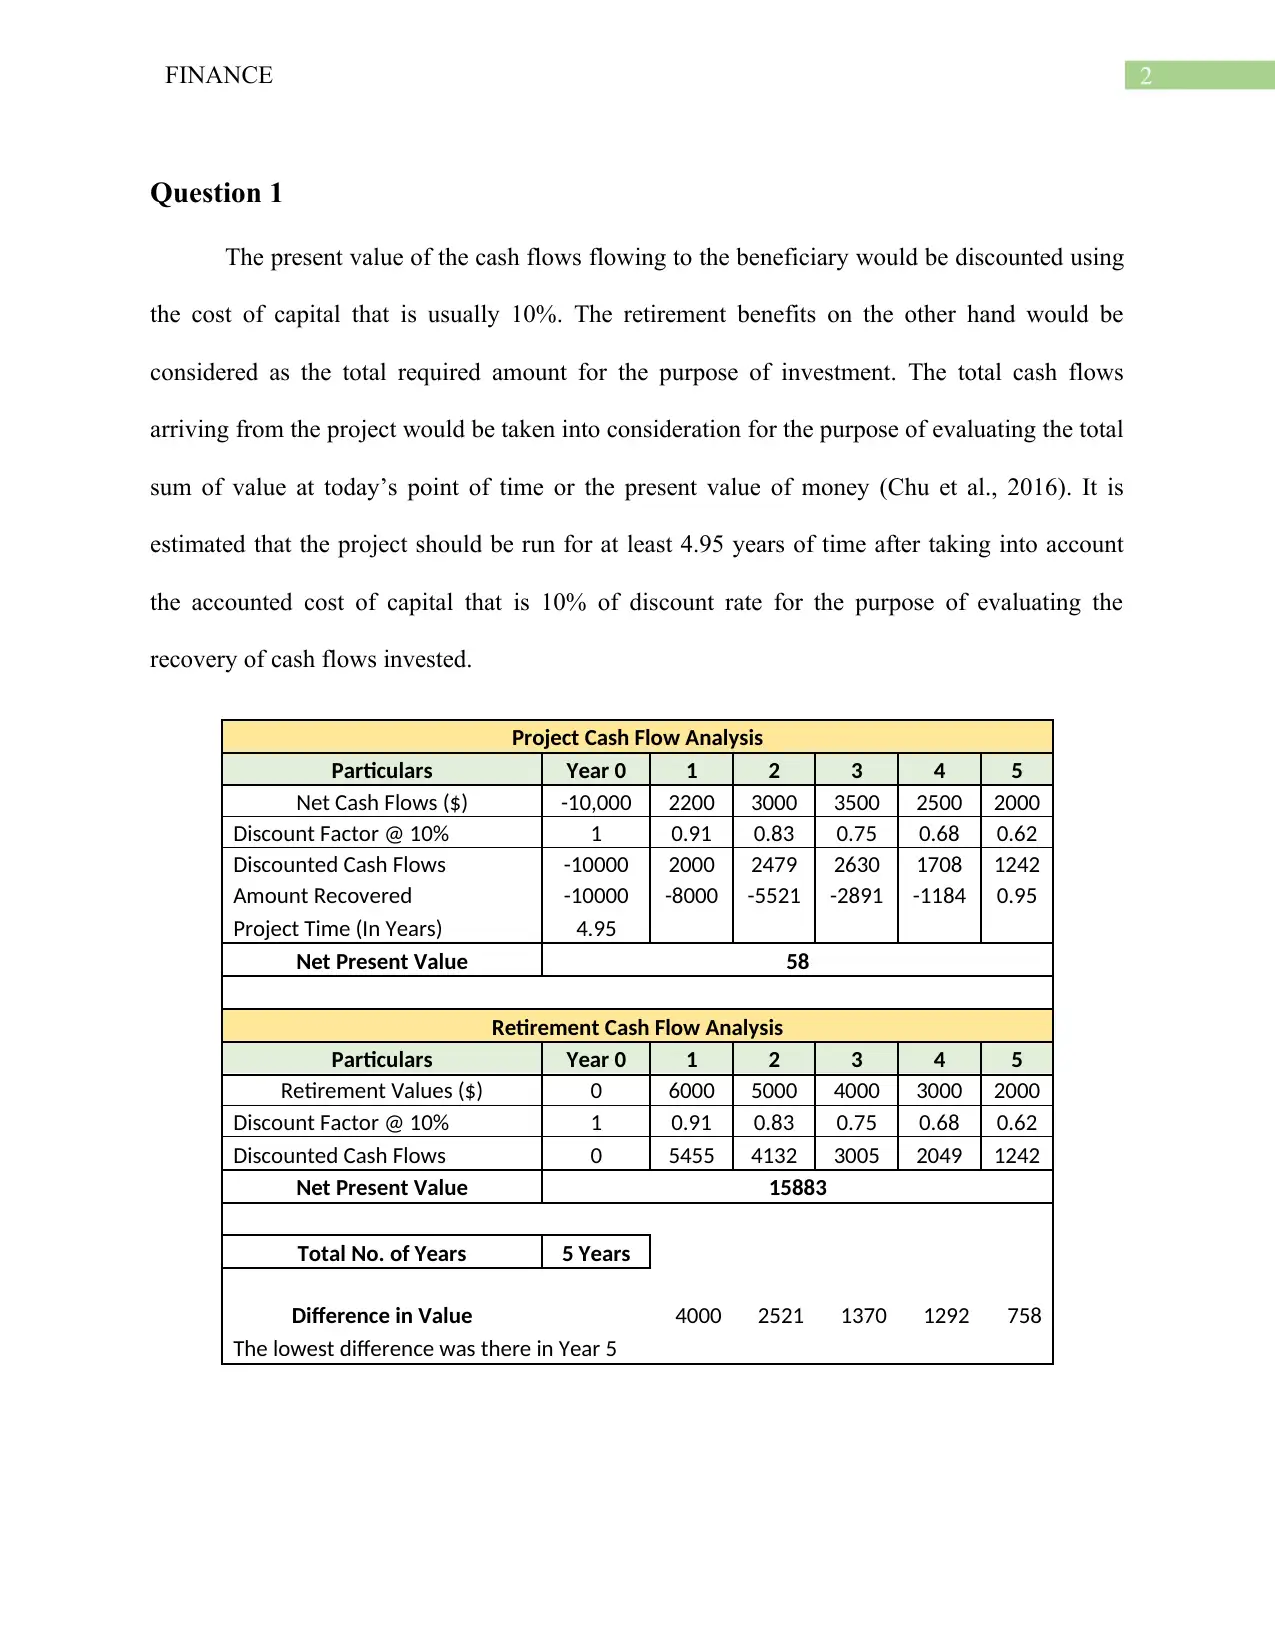
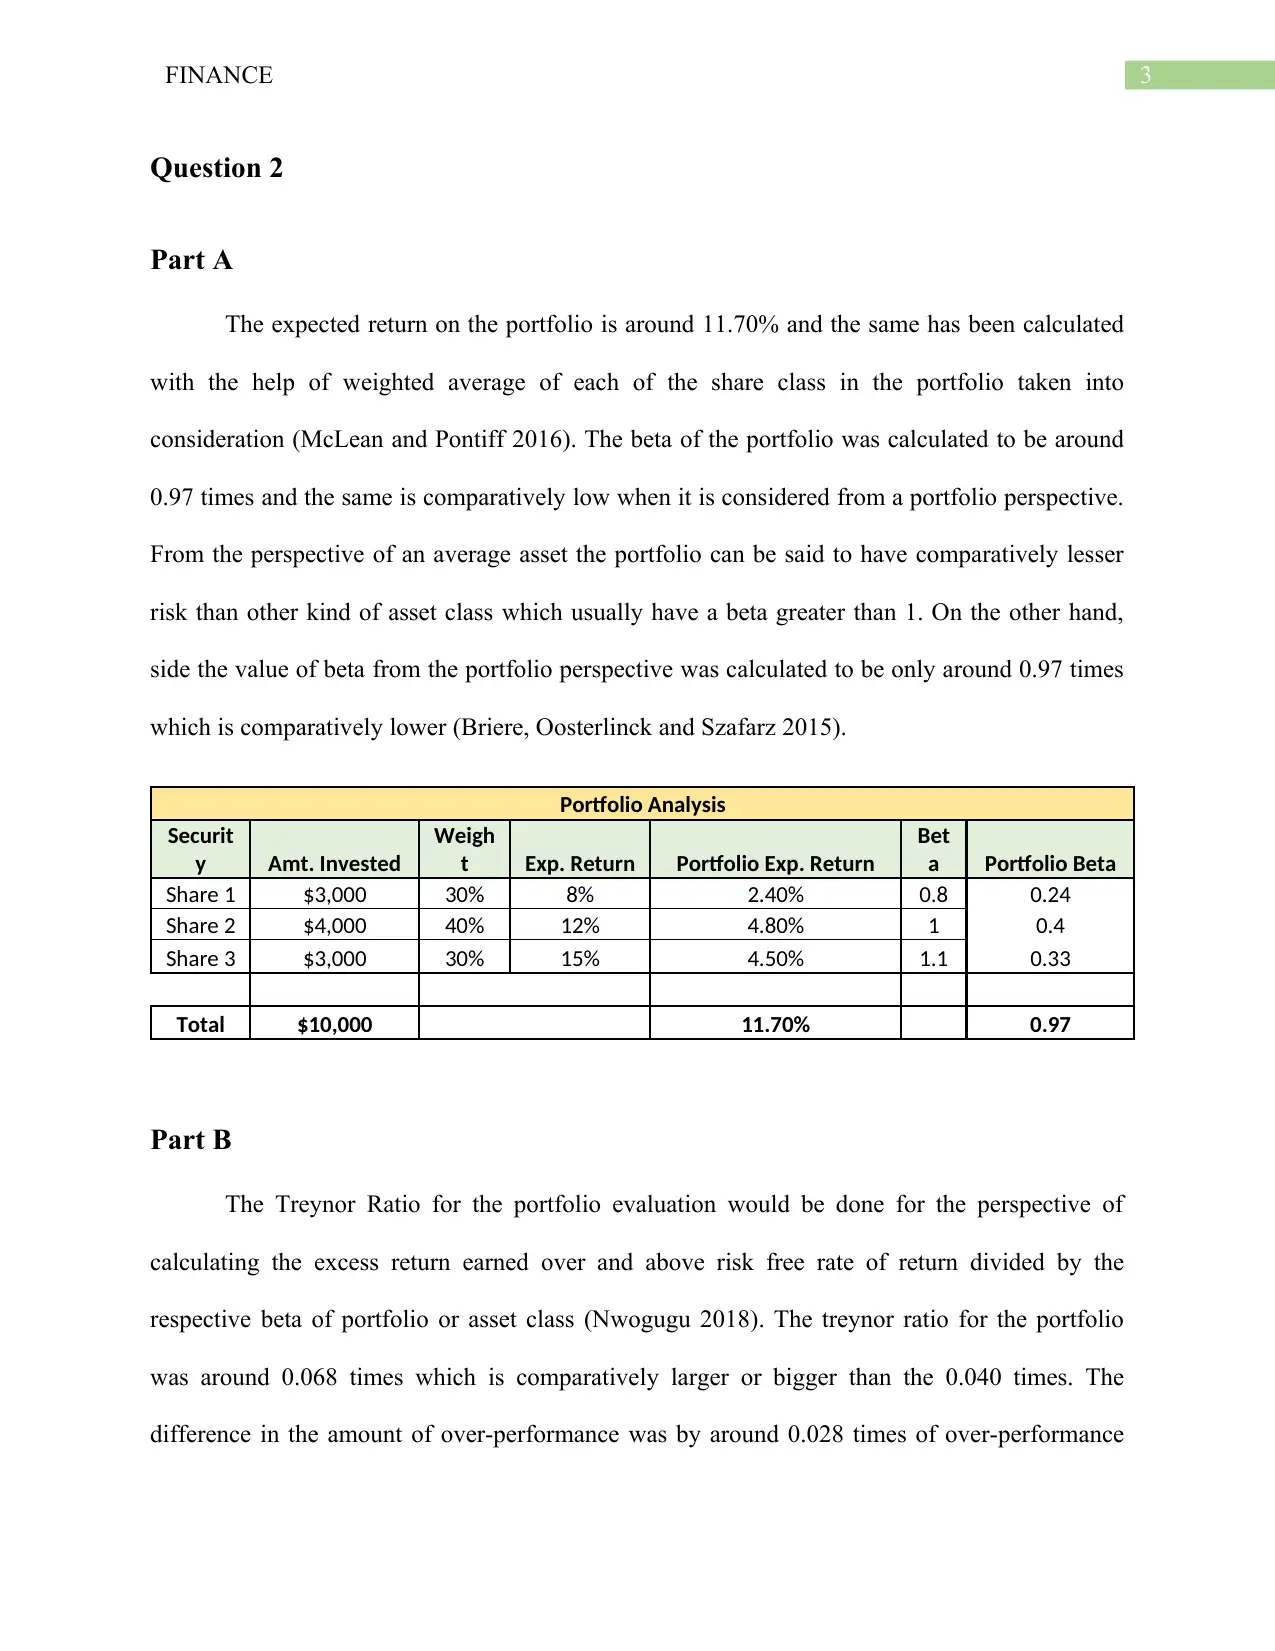
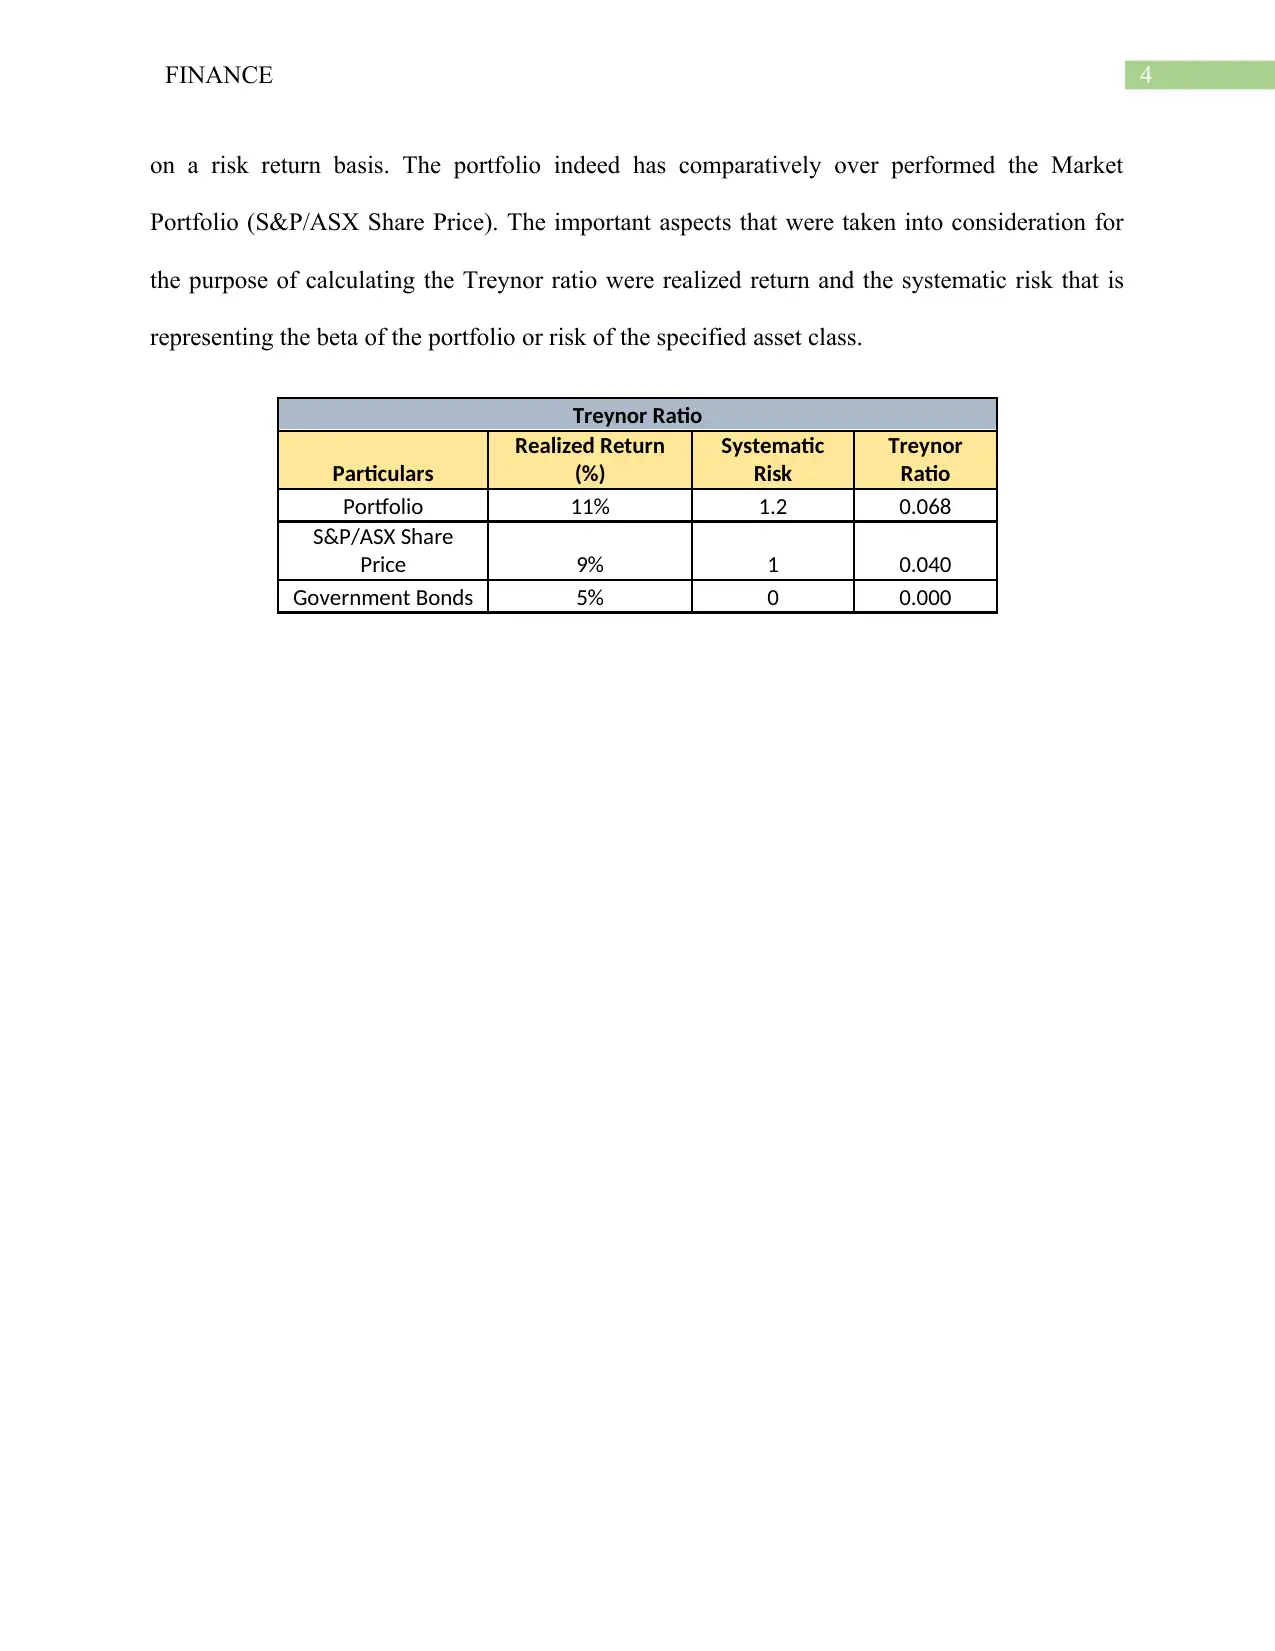
This finance assignment solution provides a detailed analysis of two key financial concepts: cash flow and portfolio management. The first section analyzes a project's cash flows to determine its present value and investment recovery period, considering a 10% discount rate. It calculates the net present value (NPV) and identifies the project's time frame. The second section delves into portfolio analysis, calculating the expected return and beta of a portfolio comprising three different shares. The assignment also determines the Treynor ratio to evaluate the portfolio's performance compared to a market portfolio (S&P/ASX Share Price) and government bonds, assessing the excess return relative to systematic risk.

Running head: FINANCE
Finance
Name of the Student:
Name of the University:
Author’s Note:
Finance
Name of the Student:
Name of the University:
Author’s Note:
Paraphrase This Document
Need a fresh take? Get an instant paraphrase of this document with our AI Paraphraser

1FINANCE
Table of Contents
Question 1........................................................................................................................................2
Question 2........................................................................................................................................2
Part A...............................................................................................................................................2
Part B...............................................................................................................................................3
References........................................................................................................................................5

2FINANCE
Question 1
The present value of the cash flows flowing to the beneficiary would be discounted using
the cost of capital that is usually 10%. The retirement benefits on the other hand would be
considered as the total required amount for the purpose of investment. The total cash flows
arriving from the project would be taken into consideration for the purpose of evaluating the total
sum of value at today’s point of time or the present value of money (Chu et al., 2016). It is
estimated that the project should be run for at least 4.95 years of time after taking into account
the accounted cost of capital that is 10% of discount rate for the purpose of evaluating the
recovery of cash flows invested.
Project Cash Flow Analysis
Particulars Year 0 1 2 3 4 5
Net Cash Flows ($) -10,000 2200 3000 3500 2500 2000
Discount Factor @ 10% 1 0.91 0.83 0.75 0.68 0.62
Discounted Cash Flows -10000 2000 2479 2630 1708 1242
Amount Recovered -10000 -8000 -5521 -2891 -1184 0.95
Project Time (In Years) 4.95
Net Present Value 58
Retirement Cash Flow Analysis
Particulars Year 0 1 2 3 4 5
Retirement Values ($) 0 6000 5000 4000 3000 2000
Discount Factor @ 10% 1 0.91 0.83 0.75 0.68 0.62
Discounted Cash Flows 0 5455 4132 3005 2049 1242
Net Present Value 15883
Total No. of Years 5 Years
Difference in Value 4000 2521 1370 1292 758
The lowest difference was there in Year 5
⊘ This is a preview!⊘
Do you want full access?
Subscribe today to unlock all pages.

Trusted by 1+ million students worldwide

3FINANCE
Question 2
Part A
The expected return on the portfolio is around 11.70% and the same has been calculated
with the help of weighted average of each of the share class in the portfolio taken into
consideration (McLean and Pontiff 2016). The beta of the portfolio was calculated to be around
0.97 times and the same is comparatively low when it is considered from a portfolio perspective.
From the perspective of an average asset the portfolio can be said to have comparatively lesser
risk than other kind of asset class which usually have a beta greater than 1. On the other hand,
side the value of beta from the portfolio perspective was calculated to be only around 0.97 times
which is comparatively lower (Briere, Oosterlinck and Szafarz 2015).
Portfolio Analysis
Securit
y Amt. Invested
Weigh
t Exp. Return Portfolio Exp. Return
Bet
a Portfolio Beta
Share 1 $3,000 30% 8% 2.40% 0.8 0.24
Share 2 $4,000 40% 12% 4.80% 1 0.4
Share 3 $3,000 30% 15% 4.50% 1.1 0.33
Total $10,000 11.70% 0.97
Part B
The Treynor Ratio for the portfolio evaluation would be done for the perspective of
calculating the excess return earned over and above risk free rate of return divided by the
respective beta of portfolio or asset class (Nwogugu 2018). The treynor ratio for the portfolio
was around 0.068 times which is comparatively larger or bigger than the 0.040 times. The
difference in the amount of over-performance was by around 0.028 times of over-performance
Paraphrase This Document
Need a fresh take? Get an instant paraphrase of this document with our AI Paraphraser

4FINANCE
on a risk return basis. The portfolio indeed has comparatively over performed the Market
Portfolio (S&P/ASX Share Price). The important aspects that were taken into consideration for
the purpose of calculating the Treynor ratio were realized return and the systematic risk that is
representing the beta of the portfolio or risk of the specified asset class.
Treynor Ratio
Particulars
Realized Return
(%)
Systematic
Risk
Treynor
Ratio
Portfolio 11% 1.2 0.068
S&P/ASX Share
Price 9% 1 0.040
Government Bonds 5% 0 0.000

5FINANCE
References
Briere, M., Oosterlinck, K. and Szafarz, A., 2015. Virtual currency, tangible return: Portfolio
diversification with bitcoin. Journal of Asset Management, 16(6), pp.365-373.
Chu, V.W., Chen, F., Wong, R.K., Ho, I. and Lee, J., 2016, January. Enhancing portfolio return
based on market-sentiment linked topics. In 2016 International Conference on Big Data and
Smart Computing (BigComp) (pp. 85-92). IEEE
McLean, R.D. and Pontiff, J., 2016. Does academic research destroy stock return predictability?.
The Journal of Finance, 71(1), pp.5-32.
Nwogugu, M.I., 2018. Informationless Trading and Biases in Performance Measurement:
Inefficiency of the Sharpe Ratio, Treynor Ratio, Jensen’s Alpha, the Information Ratio and
DEA-Based Performance Measures and Related Measures. In Indices, Index Funds And ETFs
(pp. 233-265). Palgrave Macmillan, London.
⊘ This is a preview!⊘
Do you want full access?
Subscribe today to unlock all pages.

Trusted by 1+ million students worldwide
1 out of 6
Related Documents

Your All-in-One AI-Powered Toolkit for Academic Success.
+13062052269
info@desklib.com
Available 24*7 on WhatsApp / Email
Unlock your academic potential
Copyright © 2020–2025 A2Z Services. All Rights Reserved. Developed and managed by ZUCOL.