MSIN0021 Finance I: Investment Analysis and Portfolio Management
VerifiedAdded on 2023/04/23
|15
|3162
|366
Homework Assignment
AI Summary
This assignment delves into various aspects of finance, focusing on investment analysis and portfolio management. It includes calculations of expected returns and standard deviations for stocks, covariance, correlation coefficients, and Sharpe ratios. The assignment explores risk aversion, portfolio price of risk, and capital allocation strategies. It further discusses efficient frontiers, minimum variance portfolios, and optimal portfolios, including computations of expected returns, standard deviations, and reward-to-volatility ratios. The analysis also considers the validity of including gold in an efficient frontier. Desklib provides a platform to explore more solved assignments and past papers.
Running head: FINANCE
Finance
Name of the Student:
Name of the University:
Author’s Note:
Course ID:
Finance
Name of the Student:
Name of the University:
Author’s Note:
Course ID:
Paraphrase This Document
Need a fresh take? Get an instant paraphrase of this document with our AI Paraphraser
1FINANCE
Table of Contents
Question 1:.......................................................................................................................................3
a. Calculating expected return of Stratum Corp. and Quamed Inc:.................................................3
b. Calculating the standard deviation of Stratum Corp. and Quamed Inc:......................................3
c. Calculating the covariance and the coefficient of correlation between Stratum Corp. and
Quamed Inc:.....................................................................................................................................3
d. Calculating the expected return and the standard deviation of the risky portfolio:.....................4
e. Explaining the nature and purpose of the Sharpe ratio, and how it applies to i) portfolios and ii)
individual stocks.:............................................................................................................................4
f. Calculating the Sharpe ratio of the risky portfolio:......................................................................5
gi . Defining about an investor’s degree of risk aversion:...............................................................5
gii. Defining about a portfolio’s price of risk:.................................................................................5
giii. Briefly explaining how the two can be used together to arrive at a preferred capital
allocation:........................................................................................................................................6
h. Calculating a client’s degree of risk aversion if their corresponding preferred capital allocation
is equal to 90%:...............................................................................................................................6
Question 2:.......................................................................................................................................7
a. Explaining an efficient frontier is in the context of a mean-variance framework, while
discussing about the minimum variance and the optimal portfolio significance:...........................7
b. Computing the expected return and the standard deviation of a portfolio:.................................8
c. Drawing investment opportunity set with stocks and bonds:......................................................8
d. Computing the expected return and standard deviation of the minimum variance portfolio:.....9
ei. Drawing the tangency Capital Allocation Line (CAL), and identifying the optimal portfolio:. 9
2FINANCE
eii. Computing the expected return and standard deviation of the optimal portfolio:...................10
eiii. Calculating the reward-to-volatility ratio of the optimal CAL line:.......................................10
f. Calculating the standard deviation of the total portfolio:...........................................................10
gi. Clearly explaining about the asset class dominating another:..................................................11
gii. Discussing the validity and appropriateness of including gold in the efficient frontier:.........11
References and Bibliography:........................................................................................................12
⊘ This is a preview!⊘
Do you want full access?
Subscribe today to unlock all pages.
Trusted by 1+ million students worldwide
3FINANCE
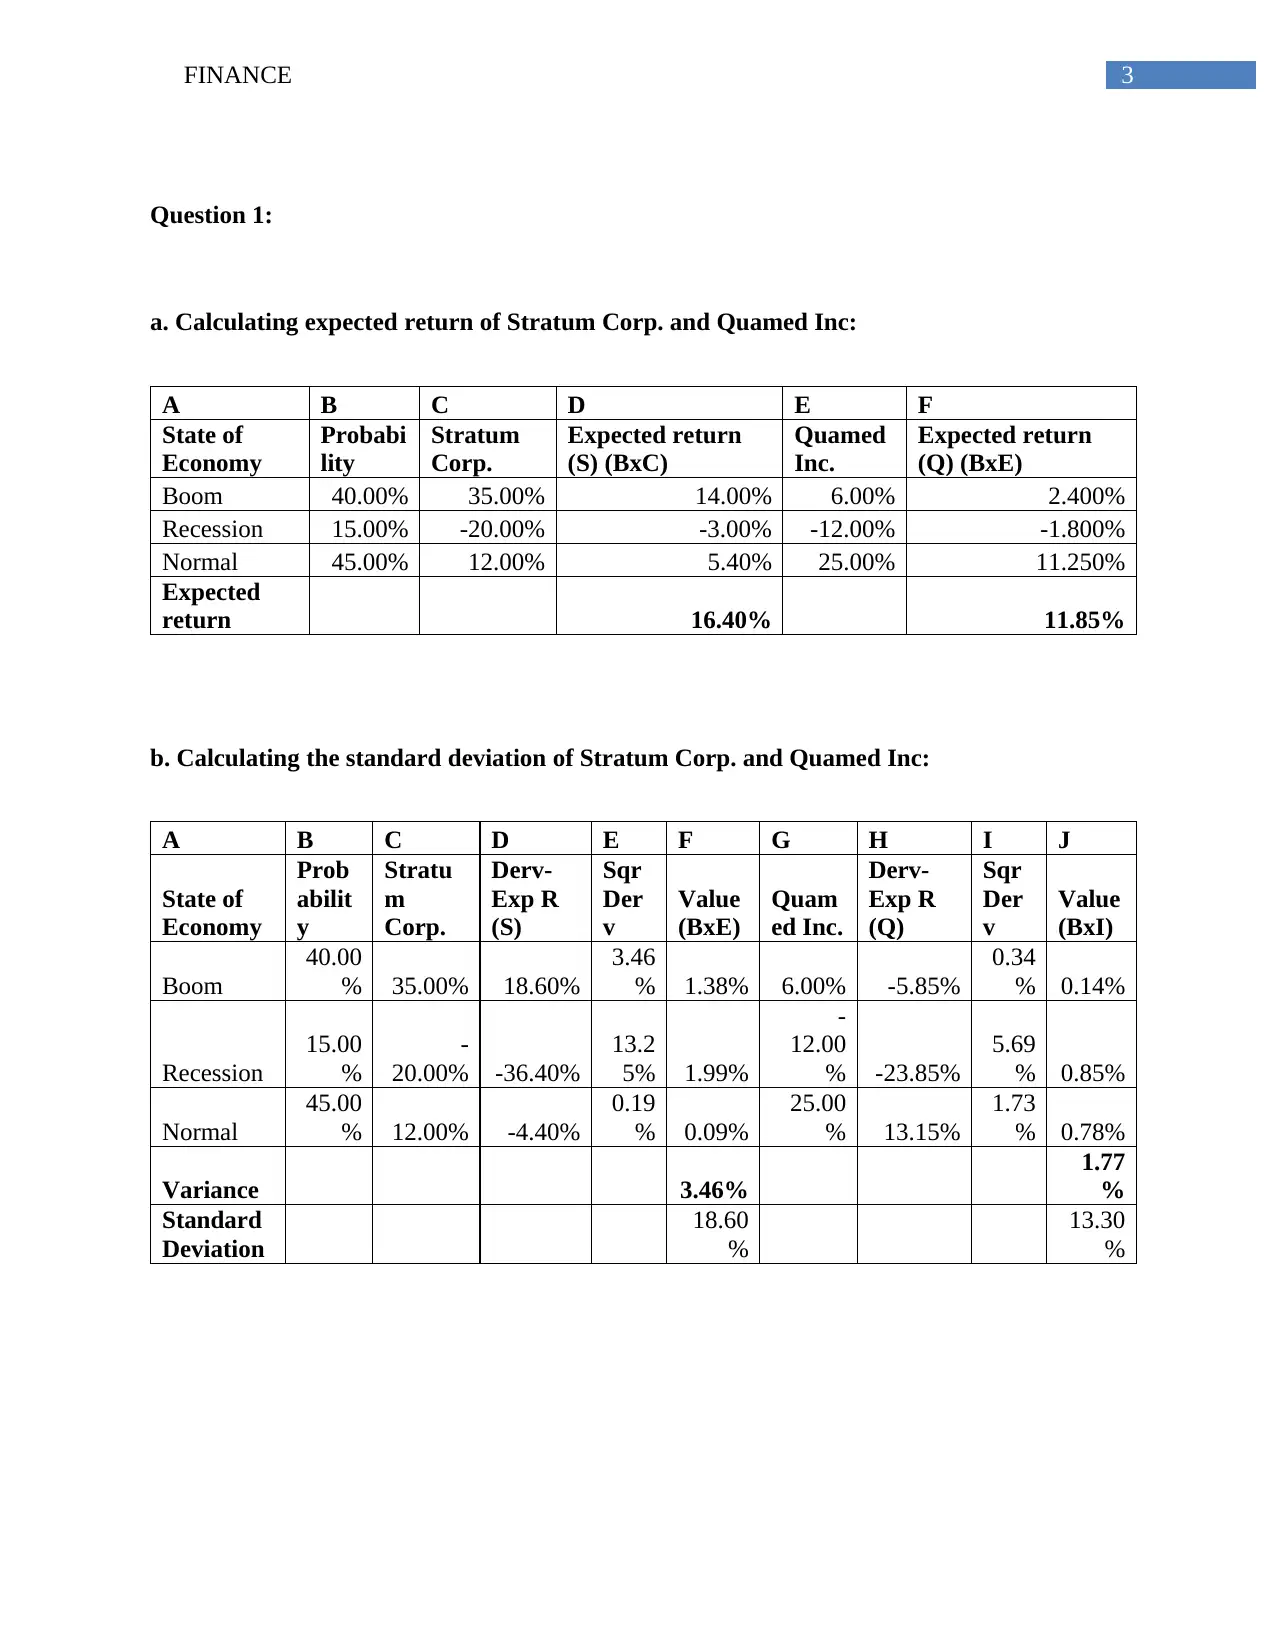
Question 1:
a. Calculating expected return of Stratum Corp. and Quamed Inc:
A B C D E F
State of
Economy
Probabi
lity
Stratum
Corp.
Expected return
(S) (BxC)
Quamed
Inc.
Expected return
(Q) (BxE)
Boom 40.00% 35.00% 14.00% 6.00% 2.400%
Recession 15.00% -20.00% -3.00% -12.00% -1.800%
Normal 45.00% 12.00% 5.40% 25.00% 11.250%
Expected
return 16.40% 11.85%
b. Calculating the standard deviation of Stratum Corp. and Quamed Inc:
A B C D E F G H I J
State of
Economy
Prob
abilit
y
Stratu
m
Corp.
Derv-
Exp R
(S)
Sqr
Der
v
Value
(BxE)
Quam
ed Inc.
Derv-
Exp R
(Q)
Sqr
Der
v
Value
(BxI)
Boom
40.00
% 35.00% 18.60%
3.46
% 1.38% 6.00% -5.85%
0.34
% 0.14%
Recession
15.00
%
-
20.00% -36.40%
13.2
5% 1.99%
-
12.00
% -23.85%
5.69
% 0.85%
Normal
45.00
% 12.00% -4.40%
0.19
% 0.09%
25.00
% 13.15%
1.73
% 0.78%
Variance 3.46%
1.77
%
Standard
Deviation
18.60
%
13.30
%
Paraphrase This Document
Need a fresh take? Get an instant paraphrase of this document with our AI Paraphraser
4FINANCE
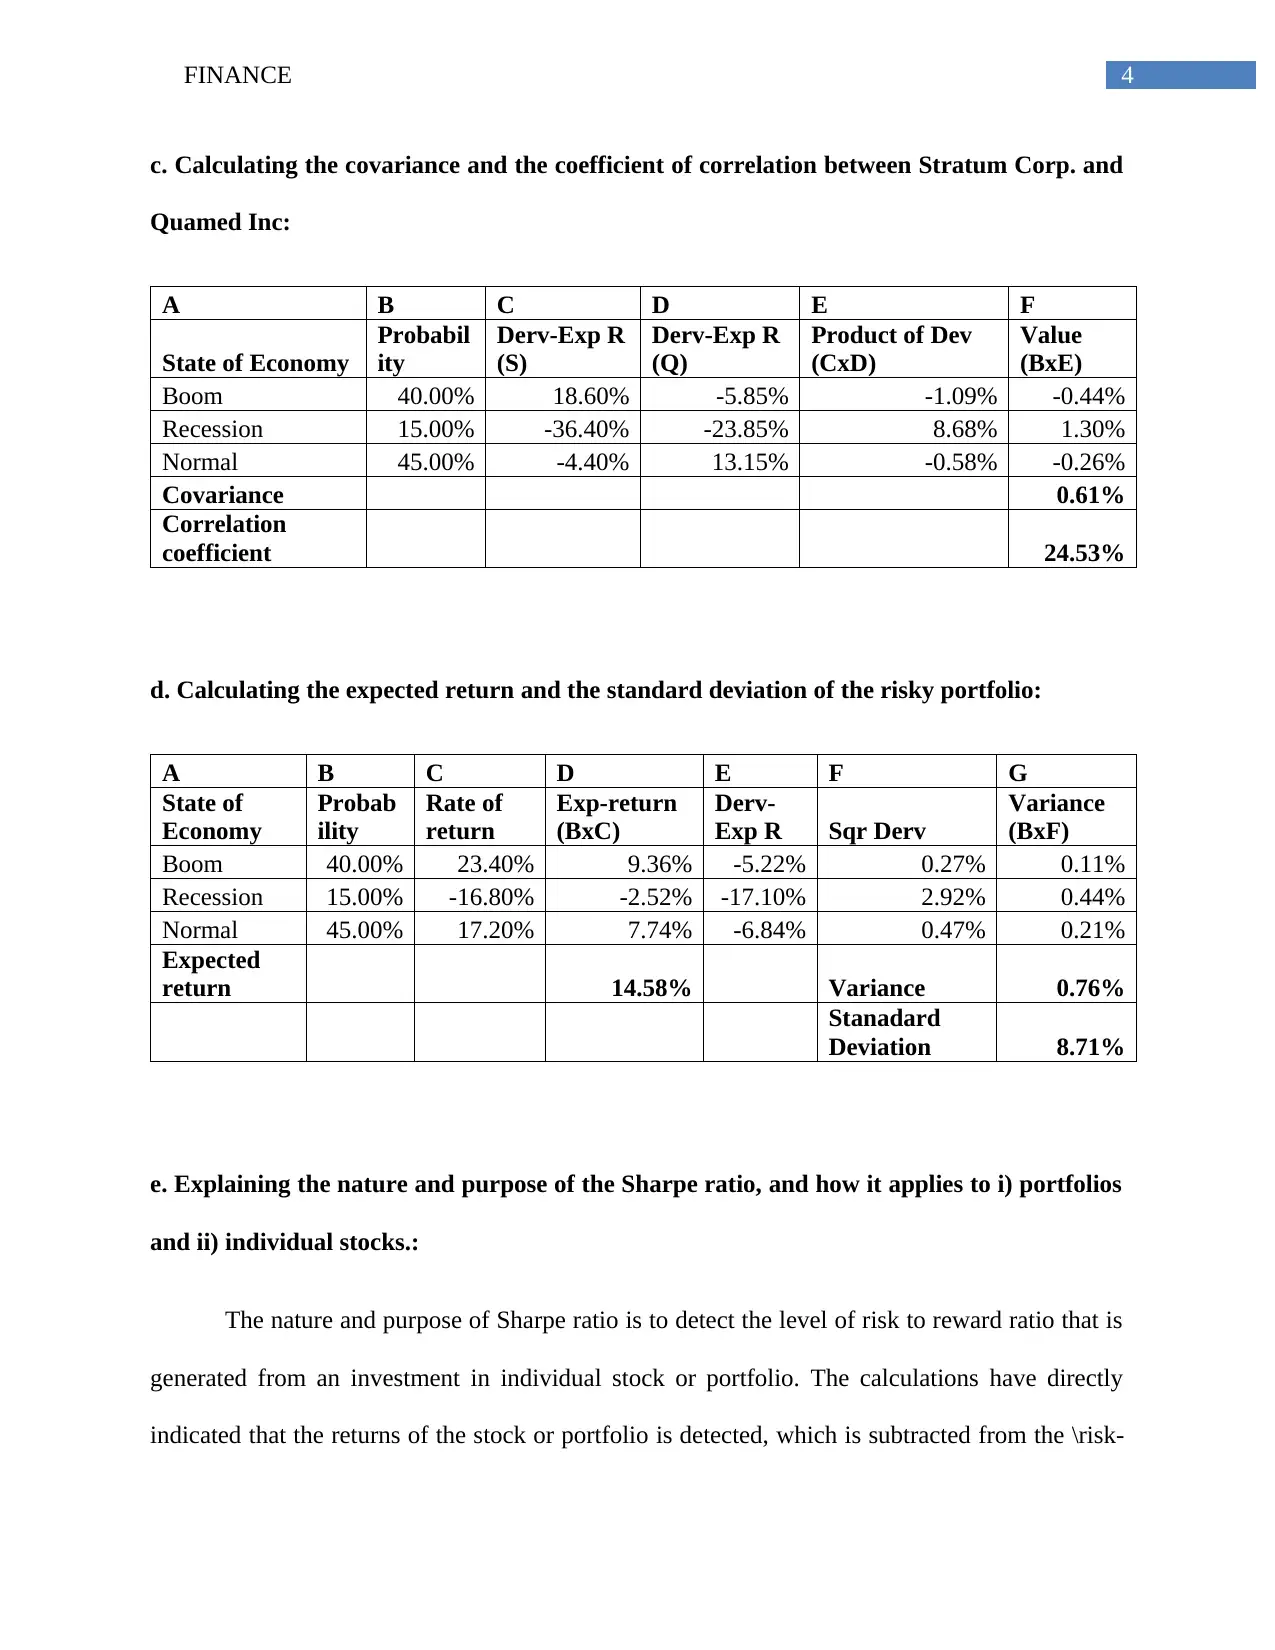
c. Calculating the covariance and the coefficient of correlation between Stratum Corp. and
Quamed Inc:
A B C D E F
State of Economy
Probabil
ity
Derv-Exp R
(S)
Derv-Exp R
(Q)
Product of Dev
(CxD)
Value
(BxE)
Boom 40.00% 18.60% -5.85% -1.09% -0.44%
Recession 15.00% -36.40% -23.85% 8.68% 1.30%
Normal 45.00% -4.40% 13.15% -0.58% -0.26%
Covariance 0.61%
Correlation
coefficient 24.53%
d. Calculating the expected return and the standard deviation of the risky portfolio:
A B C D E F G
State of
Economy
Probab
ility
Rate of
return
Exp-return
(BxC)
Derv-
Exp R Sqr Derv
Variance
(BxF)
Boom 40.00% 23.40% 9.36% -5.22% 0.27% 0.11%
Recession 15.00% -16.80% -2.52% -17.10% 2.92% 0.44%
Normal 45.00% 17.20% 7.74% -6.84% 0.47% 0.21%
Expected
return 14.58% Variance 0.76%
Stanadard
Deviation 8.71%
e. Explaining the nature and purpose of the Sharpe ratio, and how it applies to i) portfolios
and ii) individual stocks.:
The nature and purpose of Sharpe ratio is to detect the level of risk to reward ratio that is
generated from an investment in individual stock or portfolio. The calculations have directly
indicated that the returns of the stock or portfolio is detected, which is subtracted from the \risk-
5FINANCE
free rate that is being providing in the current period. Moreover, after deriving the values the
whole value is divided by the standard deviation of the portfolio or stock. This mainly helps in
detecting the level of risk to reward ratio from an investment. There, it could be understood that
there is no difference between the calculation of Sharpe ratio in terms of stock or portfolio
(Chandra 2017).
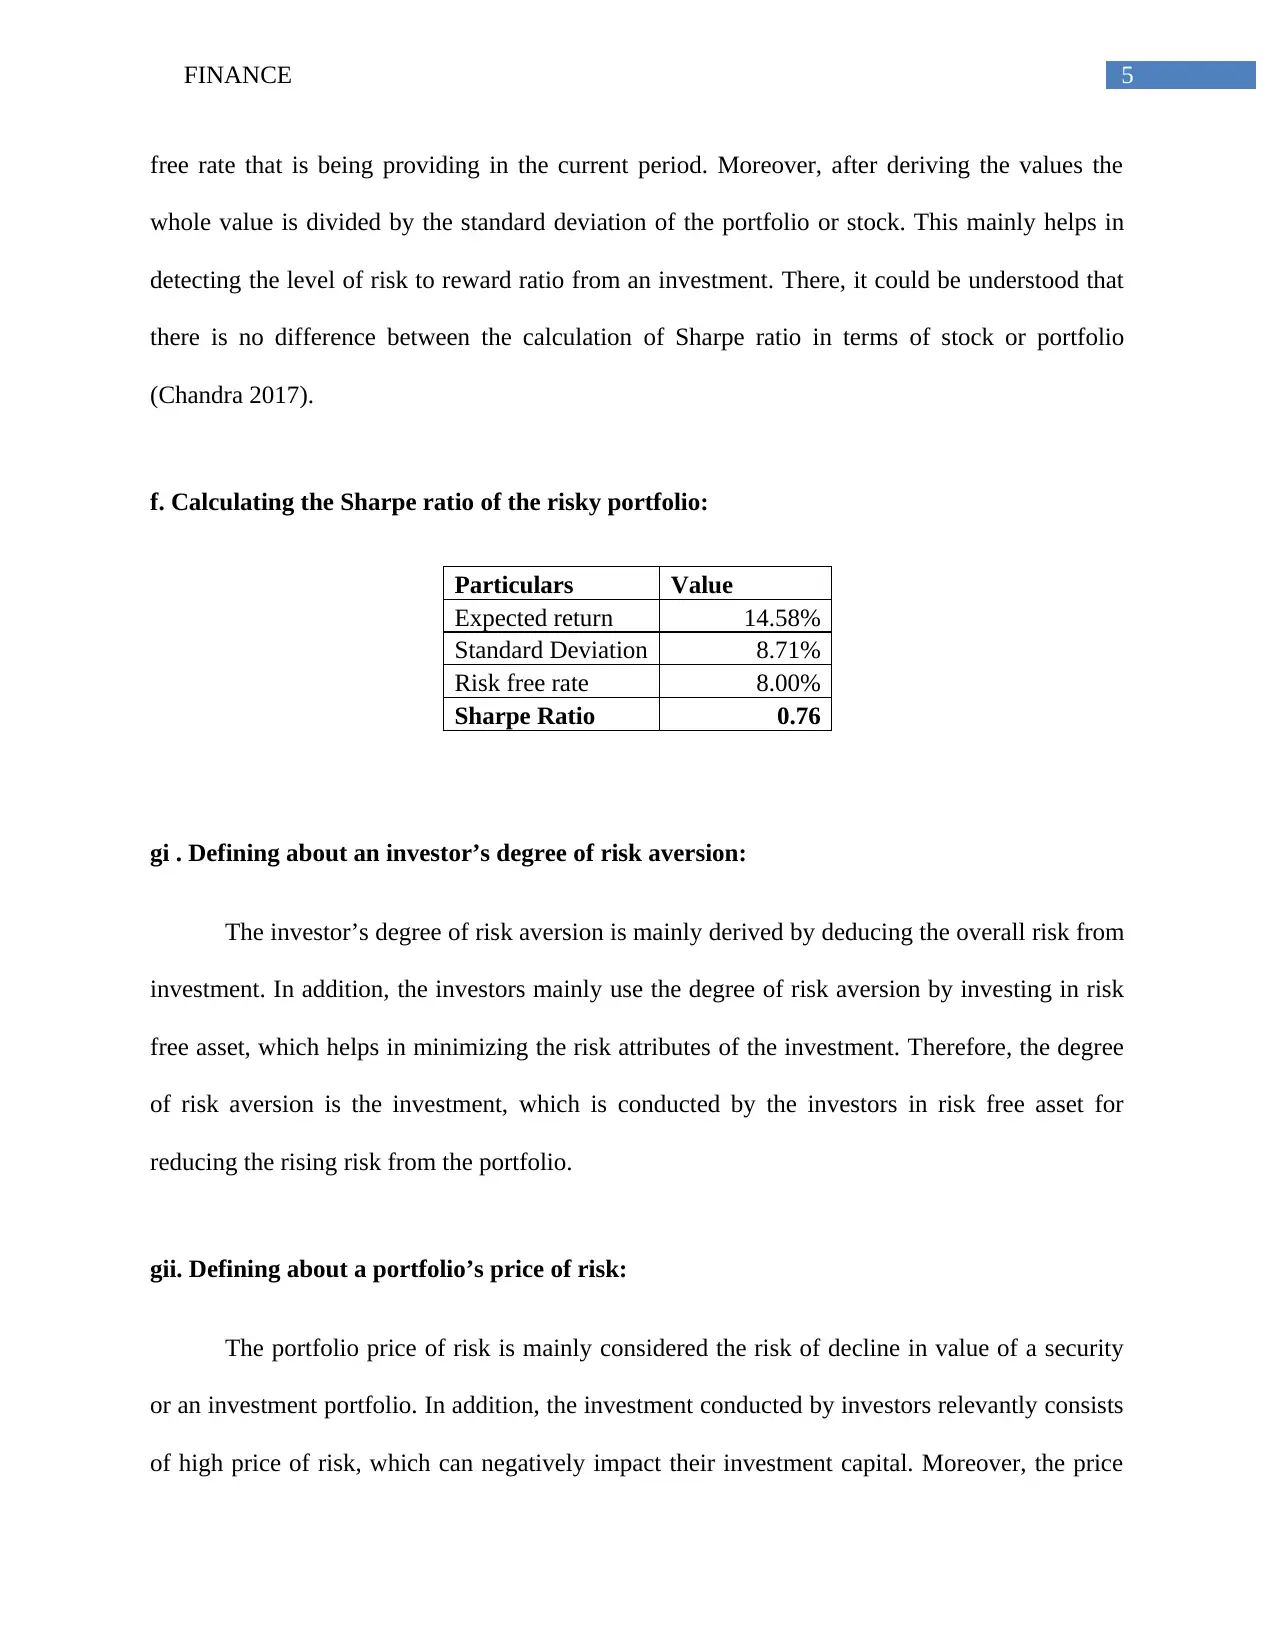
f. Calculating the Sharpe ratio of the risky portfolio:
Particulars Value
Expected return 14.58%
Standard Deviation 8.71%
Risk free rate 8.00%
Sharpe Ratio 0.76
gi . Defining about an investor’s degree of risk aversion:
The investor’s degree of risk aversion is mainly derived by deducing the overall risk from
investment. In addition, the investors mainly use the degree of risk aversion by investing in risk
free asset, which helps in minimizing the risk attributes of the investment. Therefore, the degree
of risk aversion is the investment, which is conducted by the investors in risk free asset for
reducing the rising risk from the portfolio.
gii. Defining about a portfolio’s price of risk:
The portfolio price of risk is mainly considered the risk of decline in value of a security
or an investment portfolio. In addition, the investment conducted by investors relevantly consists
of high price of risk, which can negatively impact their investment capital. Moreover, the price
free rate that is being providing in the current period. Moreover, after deriving the values the
whole value is divided by the standard deviation of the portfolio or stock. This mainly helps in
detecting the level of risk to reward ratio from an investment. There, it could be understood that
there is no difference between the calculation of Sharpe ratio in terms of stock or portfolio
(Chandra 2017).
f. Calculating the Sharpe ratio of the risky portfolio:
Particulars Value
Expected return 14.58%
Standard Deviation 8.71%
Risk free rate 8.00%
Sharpe Ratio 0.76
gi . Defining about an investor’s degree of risk aversion:
The investor’s degree of risk aversion is mainly derived by deducing the overall risk from
investment. In addition, the investors mainly use the degree of risk aversion by investing in risk
free asset, which helps in minimizing the risk attributes of the investment. Therefore, the degree
of risk aversion is the investment, which is conducted by the investors in risk free asset for
reducing the rising risk from the portfolio.
gii. Defining about a portfolio’s price of risk:
The portfolio price of risk is mainly considered the risk of decline in value of a security
or an investment portfolio. In addition, the investment conducted by investors relevantly consists
of high price of risk, which can negatively impact their investment capital. Moreover, the price
⊘ This is a preview!⊘
Do you want full access?
Subscribe today to unlock all pages.
Trusted by 1+ million students worldwide
6FINANCE
of risk is mainly low in blue-chip stocks, as they are considered to be less volatile in nature.
Therefore, it can be assumed that the share price of maximum companies has high price of risk,
which needs to be mitigated by conducting adequate diversified investments. Chen, Yongjian
and Jun (2018) mentioned that investors use of the diversification method for minimizing the
negative impact on their investment, while generating adequate returns to support their
investment scope.
giii. Briefly explaining how the two can be used together to arrive at a preferred capital
allocation:
With the help of degree of risk aversion and price of risk investors are able to arrive at a
prefeed capital allocation, which is suitable for investment. In addition, the calculations directly
provide insight to the investors are regarding the risk conditions of the investment, which needs
to be mitigated for securing the investment capital. Hence, the price of risk mainly provides the
investors with adequate information regarding the risk attributes of the investment. Therefore,
the investor can adequately use the measure for generating high level of income from
investment, while minimizing the anticipated risk attributes of investment. Kindig and Bobby
(2018) mentioned that the combination of risk aversion method directly allows the organization
to increase their return generation capability by accommodating high risky stock in the portfolio.
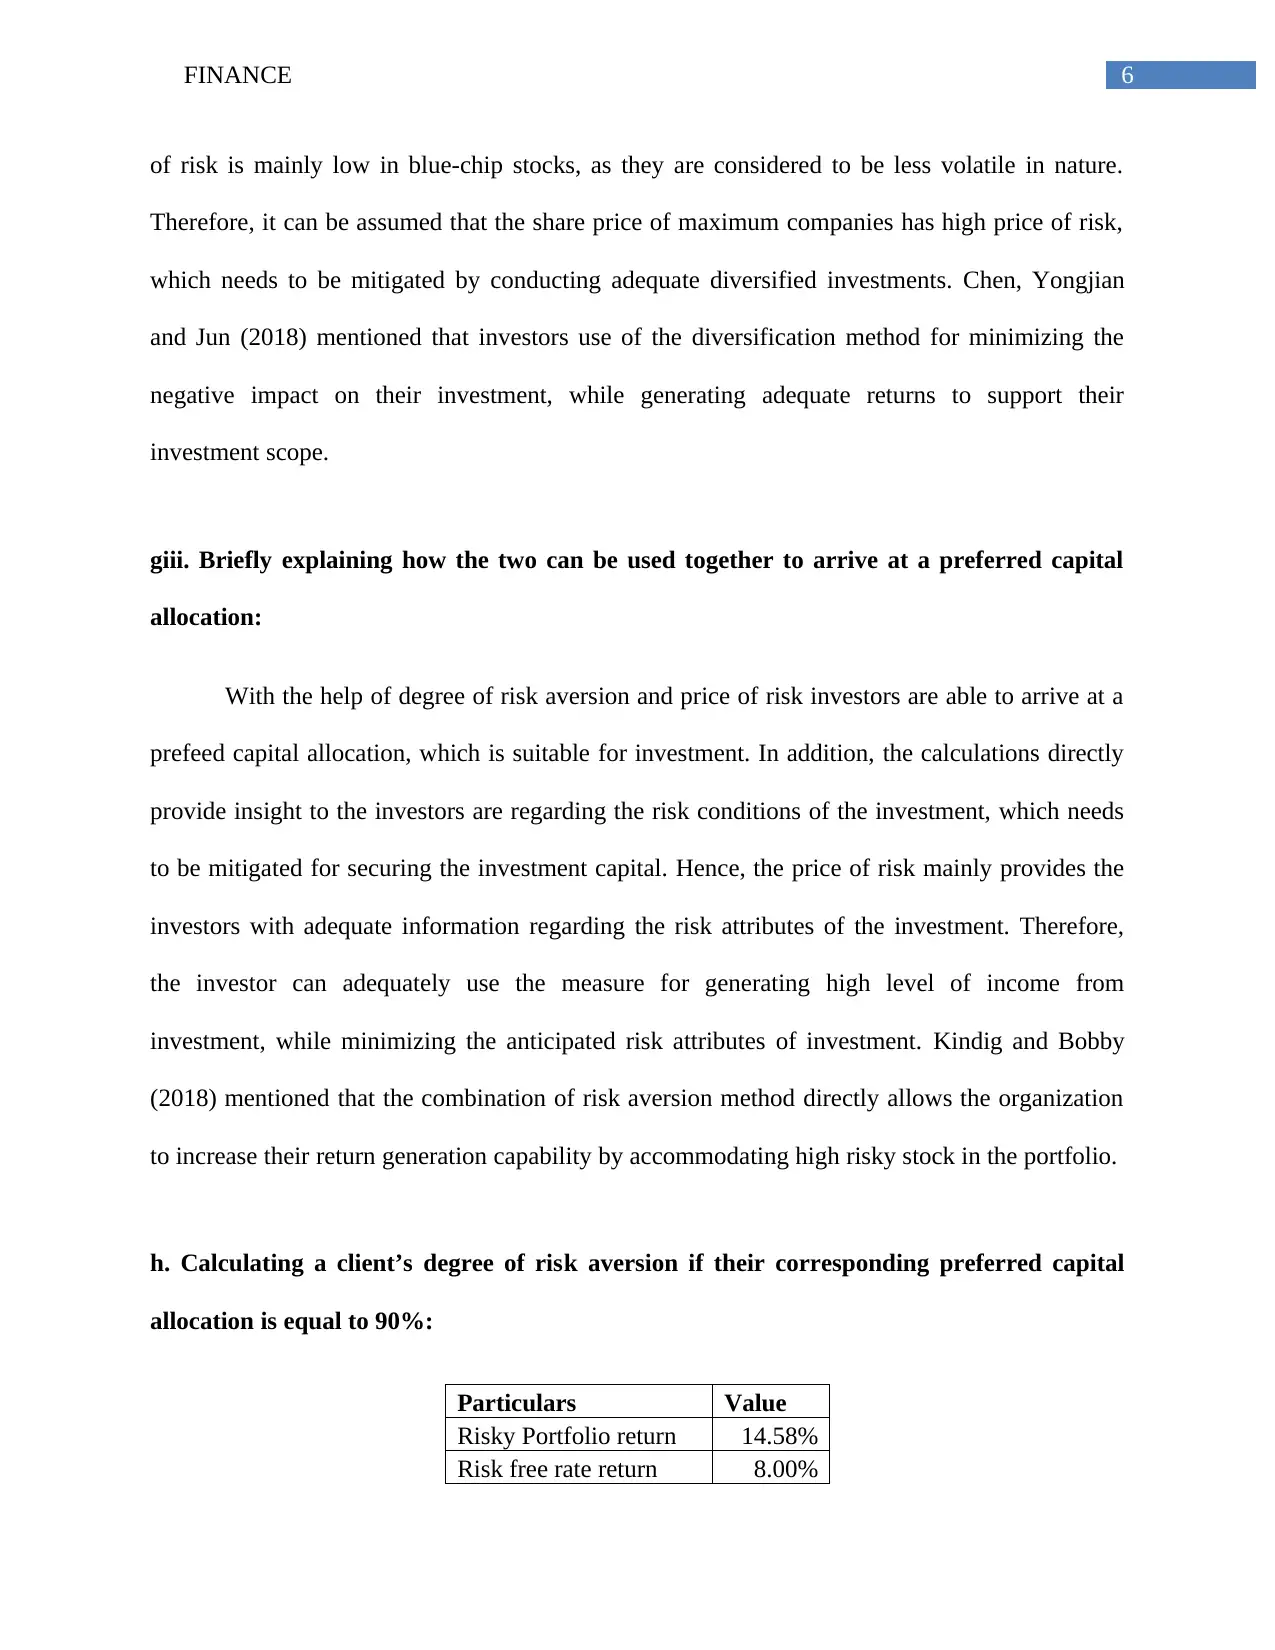
h. Calculating a client’s degree of risk aversion if their corresponding preferred capital
allocation is equal to 90%:
Particulars Value
Risky Portfolio return 14.58%
Risk free rate return 8.00%
of risk is mainly low in blue-chip stocks, as they are considered to be less volatile in nature.
Therefore, it can be assumed that the share price of maximum companies has high price of risk,
which needs to be mitigated by conducting adequate diversified investments. Chen, Yongjian
and Jun (2018) mentioned that investors use of the diversification method for minimizing the
negative impact on their investment, while generating adequate returns to support their
investment scope.
giii. Briefly explaining how the two can be used together to arrive at a preferred capital
allocation:
With the help of degree of risk aversion and price of risk investors are able to arrive at a
prefeed capital allocation, which is suitable for investment. In addition, the calculations directly
provide insight to the investors are regarding the risk conditions of the investment, which needs
to be mitigated for securing the investment capital. Hence, the price of risk mainly provides the
investors with adequate information regarding the risk attributes of the investment. Therefore,
the investor can adequately use the measure for generating high level of income from
investment, while minimizing the anticipated risk attributes of investment. Kindig and Bobby
(2018) mentioned that the combination of risk aversion method directly allows the organization
to increase their return generation capability by accommodating high risky stock in the portfolio.
h. Calculating a client’s degree of risk aversion if their corresponding preferred capital
allocation is equal to 90%:
Particulars Value
Risky Portfolio return 14.58%
Risk free rate return 8.00%
Paraphrase This Document
Need a fresh take? Get an instant paraphrase of this document with our AI Paraphraser
7FINANCE
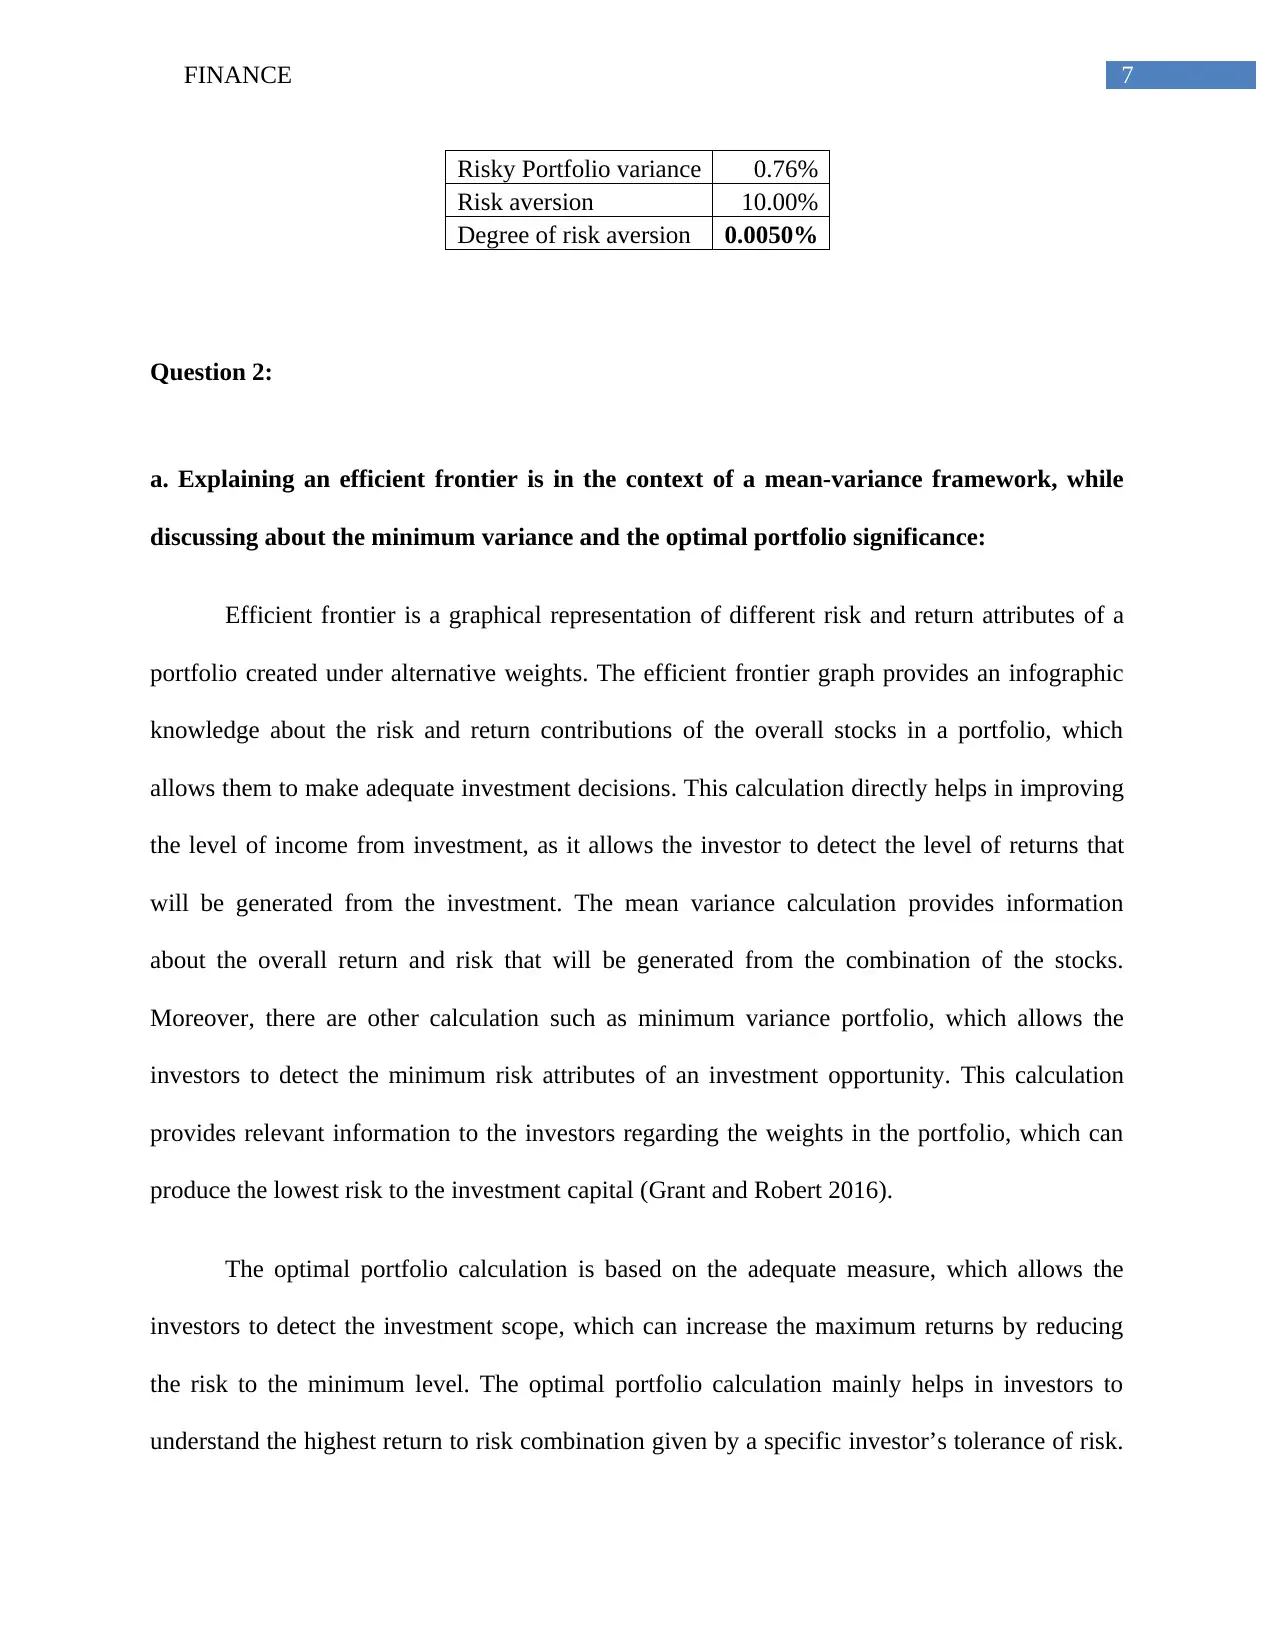
Risky Portfolio variance 0.76%
Risk aversion 10.00%
Degree of risk aversion 0.0050%
Question 2:
a. Explaining an efficient frontier is in the context of a mean-variance framework, while
discussing about the minimum variance and the optimal portfolio significance:
Efficient frontier is a graphical representation of different risk and return attributes of a
portfolio created under alternative weights. The efficient frontier graph provides an infographic
knowledge about the risk and return contributions of the overall stocks in a portfolio, which
allows them to make adequate investment decisions. This calculation directly helps in improving
the level of income from investment, as it allows the investor to detect the level of returns that
will be generated from the investment. The mean variance calculation provides information
about the overall return and risk that will be generated from the combination of the stocks.
Moreover, there are other calculation such as minimum variance portfolio, which allows the
investors to detect the minimum risk attributes of an investment opportunity. This calculation
provides relevant information to the investors regarding the weights in the portfolio, which can
produce the lowest risk to the investment capital (Grant and Robert 2016).
The optimal portfolio calculation is based on the adequate measure, which allows the
investors to detect the investment scope, which can increase the maximum returns by reducing
the risk to the minimum level. The optimal portfolio calculation mainly helps in investors to
understand the highest return to risk combination given by a specific investor’s tolerance of risk.
8FINANCE
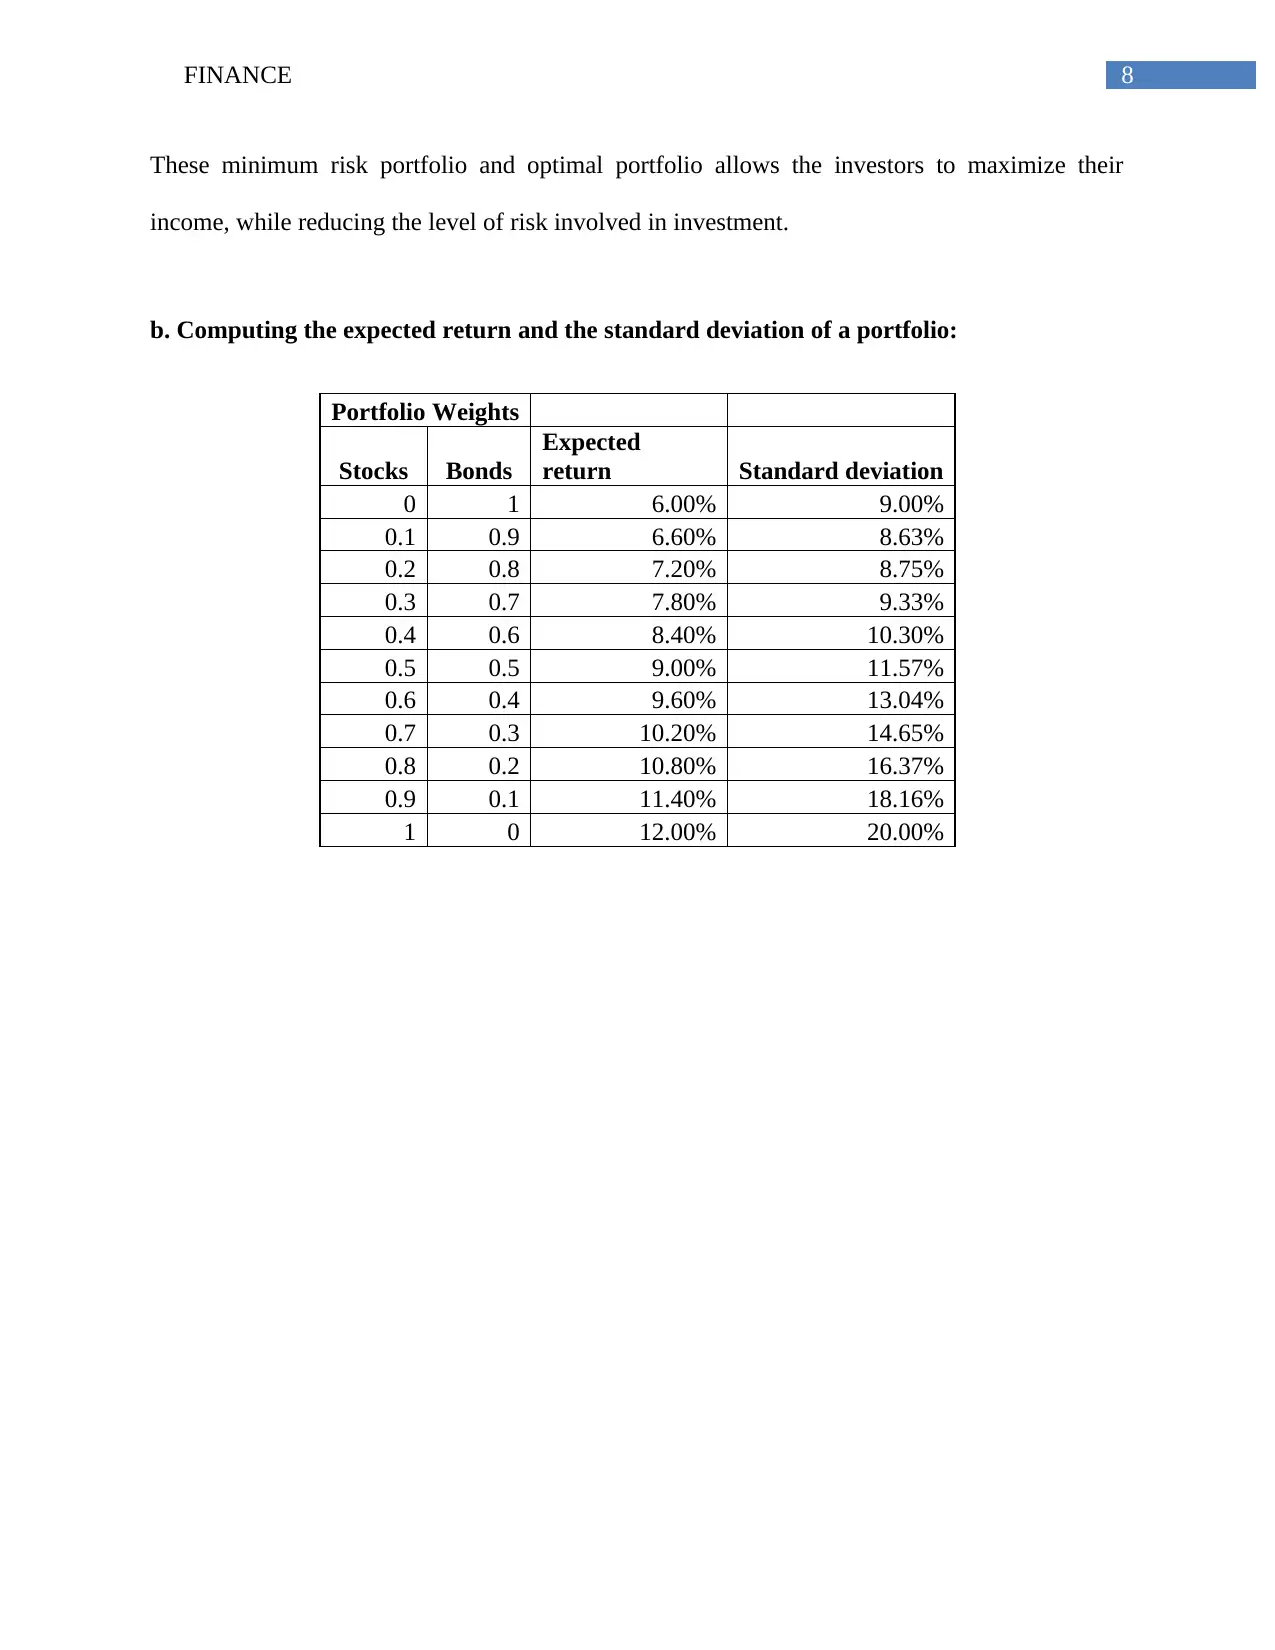
These minimum risk portfolio and optimal portfolio allows the investors to maximize their
income, while reducing the level of risk involved in investment.
b. Computing the expected return and the standard deviation of a portfolio:
Portfolio Weights
Stocks Bonds
Expected
return Standard deviation
0 1 6.00% 9.00%
0.1 0.9 6.60% 8.63%
0.2 0.8 7.20% 8.75%
0.3 0.7 7.80% 9.33%
0.4 0.6 8.40% 10.30%
0.5 0.5 9.00% 11.57%
0.6 0.4 9.60% 13.04%
0.7 0.3 10.20% 14.65%
0.8 0.2 10.80% 16.37%
0.9 0.1 11.40% 18.16%
1 0 12.00% 20.00%
⊘ This is a preview!⊘
Do you want full access?
Subscribe today to unlock all pages.
Trusted by 1+ million students worldwide
9FINANCE
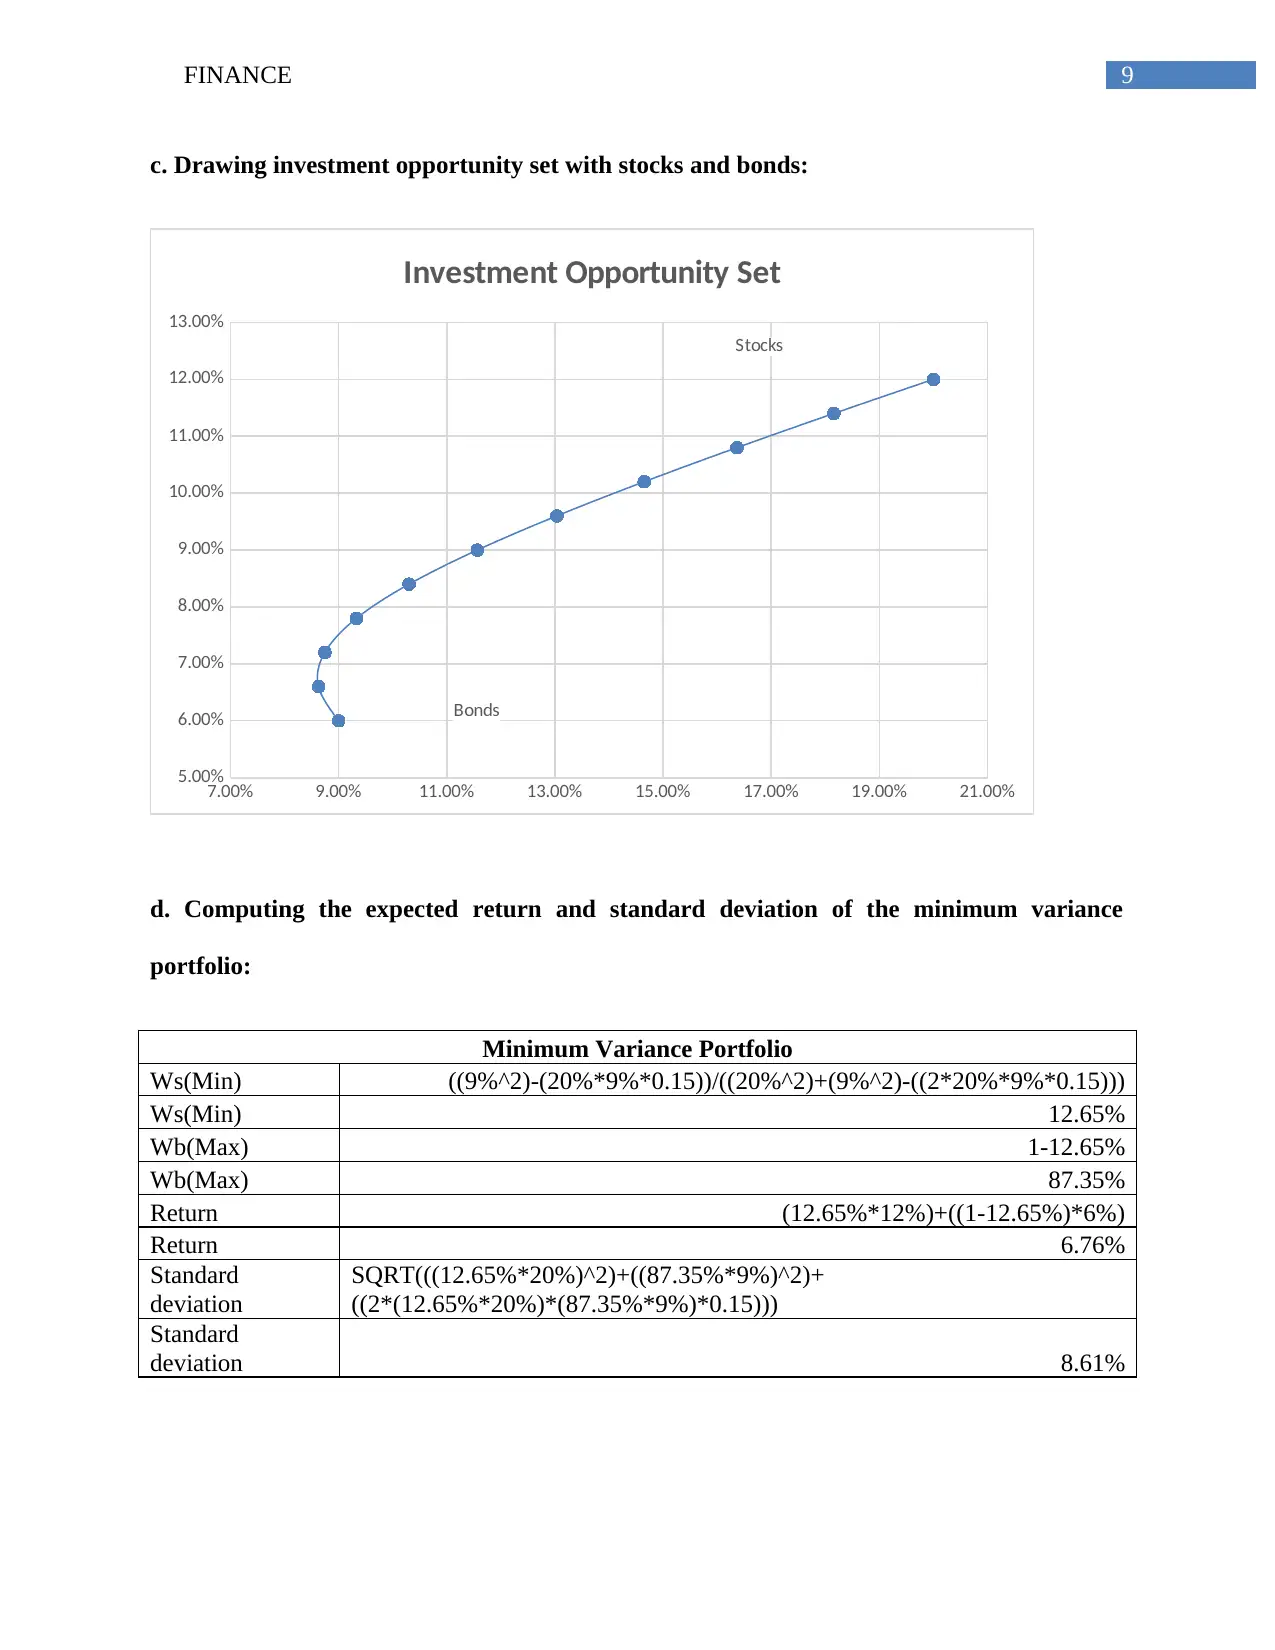
c. Drawing investment opportunity set with stocks and bonds:
7.00% 9.00% 11.00% 13.00% 15.00% 17.00% 19.00% 21.00%
5.00%
6.00%
7.00%
8.00%
9.00%
10.00%
11.00%
12.00%
13.00%
Bonds
Stocks
Investment Opportunity Set
d. Computing the expected return and standard deviation of the minimum variance
portfolio:
Minimum Variance Portfolio
Ws(Min) ((9%^2)-(20%*9%*0.15))/((20%^2)+(9%^2)-((2*20%*9%*0.15)))
Ws(Min) 12.65%
Wb(Max) 1-12.65%
Wb(Max) 87.35%
Return (12.65%*12%)+((1-12.65%)*6%)
Return 6.76%
Standard
deviation
SQRT(((12.65%*20%)^2)+((87.35%*9%)^2)+
((2*(12.65%*20%)*(87.35%*9%)*0.15)))
Standard
deviation 8.61%
Paraphrase This Document
Need a fresh take? Get an instant paraphrase of this document with our AI Paraphraser
10FINANCE
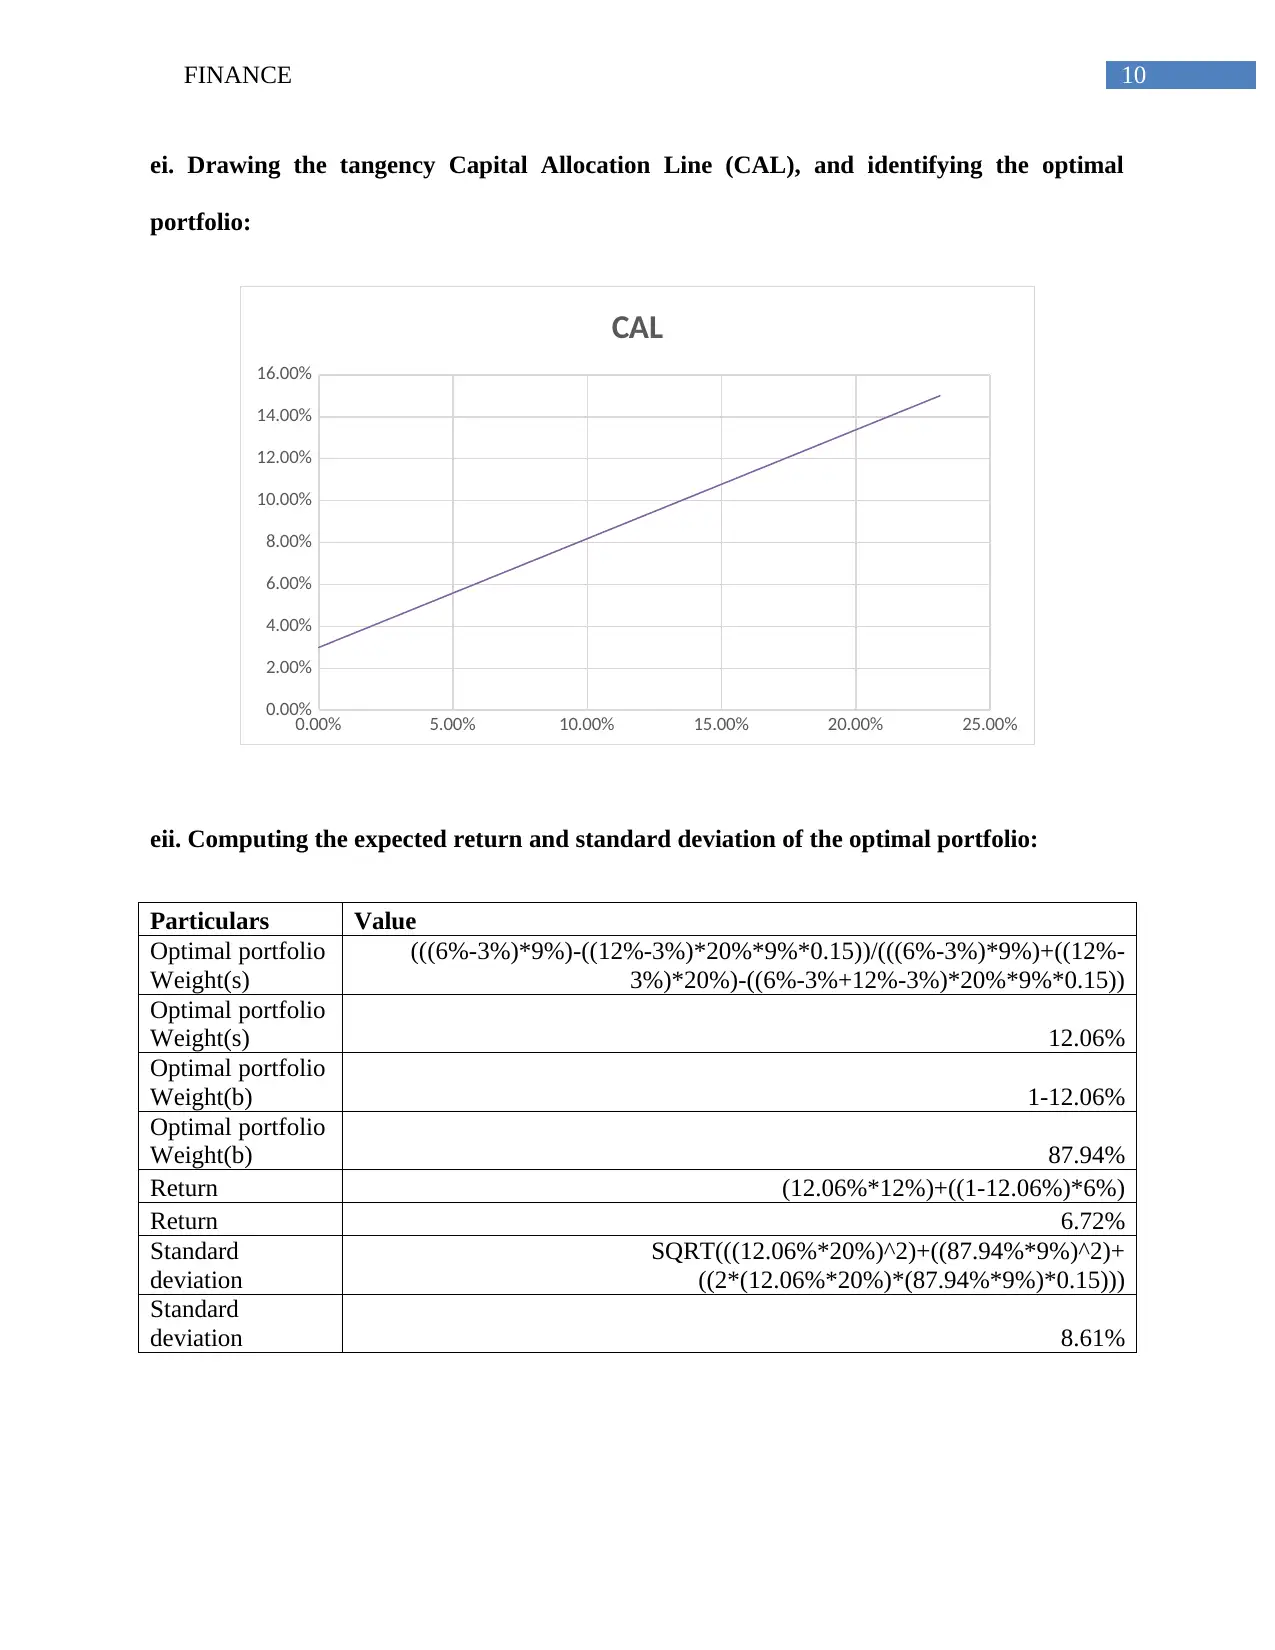
ei. Drawing the tangency Capital Allocation Line (CAL), and identifying the optimal
portfolio:
0.00% 5.00% 10.00% 15.00% 20.00% 25.00%
0.00%
2.00%
4.00%
6.00%
8.00%
10.00%
12.00%
14.00%
16.00%
CAL
eii. Computing the expected return and standard deviation of the optimal portfolio:
Particulars Value
Optimal portfolio
Weight(s)
(((6%-3%)*9%)-((12%-3%)*20%*9%*0.15))/(((6%-3%)*9%)+((12%-
3%)*20%)-((6%-3%+12%-3%)*20%*9%*0.15))
Optimal portfolio
Weight(s) 12.06%
Optimal portfolio
Weight(b) 1-12.06%
Optimal portfolio
Weight(b) 87.94%
Return (12.06%*12%)+((1-12.06%)*6%)
Return 6.72%
Standard
deviation
SQRT(((12.06%*20%)^2)+((87.94%*9%)^2)+
((2*(12.06%*20%)*(87.94%*9%)*0.15)))
Standard
deviation 8.61%
11FINANCE
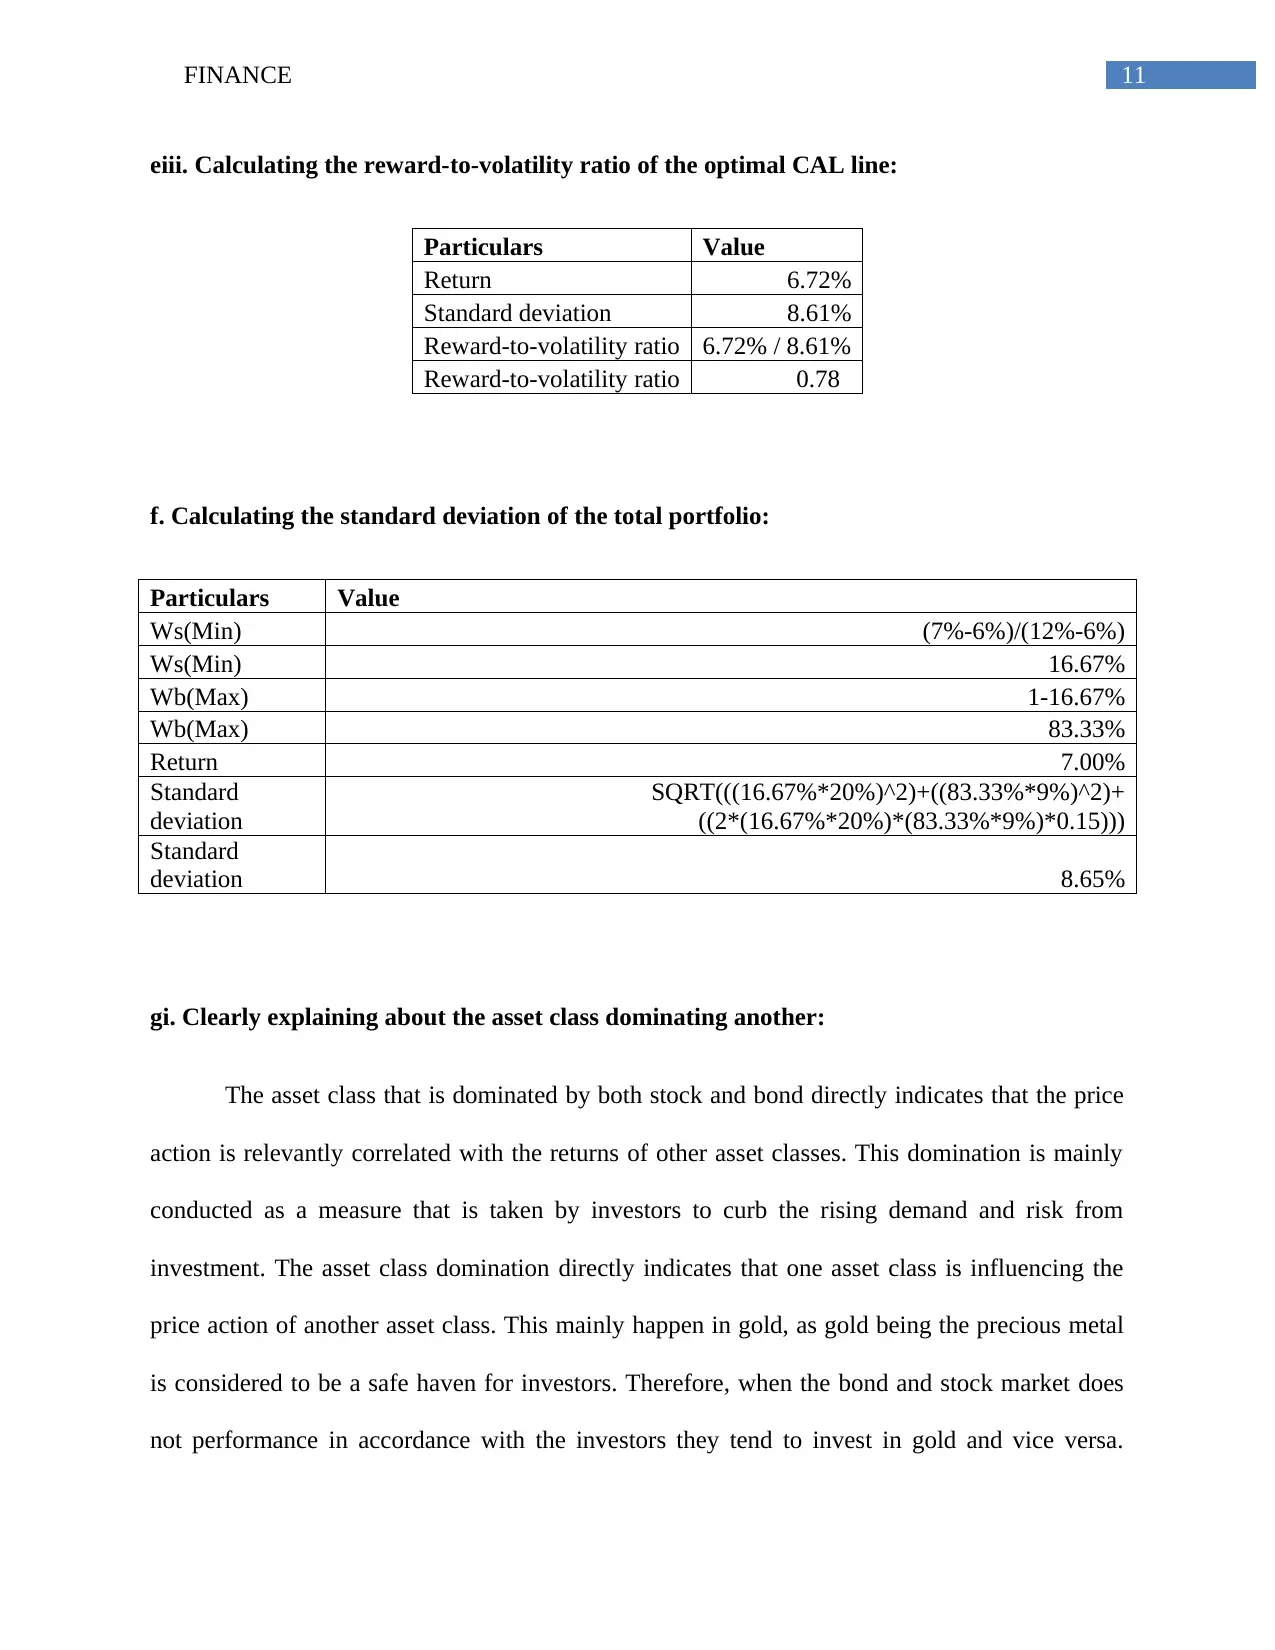
eiii. Calculating the reward-to-volatility ratio of the optimal CAL line:
Particulars Value
Return 6.72%
Standard deviation 8.61%
Reward-to-volatility ratio 6.72% / 8.61%
Reward-to-volatility ratio 0.78
f. Calculating the standard deviation of the total portfolio:
Particulars Value
Ws(Min) (7%-6%)/(12%-6%)
Ws(Min) 16.67%
Wb(Max) 1-16.67%
Wb(Max) 83.33%
Return 7.00%
Standard
deviation
SQRT(((16.67%*20%)^2)+((83.33%*9%)^2)+
((2*(16.67%*20%)*(83.33%*9%)*0.15)))
Standard
deviation 8.65%
gi. Clearly explaining about the asset class dominating another:
The asset class that is dominated by both stock and bond directly indicates that the price
action is relevantly correlated with the returns of other asset classes. This domination is mainly
conducted as a measure that is taken by investors to curb the rising demand and risk from
investment. The asset class domination directly indicates that one asset class is influencing the
price action of another asset class. This mainly happen in gold, as gold being the precious metal
is considered to be a safe haven for investors. Therefore, when the bond and stock market does
not performance in accordance with the investors they tend to invest in gold and vice versa.
⊘ This is a preview!⊘
Do you want full access?
Subscribe today to unlock all pages.
Trusted by 1+ million students worldwide
1 out of 15
Related Documents


Your All-in-One AI-Powered Toolkit for Academic Success.
+13062052269
info@desklib.com
Available 24*7 on WhatsApp / Email
![[object Object]](/_next/static/media/star-bottom.7253800d.svg)
Unlock your academic potential
Copyright © 2020–2026 A2Z Services. All Rights Reserved. Developed and managed by ZUCOL.