Finance Portfolio Management: Stock Analysis, Investment Strategies

Verified

Added on  2023/03/17

|26
|4302
|39
Report
AI Summary
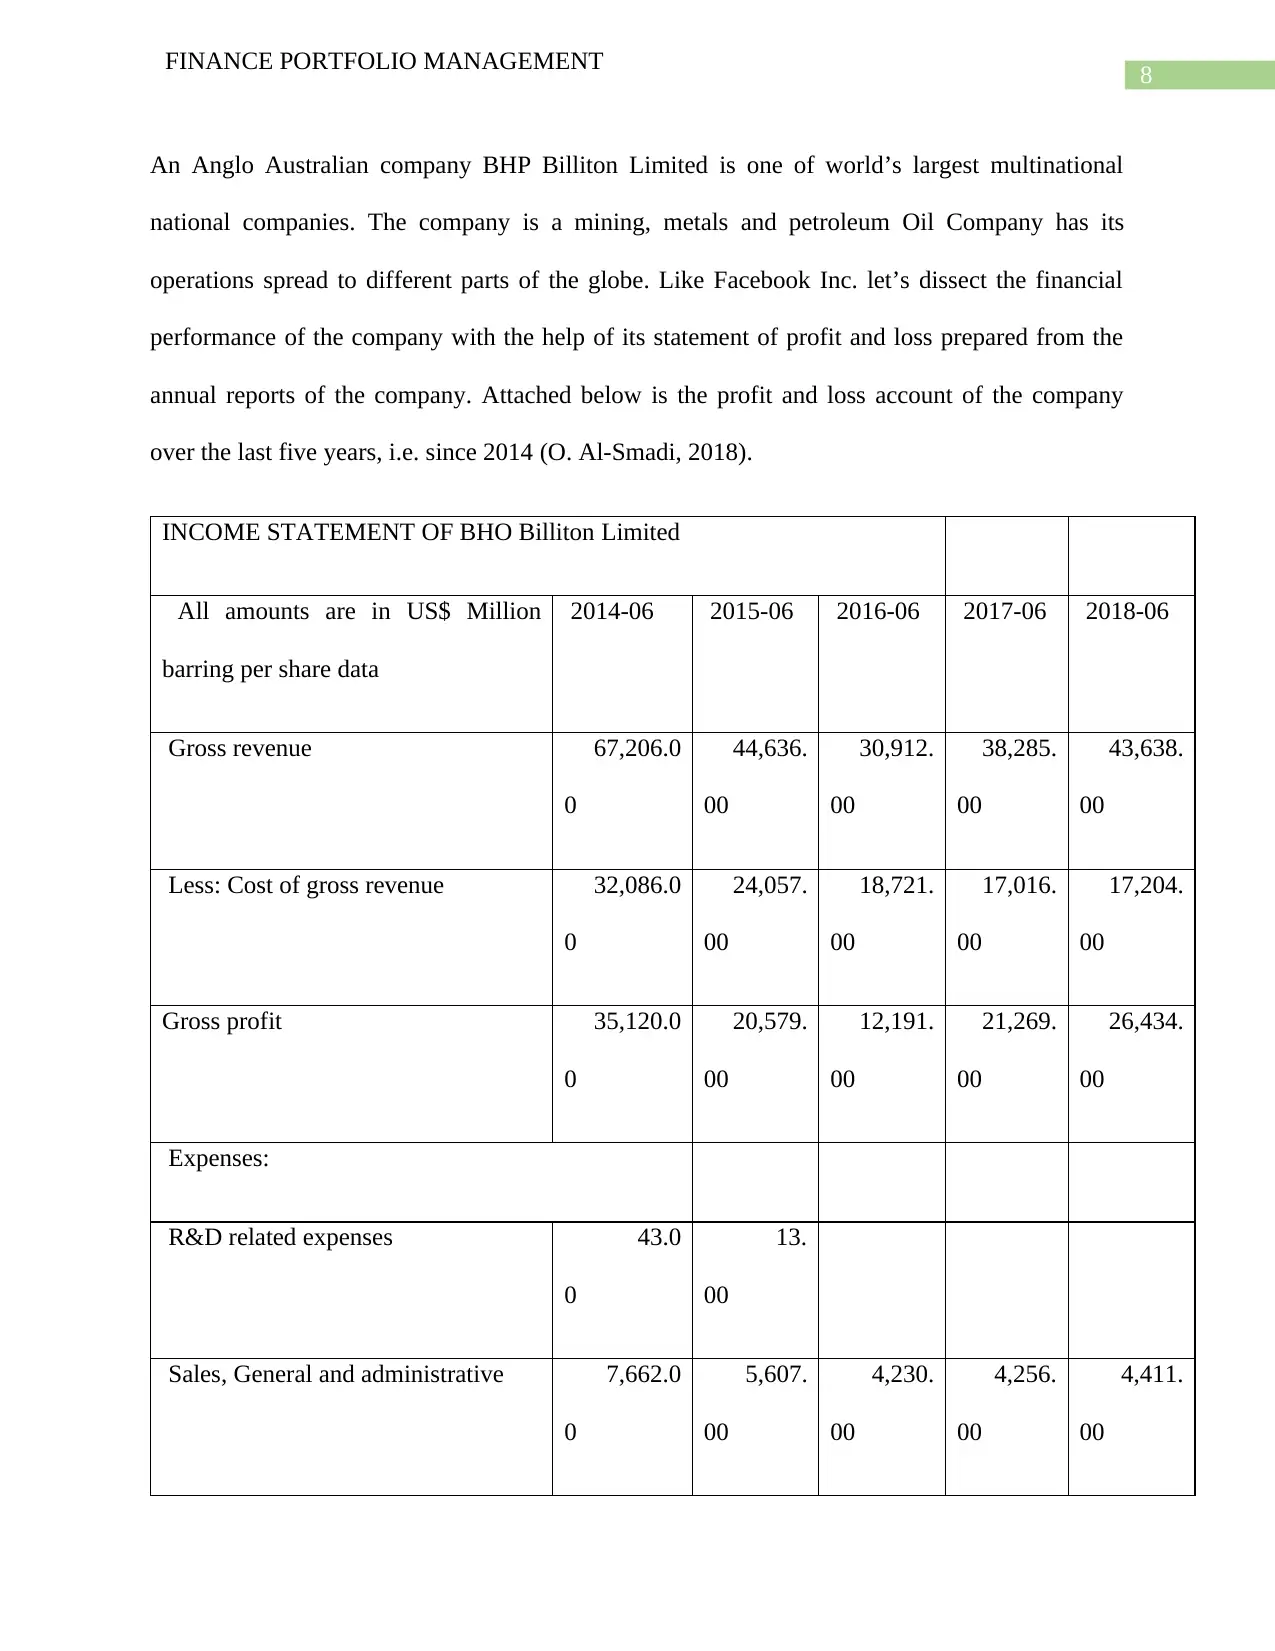
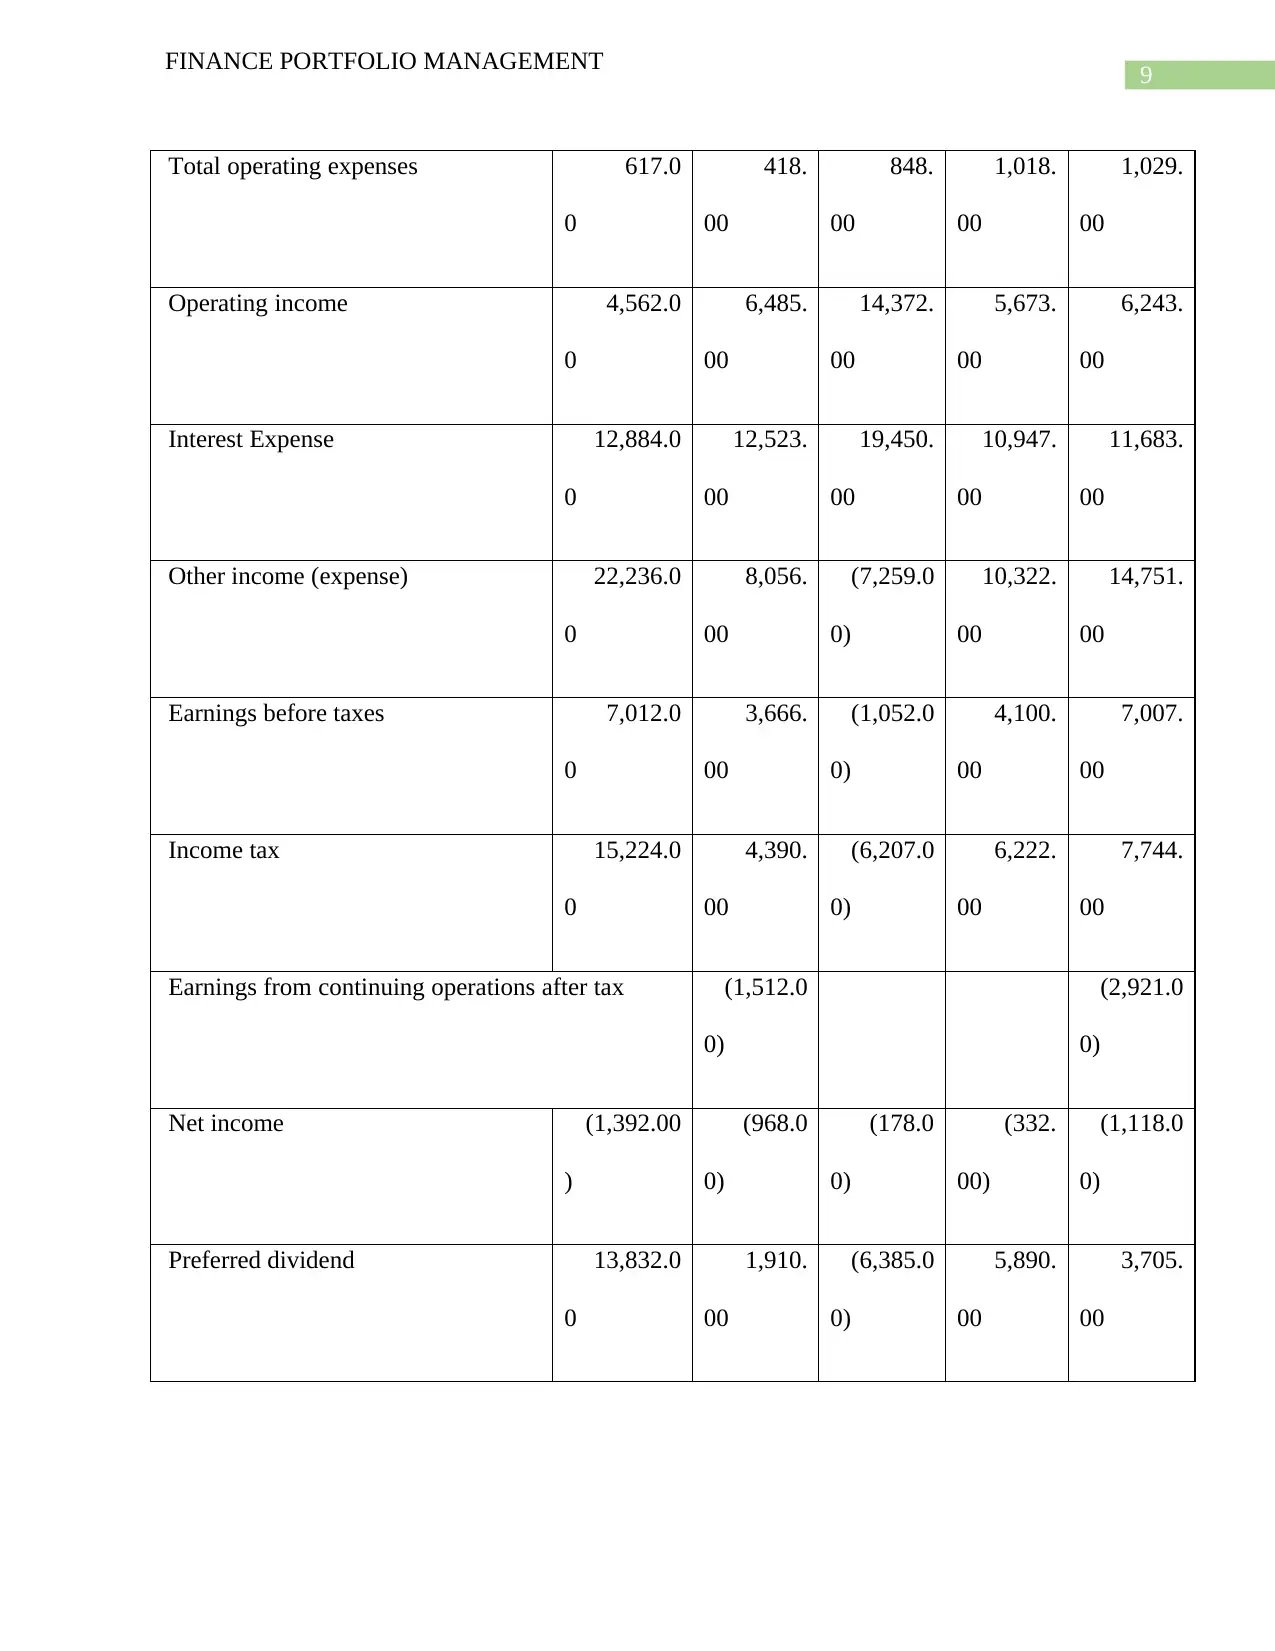
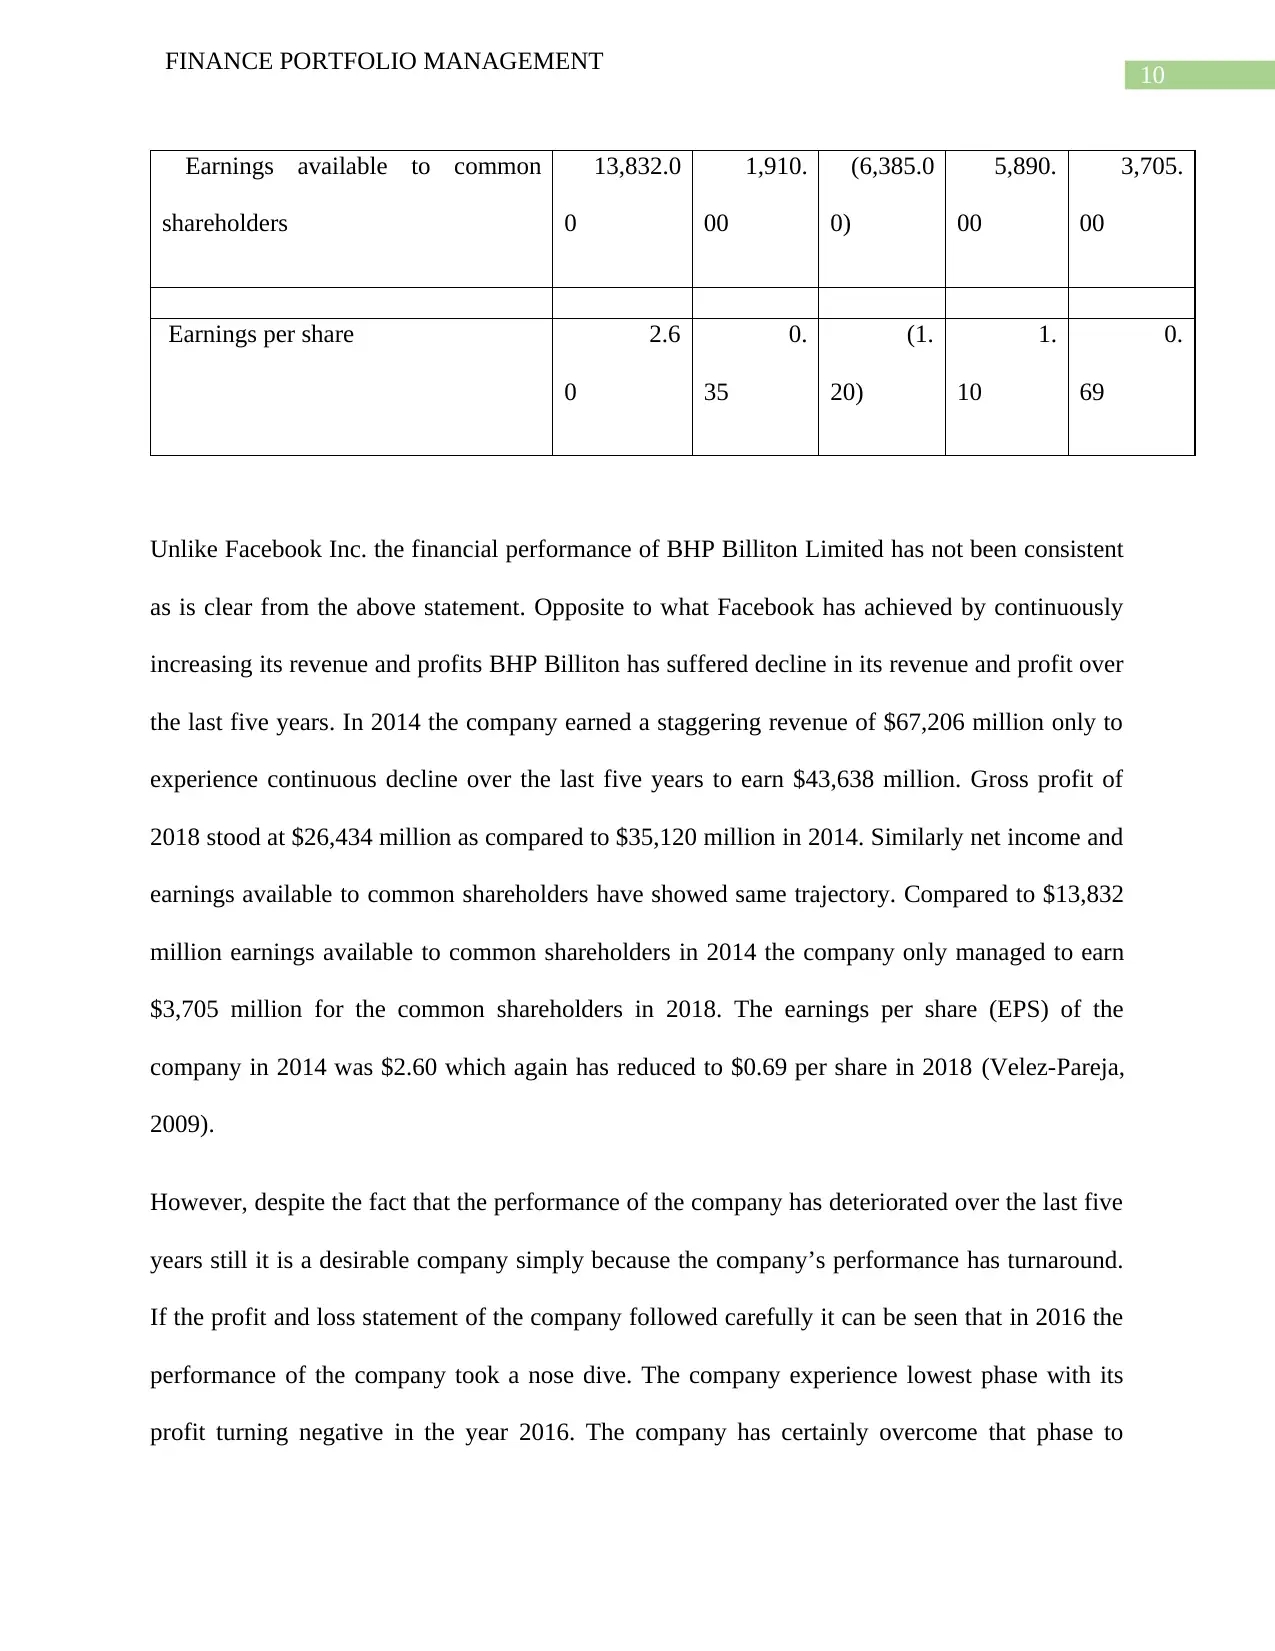
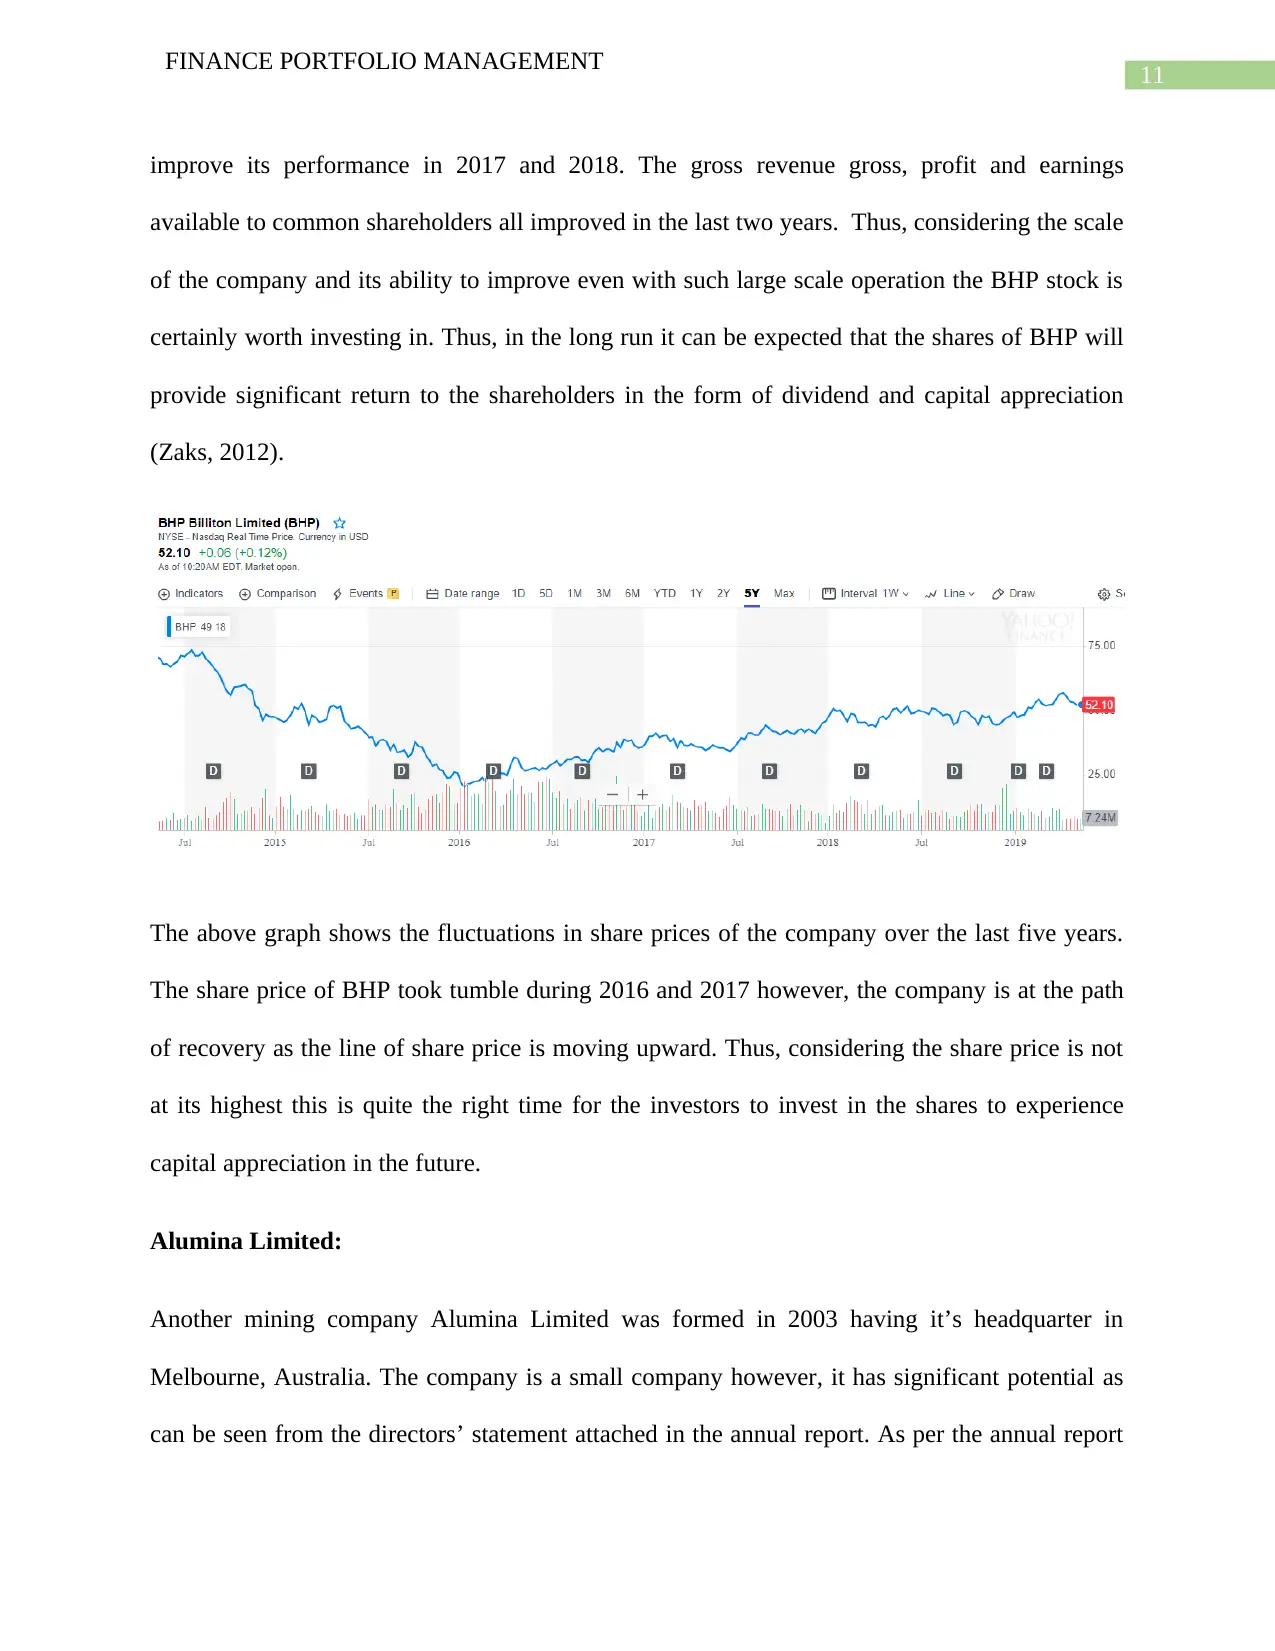
This report focuses on finance portfolio management, aiming to develop a strong investment portfolio with an initial investment of $100,000. It explores the complexities of portfolio management, emphasizing the importance of maximizing returns while minimizing risk. The research involves detailed analysis of financial statements, including profit and loss statements and stock price trends, of companies like Facebook Inc., BHP Billiton Limited, and Alumina Limited. The analysis covers key financial metrics such as revenue, gross profit, net income, and earnings per share to assess the companies' performance over the past five years. The report evaluates the desirability of including these stocks in the portfolio based on their financial health and growth potential, considering factors like consistent improvement in financial performance, market capitalization and dividend yields. It also includes a quarterly investment report, concluding with investment recommendations based on the research.
Document Page
Running head: FINANCE PORTFOLIO MANAGEMENT
Finance Portfolio Management
Name of the Student:
Name of the University:
Authors Note:
tabler-icon-diamond-filled.svg

Secure Best Marks with AI Grader

Need help grading? Try our AI Grader for instant feedback on your assignments.
Document Page
1
FINANCE PORTFOLIO MANAGEMENT
Abstract:
Portfolio management is the process of managing one’s investment with the objective of
providing maximum amount of return on a given rate of risk. Returns in the form of interest,
dividend and capital appreciation are the main concerns of investors looking to invest funds on
shares, debentures, mutual funds or other such investment options. The document shows number
of different stocks that are expected to provide positive returns to the investors over a long period
of time. Investment in these shares are will make a strong portfolio for any investors provided
there is no unexpected turn of incidents deteriorating the performances of these stocks.
Document Page
2
FINANCE PORTFOLIO MANAGEMENT
Contents
Abstract:...........................................................................................................................................1
Introduction:....................................................................................................................................3
Research:..........................................................................................................................................3
Quarterly Investment report:..........................................................................................................18
Conclusion:....................................................................................................................................23
References:....................................................................................................................................24
Document Page
3
FINANCE PORTFOLIO MANAGEMENT
Introduction:
Portfolio management is an extremely complex task with lucrative benefits to the ones
who have mastered the art of portfolio management to provide the investors best possible options
to invest with the objective of earning significant return on the amount of investment. Finding
out different stocks to develop a strong investment portfolio is the main purpose of preparing this
document. With $100,000 in hand a strong portfolio shall be developed to maximize the amount
of return on such funds with minimum amount of risk. A detailed discussion on different stocks,
futures and options shall be made to ensure that the final portfolio is extremely strong from the
point of view of investors.
Research:
As mentioned earlier that the investors look for investment options that provide regular
return to the investors in the form of dividend, interest, capital appreciation or any other forms.
The financial statements are the most crucial source of information about any company and its
performance (Habib and Hasan, 2019). The statement of profit and loss shall help the investors
or the portfolio management to assess the past performances of an organization on the basis of
which decision of investment in the company can be made. Apart from the statement of profit
and loss an entity also prepares statement of financial position as part of obligation to prepare
annual financial statements. Statement of financial position describes the financial state and
health of an entity (Kim and Im, 2017). Investors willing to invest for long term would obviously
look for a financially healthy company to invest in. Thus, using the financial statements is the
basic step in identifying the most desirable shares and stocks to include in the overall portfolio of
an investor. Apart from that the stock exchanges where the shares of large corporations are listed
also provide regular share price updates for the investors to follow the fortune of different
tabler-icon-diamond-filled.svg

Secure Best Marks with AI Grader

Need help grading? Try our AI Grader for instant feedback on your assignments.
Document Page
4
FINANCE PORTFOLIO MANAGEMENT
companies. Use of the share price information from stock exchange also helps in developing
portfolio. However in the long run the investors and portfolio manager would be benefited if the
decision of investment is taken by assessing the financial performance and position of an
organization from the financial statements of the organization (Knill, 2010).
Facebook Inc.:
Facebook Inc. is a multinational information technology company with its registered head office
situated in the United States of America. One of the biggest companies in all across the globe
Facebook has over the years increased its market capitalization rapidly. Using the statement of
profit and loss of the company shall enable us to understand how the company has performed
over the last five years. In order to determine whether to include the stock of Facebook in the
portfolio the analysis of financial performance of the company over the years is extremely
crucial. Below is the attached profit and loss statement of the company prepared from the annual
reports of the company over the last five years (Kraft and Schwartz, 2014).
INCOME STATEMENT OF FACEBOOK INC
All amounts are in US$ Million
barring per share data
2014-12 2015-12 2016-12 2017-12 2018-12
Gross revenue 12,466.
00
17,928.
00
27,638.
00
40,653.
00
55,838.
00
Less: Cost of gross revenue 2,153.
00
2,867.
00
3,789.
00
5,454.
00
9,355.
00
Gross profit 10,313. 15,061. 23,849. 35,199. 46,483.
Document Page
5
FINANCE PORTFOLIO MANAGEMENT
00 00 00 00 00
Expenses:
R&D related expenses 2,666.
00
4,816.
00
5,919.
00
7,754.
00
10,273.
00
Sales, General and administrative 2,653.
00
4,020.
00
5,503.
00
7,242.
00
11,297.
00
Total operating expenses 5,319.
00
8,836.
00
11,422.
00
14,996.
00
21,570.
00
Operating income 4,994.
00
6,225.
00
12,427.
00
20,203.
00
24,913.
00
Interest Expense 23
.00
23
.00
10
.00
6
.00
9
.00
Other income (expense) (61.
00)
(8.
00)
101
.00
397
.00
457
.00
Earnings before taxes 4,910.
00
6,194.
00
12,518.
00
20,594.
00
25,361.
00
Income tax 1,970.
00
2,506.
00
2,301.
00
4,660.
00
3,249.
00
Document Page
6
FINANCE PORTFOLIO MANAGEMENT
Earnings from continuing operations
after tax
2,940.
00
3,688.
00
10,217.
00
15,934.
00
22,112.
00
Net income 2,940.
00
3,688.
00
10,217.
00
15,934.
00
22,112.
00
Preferred dividend 15
.00
19
.00
29
.00
14
.00
1
.00
Earnings available to common
shareholders
2,925.
00
3,669.
00
10,188.
00
15,920.
00
22,111.
00
Basic EPS 1
.12
1
.31
3
.56
5
.49
7
.65
Increase in EPS 0
.19
2
.25
1
.93
2
.16
The profit and loss statement of Facebook Inc. from 2014 to 2018 shows the huge improvement
in the financial performance of the company over the last five years. In 2014 the company earned
a gross revenue of $12,466 million revenue from its business operations which increased to
almost five times within four years period. In 2018 the company earned a staggering 55,838
million thus, registering an increase of $43,372 million within 4 years’ time. Gross profit of the
company in 2018 has increased to $46,483 million from $10,313 million of 2014. Net income of
the company has also followed the same trajectory with net income of $2,940 in 2014 has almost
tabler-icon-diamond-filled.svg

Paraphrase This Document

Need a fresh take? Get an instant paraphrase of this document with our AI Paraphraser
Document Page
7
FINANCE PORTFOLIO MANAGEMENT
increased by 9 times to stand at $22,112 million in 2018 (Natividad, 2013). It is only natural that
such extra-ordinary performance will see a huge jump in the earnings per share of the company.
Basic earnings per share of the company for 2014 was $1.12 has increased to $7.65 in 2018. The
biggest plus point for the company has been its consistent improvement in every aspects of
business operations. Each year since 2014 as can be seen from the above profit and loss
statement of the company, the performance of the company has only improved. Whether it is the
amount of revenue or gross profit or net profit or EPS the improvement has been a constant
feature.
The performance of Facebook stock in the stock exchange over the last five years will further
help in assessing the desirability of including the stock in the overall portfolio. The screen shot
below shows the share price trend over the last five years.
It is clear from the graphical trend of the share prices of Facebook Inc. that the share price of the
company has increased continuously over the last five years.
BHP Billiton Limited:
Document Page
8
FINANCE PORTFOLIO MANAGEMENT
An Anglo Australian company BHP Billiton Limited is one of world’s largest multinational
national companies. The company is a mining, metals and petroleum Oil Company has its
operations spread to different parts of the globe. Like Facebook Inc. let’s dissect the financial
performance of the company with the help of its statement of profit and loss prepared from the
annual reports of the company. Attached below is the profit and loss account of the company
over the last five years, i.e. since 2014 (O. Al-Smadi, 2018).
INCOME STATEMENT OF BHO Billiton Limited
All amounts are in US$ Million
barring per share data
2014-06 2015-06 2016-06 2017-06 2018-06
Gross revenue 67,206.0
0
44,636.
00
30,912.
00
38,285.
00
43,638.
00
Less: Cost of gross revenue 32,086.0
0
24,057.
00
18,721.
00
17,016.
00
17,204.
00
Gross profit 35,120.0
0
20,579.
00
12,191.
00
21,269.
00
26,434.
00
Expenses:
R&D related expenses 43.0
0
13.
00
Sales, General and administrative 7,662.0
0
5,607.
00
4,230.
00
4,256.
00
4,411.
00
Document Page
9
FINANCE PORTFOLIO MANAGEMENT
Total operating expenses 617.0
0
418.
00
848.
00
1,018.
00
1,029.
00
Operating income 4,562.0
0
6,485.
00
14,372.
00
5,673.
00
6,243.
00
Interest Expense 12,884.0
0
12,523.
00
19,450.
00
10,947.
00
11,683.
00
Other income (expense) 22,236.0
0
8,056.
00
(7,259.0
0)
10,322.
00
14,751.
00
Earnings before taxes 7,012.0
0
3,666.
00
(1,052.0
0)
4,100.
00
7,007.
00
Income tax 15,224.0
0
4,390.
00
(6,207.0
0)
6,222.
00
7,744.
00
Earnings from continuing operations after tax (1,512.0
0)
(2,921.0
0)
Net income (1,392.00
)
(968.0
0)
(178.0
0)
(332.
00)
(1,118.0
0)
Preferred dividend 13,832.0
0
1,910.
00
(6,385.0
0)
5,890.
00
3,705.
00
tabler-icon-diamond-filled.svg

Secure Best Marks with AI Grader

Need help grading? Try our AI Grader for instant feedback on your assignments.
Document Page
10
FINANCE PORTFOLIO MANAGEMENT
Earnings available to common
shareholders
13,832.0
0
1,910.
00
(6,385.0
0)
5,890.
00
3,705.
00
Earnings per share 2.6
0
0.
35
(1.
20)
1.
10
0.
69
Unlike Facebook Inc. the financial performance of BHP Billiton Limited has not been consistent
as is clear from the above statement. Opposite to what Facebook has achieved by continuously
increasing its revenue and profits BHP Billiton has suffered decline in its revenue and profit over
the last five years. In 2014 the company earned a staggering revenue of $67,206 million only to
experience continuous decline over the last five years to earn $43,638 million. Gross profit of
2018 stood at $26,434 million as compared to $35,120 million in 2014. Similarly net income and
earnings available to common shareholders have showed same trajectory. Compared to $13,832
million earnings available to common shareholders in 2014 the company only managed to earn
$3,705 million for the common shareholders in 2018. The earnings per share (EPS) of the
company in 2014 was $2.60 which again has reduced to $0.69 per share in 2018 (Velez-Pareja,
2009).
However, despite the fact that the performance of the company has deteriorated over the last five
years still it is a desirable company simply because the company’s performance has turnaround.
If the profit and loss statement of the company followed carefully it can be seen that in 2016 the
performance of the company took a nose dive. The company experience lowest phase with its
profit turning negative in the year 2016. The company has certainly overcome that phase to
Document Page
11
FINANCE PORTFOLIO MANAGEMENT
improve its performance in 2017 and 2018. The gross revenue gross, profit and earnings
available to common shareholders all improved in the last two years. Thus, considering the scale
of the company and its ability to improve even with such large scale operation the BHP stock is
certainly worth investing in. Thus, in the long run it can be expected that the shares of BHP will
provide significant return to the shareholders in the form of dividend and capital appreciation
(Zaks, 2012).
The above graph shows the fluctuations in share prices of the company over the last five years.
The share price of BHP took tumble during 2016 and 2017 however, the company is at the path
of recovery as the line of share price is moving upward. Thus, considering the share price is not
at its highest this is quite the right time for the investors to invest in the shares to experience
capital appreciation in the future.
Alumina Limited:
Another mining company Alumina Limited was formed in 2003 having it’s headquarter in
Melbourne, Australia. The company is a small company however, it has significant potential as
can be seen from the directors’ statement attached in the annual report. As per the annual report
Document Page
12
FINANCE PORTFOLIO MANAGEMENT
of the company the directors have said that within next few years the company wil be able to
double its earnings from business operations. The attached profit and loss statement for the last
five years below shall give us fair idea about the financial performance of the company to justify
the decision of investing in the shares of the company.
INCOME STATEMENT OF ALLUMINA LIMITED
All amounts are in US$ Million barring per
share data
2014-12 2015-
12
2016-
12
2017-12 2018-12
Gross revenue -
- 1.00
1.00 2.00
Less: Cost of gross revenue -
- 1.00
1.00 2.00
Gross profit
Sales, General and administrative 16.00 16.
00
3
6.00
17.00 16.00
Interest expense 17.00 9.
00
1
3.00
11.00 9.00
Other operating expenses 86.00 (146.0
0)
(6
.00)
(463.00) (924.00)
Total costs and expenses 119.00 (121.0 4 (435.00) (898.00)
tabler-icon-diamond-filled.svg

Paraphrase This Document

Need a fresh take? Get an instant paraphrase of this document with our AI Paraphraser
Document Page
13
FINANCE PORTFOLIO MANAGEMENT
0) 3.00
Income before income taxes (119.00) 121.
00
(42.
00)
436.00 900.00
Provision for income taxes 1.00
Other income -
Net earnings from continuing operations (120.00) 121.
00
(42.
00)
436.00 900.00
Net earnings (120.00) 121.
00
(42.
00)
436.00 900.00
Earnings available to common shareholders (120.00) 121.
00
(42.
00)
436.00 900.00
Earnings per share (0.04
)
0.
04
(0
.01)
0.15 0.31
It can be seen from the above profit and loss account of the company that each year since 2014
the financial performance of the company has improved. Net earnings from continuing business
operations of the company and net income before taxes were negative in 2014 and 2016 which
have increased significantly in 2017 and 2018. Compared to negative net income of $119 million
in 2014 has turnaround completely in 2017 and 2018. In 2017 the company has earned positive
Document Page
14
FINANCE PORTFOLIO MANAGEMENT
net income of $436 million and $900 million in 2018. Similarly the earnings per share of the
company has improved over the years to currently stand at $0.31 in 2018.
The share price trends of Alumina Limited can be understood from the following graph.
Again the share of Alumina Limited has seen number of declines during 2016 and 2017 only to
recover in 2018.
Chorus Limited:
Chorus Limited is engaged in providing communication services in Australia and New Zealand.
Over the years the company’ has expanded its operations as a result it is with low share price a
suitable option to invest in the shares of the company. The attached profit and loss statement of
the company shall highlight the attractiveness of the company to be part of the overall portfolio.
INCOME STATEMENT OF CHORUS LTD
All amounts are in NZ$ Million barring per
share data
2014-
06
2015-
06
2016-
06
2017-
06
2018-
06
Gross revenue 96 99 1,002. 1,031. 98
Document Page
15
FINANCE PORTFOLIO MANAGEMENT
8.00 8.00 00 00 3.00
Gross profit 96
8.00
99
8.00
1,002.
00
1,031.
00
98
3.00
Sales, General and administrative 9
1.00
8
7.00
94
.00
91
.00
8
2.00
Other expenses 64
3.00
64
1.00
647.
00
609.
00
64
2.00
Total operating expenses 73
4.00
72
8.00
741.
00
700.
00
72
4.00
Operating income 23
4.00
27
0.00
261.
00
331.
00
25
9.00
Interest Expense 12
9.00
15
9.00
147.
00
164.
00
15
1.00
Other income (expense) 10
1.00
1
6.00
13
.00
(8
.00)
1
4.00
Earnings before taxes 20
6.00
12
7.00
127.
00
159.
00
12
2.00
tax 5 3 36 46 3
tabler-icon-diamond-filled.svg

Secure Best Marks with AI Grader

Need help grading? Try our AI Grader for instant feedback on your assignments.
Document Page
16
FINANCE PORTFOLIO MANAGEMENT
8.00 6.00 .00 .00 7.00
Net earninsg from continuing operations after
tax
14
8.00
9
1.00
91
.00
113.
00
8
5.00
Net income 14
8.00
9
1.00
91
.00
113.
00
8
5.00
Earnings available to common shareholders 14
8.00
9
1.00
91
.00
113.
00
8
5.00
Earnings per share
0.38 0.23
0
.23
0
.28 0.20
Each year since 2014 to 2017 the financial performance of the company has improved
significantly. In 2017 the gross revenue earned by the company was NZ $1,031 million as
compared to NZ $968 million in 2014. Though in 2018 the revenue of the company has
decreased a bit but the company’s financial performance certainly attracts the investors to invest
in the shares of the company especially considering the low share price of the company. Net
earnings available to the common shareholders of the company in 2015 was NZ $91 million.
This has increased to NZ $113 million in 2017. Thus, the company despite operating within the
regional limits of Australia and New Zealand has improved its financial performance
significantly over the years. With its share price quite low the company provides lucrative
opportunity for the investors to invest in the shares of the company. The graph below shows the
fluctuation in the share prices of the company over the last five years (Natividad, 2013).
Document Page
17
FINANCE PORTFOLIO MANAGEMENT
The above graph shows how the share prices of the company has improved over the last five
years. The share price of the company has showed steep but steady rise over a long period of
time. Thus, in the long run investors can expect significant capital appreciation in the value of
the shares. Hence, as a small company Chorus Limited is an attractive investment option to be
included in the portfolio of the investor.
Quarterly Investment report:
Memorandum:
It has been decided that the investment shall be made on four companies’ shares, i.e. Facebook,
BHP, Alumina and Chorus in the ratio of 4:3:2:1. Accordingly as on the date of 1st December,
2017 the number of share purchased using the total fund of $100,000 in four different companies
is shown in the table below.
Companies Faceboo
k
BHP Alumina Chorus
Investment amount 40,000. 30,000. 20,000. 10,000.
Document Page
18
FINANCE PORTFOLIO MANAGEMENT
00 00 00 00
Brokerage @0.5% 200.
00
150.
00
100.
00
50.
00
Number of share purchased 228.
44
714.
97
3,016.
59
2,816.
90
Share price as on
01.12.2017
175.1 41.96 6.63 3.55
Individual stock performance- Quarterly report:
Chorus Limited
Per share value Capital appreciation / (depreciation) Return %
01.03.2018 3.52 (84.51) (0.85
)
01.06.2018 3.79 760.56 7.6
1
01.09.2018 4.26 1,323.94 13.2
4
01.12.2018 4.47 591.55 5.9
2
tabler-icon-diamond-filled.svg

Paraphrase This Document

Need a fresh take? Get an instant paraphrase of this document with our AI Paraphraser
Document Page
19
FINANCE PORTFOLIO MANAGEMENT
Alumina
Per share value Capital
appreciation /
(depreciation)
Return %
01.03.2018 7.00 1,116.14
5.58
01.06.2018 8.34 4,042.23 2
0.21
01.09.2018 8.34 -
-
01.12.2018 6.56 (5,369.53) (2
6.85)
BHP Billiton:
BHP Billiton
Per share value Capital
appreciation /
(depreciation)
Return
%
01.03.2018 48.30 4,532.89 15
Document Page
20
FINANCE PORTFOLIO MANAGEMENT
.11
01.06.2018 50.24 1,387.04 4
.62
01.09.2018 48.04 (1,572.93) (5
.24)
01.12.2018 44.36 (2,631.08) (8
.77)
Facebook:
Facebook
Per
share
value
Capital
appreciation /
(depreciation)
Return %
01.03.2018 176.
62
347.23
0.87
01.06.2018 193.
99
3,968.02
9.92
01.09.2018 175.
73
(4,171.33) (1
0.43)
Document Page
21
FINANCE PORTFOLIO MANAGEMENT
01.12.2018 140.
61
(8,022.84) (2
0.06)
Exercise option or futures:
By purchasing call and put option the holder of such option have the right and not obligation to
sell particular share at a particular price on or before the due date when the put option is
expiring. The call option gives the holder the right to purchase certain number of shares at a
predetermined price on or before the due date. The exercise option could have been used here as
the room for manipulation was significant with constant fluctuation in all four share prices have
been experienced during the period from 01.12.2017 to 01.12.2018.
Share trading:
The investor is not a trader to trade in shares the objective behind developing the portfolio is to
invest in the shares of attractive companies to earn return in the form of dividend and capital
appreciation in the long run (Kraft and Schwartz, 2014).
Portfolio performance:
Quarters Chorus Alumina BHP Facebook Total
01.03.2018 (0
.08)
1
.12
4
.53
0.
35 5.91
01.06.2018 0 4 1 3. 1
tabler-icon-diamond-filled.svg

Secure Best Marks with AI Grader

Need help grading? Try our AI Grader for instant feedback on your assignments.
Document Page
22
FINANCE PORTFOLIO MANAGEMENT
.76 .04 .39 97 0.16
01.09.2018 1
.32 -
(1
.57)
(4.
17)
(4
.42)
01.12.2018 0
.59
(5
.37)
(2
.63)
(8.
02)
(15
.43)
Net return on the portfolio (3
.78)
Readdress stock selection and stances in the market:
It is clearly seen in the above table that the investment portfolio has not given the desired results
as the portfolio return is in negative. Thus, readdress of stock selection is natural. Detailed
analysis of market movement of share prices shall be again carefully watched and suitable
companies’ stocks shall be selected to earn desired return from investment in the future. Stock
selection is a crucial part of investment portfolio management however, despite this there is no
guarantee of earning positive return on investment portfolio as the market forces are beyond the
control of individual investors.
Conclusion:
Taking into consideration the above discussion it is clear that the portfolio has not
performed as per the expectation of the portfolio management as the net return of the portfolio
has been in negative. Thus, reselection of stock is certainly the need of the hour. However it is
important to note that the portfolio management does not guarantee positive return as the market
Document Page
23
FINANCE PORTFOLIO MANAGEMENT
volatility is beyond the control of any one. However, the report makes it amply clear that there is
a standard procedure that needed to be followed in selecting suitable investment options in a
portfolio. But it’s still not a guarantee of providing good returns.
Document Page
24
FINANCE PORTFOLIO MANAGEMENT
References:
Habib, A. and Hasan, M. (2019). Business Strategy and Labor Investment
Efficiency. International Review of Finance, 2(5), pp.13-21.
Kim, J. and Im, C. (2017). Reported Profits And Effective Tax Rate Following Accounting
Standards Changes Analysis Of Consolidated Financial Statements And Separate Financial
Statements. Journal of Applied Business Research (JABR), 33(6), p.1171.
Knill, A. (2010). Does Foreign Portfolio Investment Reach Small Listed Firms?. European
Financial Management, 19(2), pp.251-303.
Kraft, H. and Schwartz, E. (2014). Cash Flow Multipliers and Optimal Investment
Decisions. European Financial Management, 21(3), pp.399-429.
Natividad, G. (2013). Multidivisional Strategy and Investment Returns. Journal of Economics &
Management Strategy, 22(3), pp.594-616.
O. Al-Smadi, M. (2018). Determinants of foreign portfolio investment: the case of
Jordan. Investment Management and Financial Innovations, 15(1), pp.328-336.
Velez-Pareja, I. (2009). Guidelines for Forecasting Financial Statements from Historical
Financial Statements for Valuation Purposes (Updated). SSRN Electronic Journal, 2(3), pp.12-
21.
Zaks, Y. (2012). Optimal Asset-Liability Management Investment Portfolio. SSRN Electronic
Journal, 2(3), pp.12-35.
tabler-icon-diamond-filled.svg

Paraphrase This Document

Need a fresh take? Get an instant paraphrase of this document with our AI Paraphraser
Document Page
25
FINANCE PORTFOLIO MANAGEMENT
chevron_up_icon
1 out of 26
circle_padding
hide_on_mobile
zoom_out_icon
logo.png

Your All-in-One AI-Powered Toolkit for Academic Success.

Available 24*7 on WhatsApp / Email

[object Object]