Corporate Finance Project Report: Portfolio Risk and Management

Verified

Added on  2023/06/04

|8
|1502
|248
Project
AI Summary
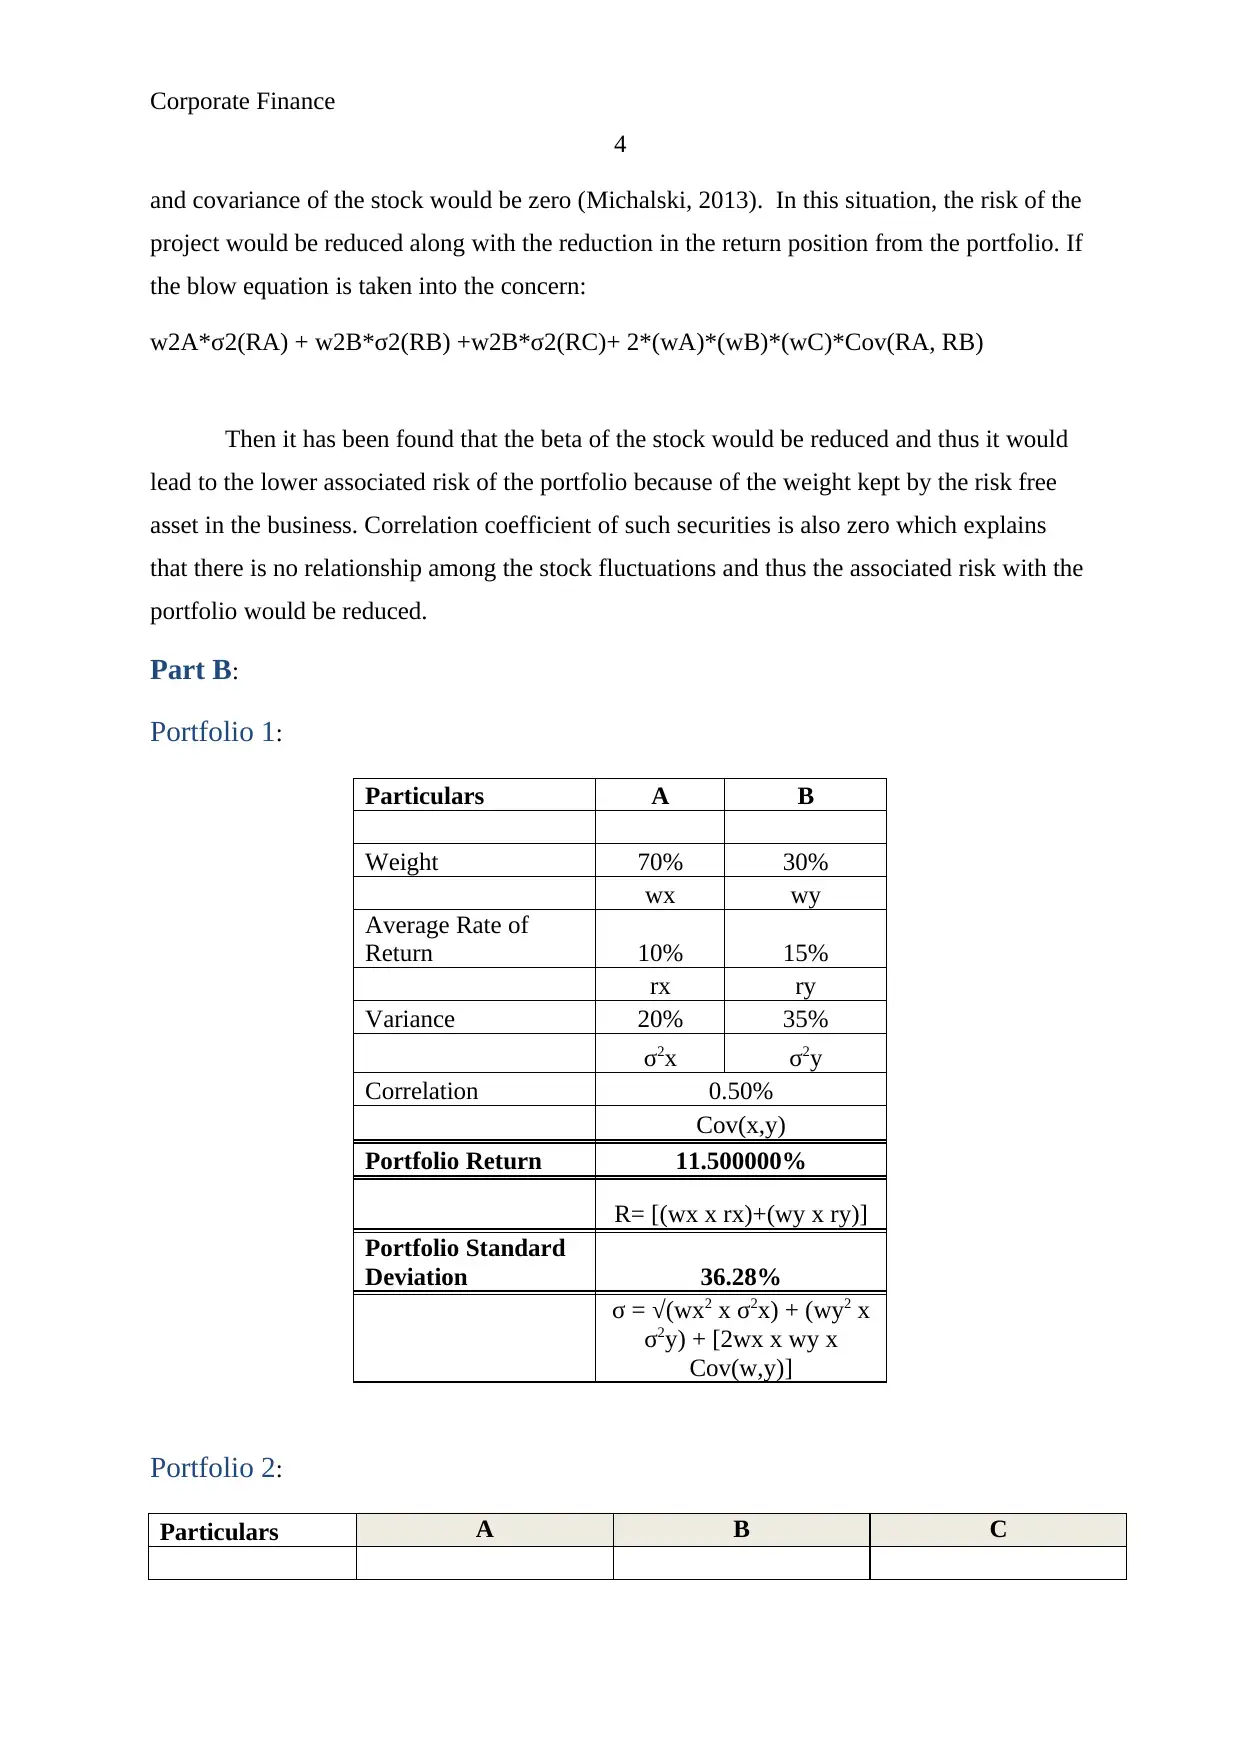
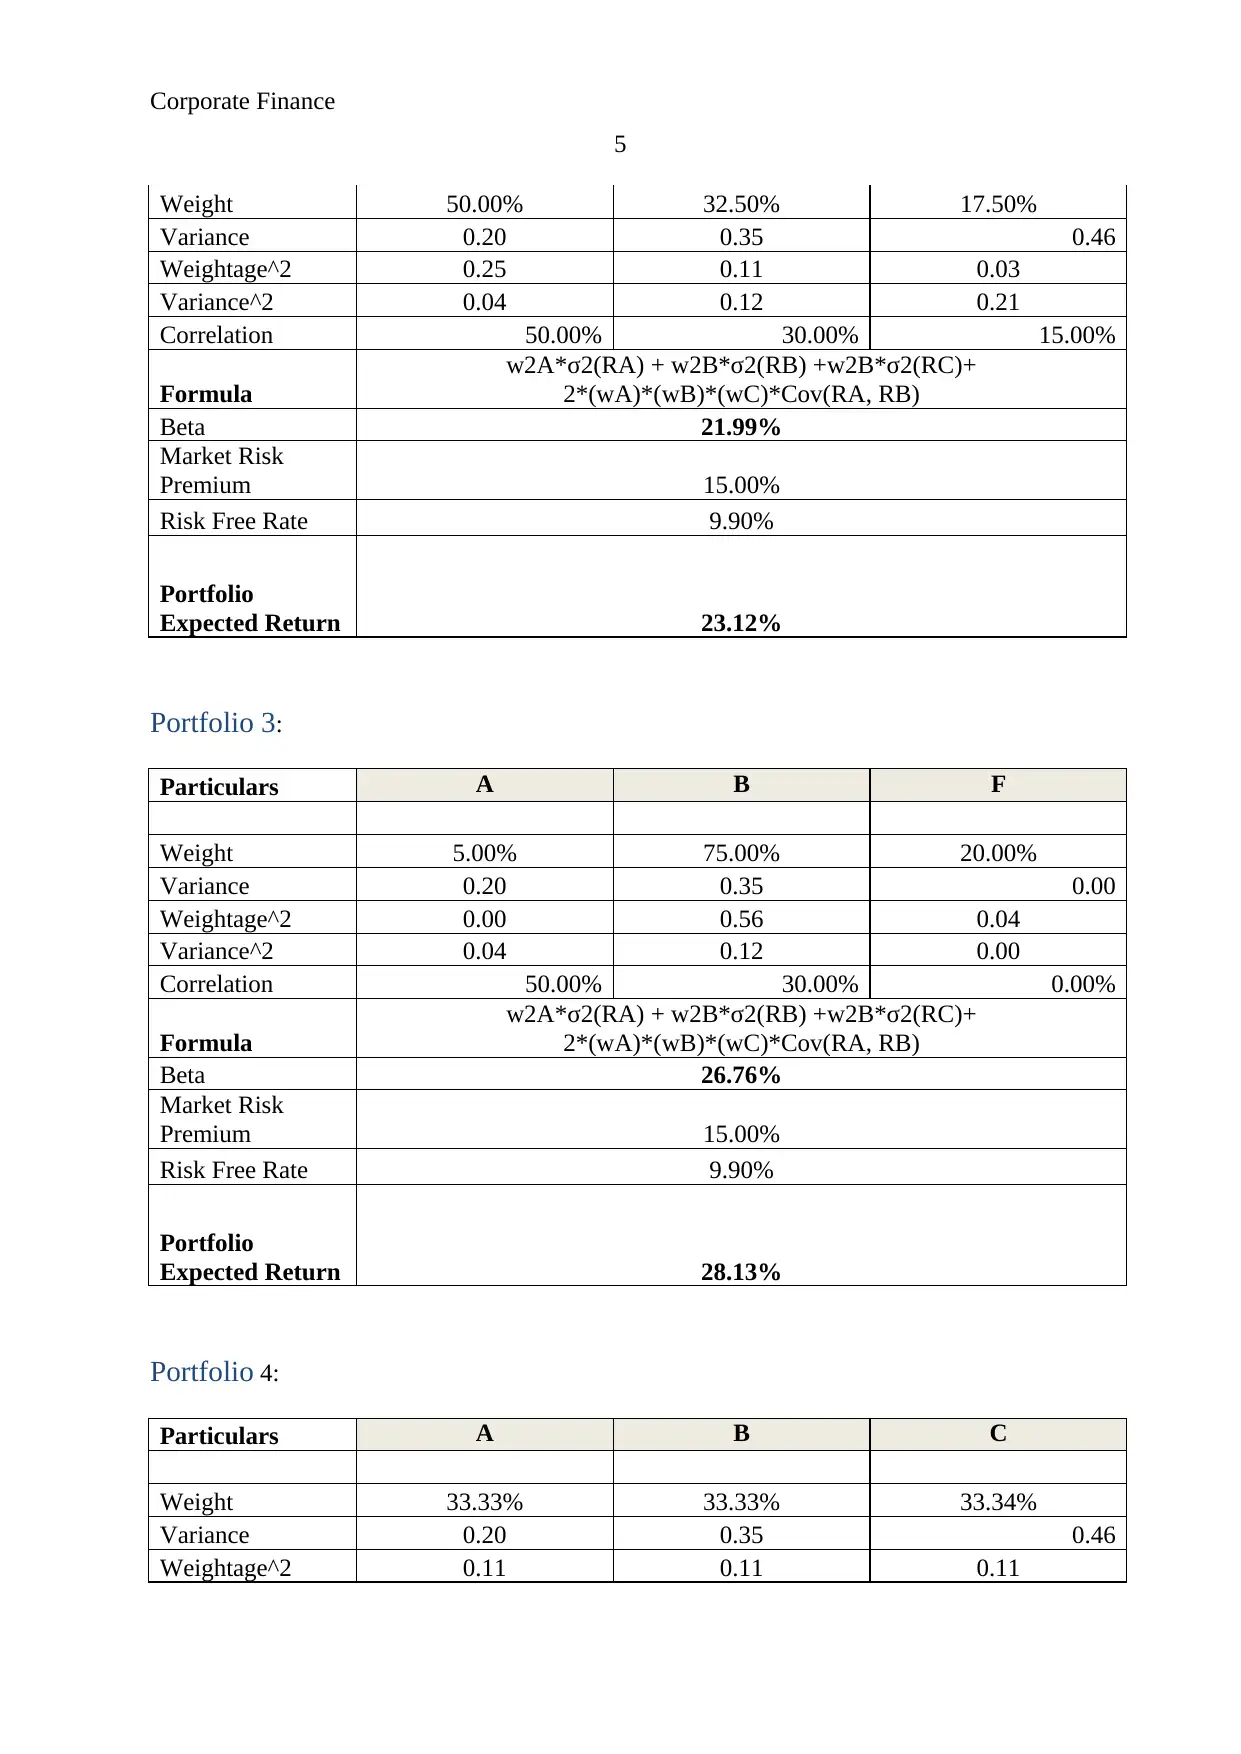
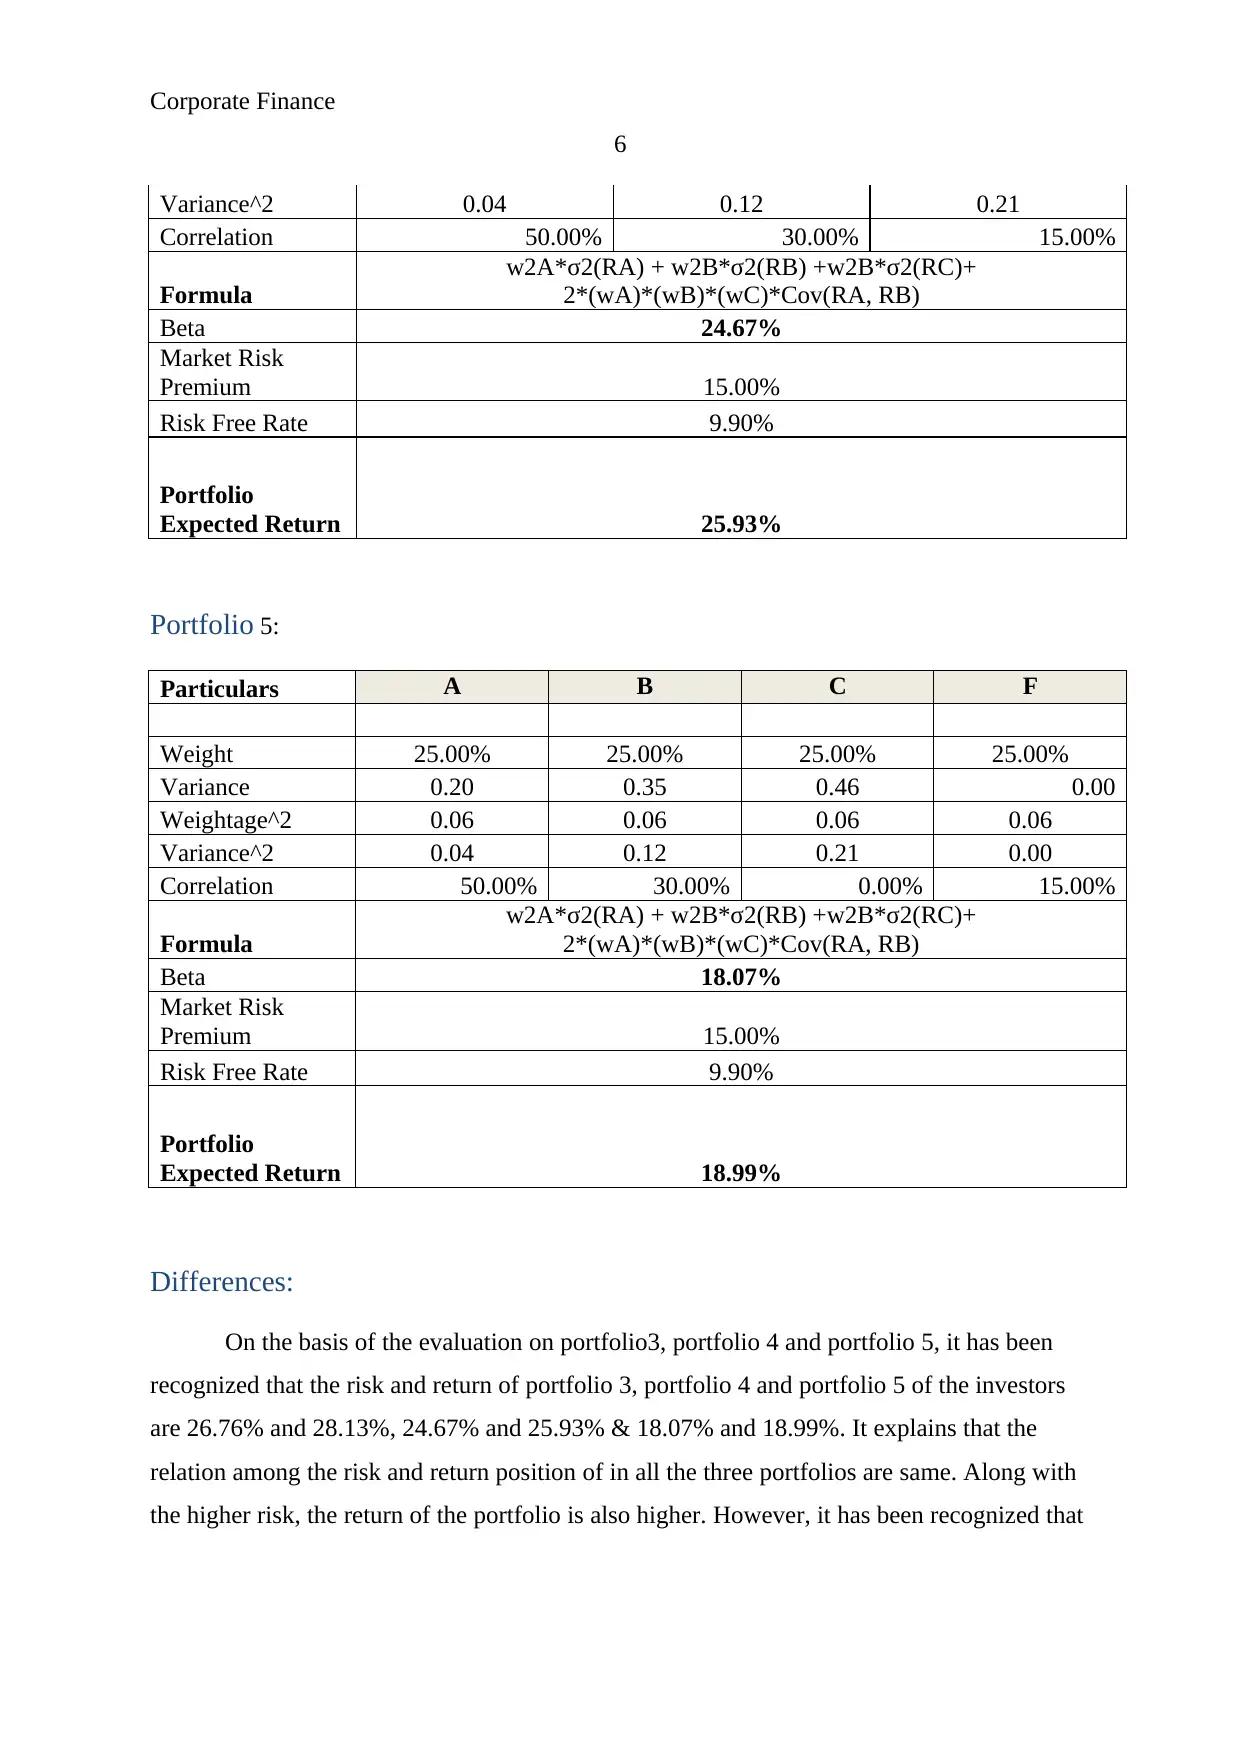
This corporate finance project report delves into the analysis of portfolio risk and return. Part A addresses key concepts such as standard deviation, risk reduction through portfolio diversification, and the impact of risk-free assets on portfolio risk. Part B presents five different portfolios with varying asset allocations, risk profiles, and expected returns. The analysis compares and contrasts the risk and return characteristics of portfolios 3, 4, and 5, highlighting the impact of risk-free assets and asset diversification on overall portfolio performance. The project employs standard deviation, correlation, and beta calculations to assess risk and return, providing insights into portfolio construction and risk management strategies.
Document Page
Running Head: Corporate Finance
1
Project Report: Corporate Finance
tabler-icon-diamond-filled.svg

Paraphrase This Document

Need a fresh take? Get an instant paraphrase of this document with our AI Paraphraser
Document Page
Corporate Finance
2
Contents
Part A................................................................................................................................3
Question 1.....................................................................................................................3
Question 2.....................................................................................................................3
Question 3.....................................................................................................................3
Part B................................................................................................................................4
Portfolio 1.....................................................................................................................4
Portfolio 2.....................................................................................................................4
Portfolio 3.....................................................................................................................5
Portfolio 4:....................................................................................................................5
Portfolio 5:....................................................................................................................6
Differences:...................................................................................................................6
References.........................................................................................................................8
Document Page
Corporate Finance
3
Part A:
Question 1:
Standard deviation is a measurement of the risk. It evaluates the changes in the stock
price of an organization and makes the decision about the long term performance of the
company. The standard deviation outcome is plotted on a graph by the analyst to identify the
changes and the performance of the stock of the company which is called “distribution
curve”. It makes it easier for the analyst to identify the changes in the stock price of the
business. Further, the normal distribution and the probability are also method t measure the
fluctuations in stock price in a statistical manner (Müller, Miia, and Tomas, 2008). The
normal distribution probability distributes the stock prices on the basis of the fluctuations and
makes it easier for the analyst to make better decision about the stock fluctuations and future
performance of the stock price of the company. The standard deviation analysis is tough for
individual investors but these statistical measurements make it easier for the investors to
identify the performance in near future.
Question 2:
According to the article of Simon Hoyle, it has been found that the risk s one of the
major aspect in an investment. It affects the return and the stock prices of the business rapidly
(Hoyle, 2006). If an extra stock is added by the analyst and the investors into the portfolio
than it would reduce the associated risk of the portfolio in context with the efficient portfolio
theory. An analyst make it sure that the new stock’s beta is different and the covariance level
of the stocks are also different so that the changes into both the stocks lead to the different
way and the associated risk of the stock and portfolio could be reduced (Zhu and Masao,
2009). In terms of correlation coefficient, if the correlation among the stock is less than 0
than the relationship among the stock are negative which explains that the fluctuation in both
the stock would be different and thus these securities are best in terms of preparing a portfolio
to reduce the risk level.
Question 3:
A portfolio risk is calculated by the business through applying the portfolio risk
formula which consist the risk associated with the stock, return from the stock and correlation
among the stock. If the risk free assets are added into the portfolio than the standard deviation
Document Page
Corporate Finance
4
and covariance of the stock would be zero (Michalski, 2013). In this situation, the risk of the
project would be reduced along with the reduction in the return position from the portfolio. If
the blow equation is taken into the concern:
w2A*σ2(RA) + w2B*σ2(RB) +w2B*σ2(RC)+ 2*(wA)*(wB)*(wC)*Cov(RA, RB)
Then it has been found that the beta of the stock would be reduced and thus it would
lead to the lower associated risk of the portfolio because of the weight kept by the risk free
asset in the business. Correlation coefficient of such securities is also zero which explains
that there is no relationship among the stock fluctuations and thus the associated risk with the
portfolio would be reduced.
Part B:
Portfolio 1:
Particulars A B
Weight 70% 30%
wx wy
Average Rate of
Return 10% 15%
rx ry
Variance 20% 35%
σ2x σ2y
Correlation 0.50%
Cov(x,y)
Portfolio Return 11.500000%
R= [(wx x rx)+(wy x ry)]
Portfolio Standard
Deviation 36.28%
σ = √(wx2 x σ2x) + (wy2 x
σ2y) + [2wx x wy x
Cov(w,y)]
Portfolio 2:
Particulars A B C
tabler-icon-diamond-filled.svg

Paraphrase This Document

Need a fresh take? Get an instant paraphrase of this document with our AI Paraphraser
Document Page
Corporate Finance
5
Weight 50.00% 32.50% 17.50%
Variance 0.20 0.35 0.46
Weightage^2 0.25 0.11 0.03
Variance^2 0.04 0.12 0.21
Correlation 50.00% 30.00% 15.00%
Formula
w2A*σ2(RA) + w2B*σ2(RB) +w2B*σ2(RC)+
2*(wA)*(wB)*(wC)*Cov(RA, RB)
Beta 21.99%
Market Risk
Premium 15.00%
Risk Free Rate 9.90%
Portfolio
Expected Return 23.12%
Portfolio 3:
Particulars A B F
Weight 5.00% 75.00% 20.00%
Variance 0.20 0.35 0.00
Weightage^2 0.00 0.56 0.04
Variance^2 0.04 0.12 0.00
Correlation 50.00% 30.00% 0.00%
Formula
w2A*σ2(RA) + w2B*σ2(RB) +w2B*σ2(RC)+
2*(wA)*(wB)*(wC)*Cov(RA, RB)
Beta 26.76%
Market Risk
Premium 15.00%
Risk Free Rate 9.90%
Portfolio
Expected Return 28.13%
Portfolio 4:
Particulars A B C
Weight 33.33% 33.33% 33.34%
Variance 0.20 0.35 0.46
Weightage^2 0.11 0.11 0.11
Document Page
Corporate Finance
6
Variance^2 0.04 0.12 0.21
Correlation 50.00% 30.00% 15.00%
Formula
w2A*σ2(RA) + w2B*σ2(RB) +w2B*σ2(RC)+
2*(wA)*(wB)*(wC)*Cov(RA, RB)
Beta 24.67%
Market Risk
Premium 15.00%
Risk Free Rate 9.90%
Portfolio
Expected Return 25.93%
Portfolio 5:
Particulars A B C F
Weight 25.00% 25.00% 25.00% 25.00%
Variance 0.20 0.35 0.46 0.00
Weightage^2 0.06 0.06 0.06 0.06
Variance^2 0.04 0.12 0.21 0.00
Correlation 50.00% 30.00% 0.00% 15.00%
Formula
w2A*σ2(RA) + w2B*σ2(RB) +w2B*σ2(RC)+
2*(wA)*(wB)*(wC)*Cov(RA, RB)
Beta 18.07%
Market Risk
Premium 15.00%
Risk Free Rate 9.90%
Portfolio
Expected Return 18.99%
Differences:
On the basis of the evaluation on portfolio3, portfolio 4 and portfolio 5, it has been
recognized that the risk and return of portfolio 3, portfolio 4 and portfolio 5 of the investors
are 26.76% and 28.13%, 24.67% and 25.93% & 18.07% and 18.99%. It explains that the
relation among the risk and return position of in all the three portfolios are same. Along with
the higher risk, the return of the portfolio is also higher. However, it has been recognized that
Document Page
Corporate Finance
7
in case of portfolio 3, the risk free assets is reducing the risk level though, the weight of risk
free asset is lower and thus the much impact have not been seen in the overall risk (, 2014).
Further, in case of portfolio 4, it has been found that the same weight has been given
to all the risky securities which lead to the reduced risk level because of the lower correlation
level among the securities. Further, the portfolio 5 leads to the conclusion that the same
weight has been assigned to each of the security along with the risk free asset is depicting
lower risk in the market.
tabler-icon-diamond-filled.svg

Paraphrase This Document

Need a fresh take? Get an instant paraphrase of this document with our AI Paraphraser
Document Page
Corporate Finance
8
References:
Hoyle Simon , 2006. " The sydney morning thread " Baked beans a lot more predictable than
shares. <https://www.smh.com.au/business/baked-beans-a-lot-more-predictable-than-shares-
20060311-gdn4nn.html>.
Michalski, Grzegorz. "Portfolio management approach in trade credit decision
making." arXiv preprint arXiv:1301.3823(2013).
Müller, Ralf, Miia Martinsuo, and Tomas Blomquist. "Project portfolio control and portfolio
management performance in different contexts." Project management journal 39, no. 3
(2008): 28-42.
Turner, J. Rodney. Handbook of project-based management. Vol. 92. New York, NY:
McGraw-hill, 2014.
Zhu, Shushang, and Masao Fukushima. "Worst-case conditional value-at-risk with
application to robust portfolio management." Operations research 57, no. 5 (2009): 1155-
1168.
chevron_up_icon
1 out of 8
circle_padding
hide_on_mobile
zoom_out_icon
[object Object]