Corporate Finance: Modern Portfolio Theory, CAPM & Risk Evaluation
VerifiedAdded on 2023/05/28
|11
|2719
|409
Essay
AI Summary
This essay provides a comprehensive analysis of modern portfolio theory (MPT) and the Capital Asset Pricing Model (CAPM) within the context of corporate finance. It begins by evaluating the principles of MPT, emphasizing the balance between risk and return and the creation of efficient portfolios. The essay then describes the CAPM model, highlighting its role in identifying and quantifying project and organizational risk, and its application in management's evaluation of investment risk. It further examines the underlying assumptions of the CAPM model and critiques their validity in real-world scenarios. The differences between systematic and unsystematic risk are evaluated, and the efficiency of the Irish Stock Exchange is assessed with a supporting example. Finally, the essay addresses a practical investment scenario, calculating portfolio beta and expected returns using CAPM, and discussing the role of diversification in minimizing unsystematic risk. Desklib offers a range of solved assignments and study resources to aid students in understanding these complex financial concepts.

CORPORATE FINANCE
STUDENT ID:
[Pick the date]
STUDENT ID:
[Pick the date]
Paraphrase This Document
Need a fresh take? Get an instant paraphrase of this document with our AI Paraphraser
Section A
Market Portfolio Theory (MPT) seeks to combine risk and returns as two key attributes
associated with any particular investment. The basic premise of this theory is that risk and
return ought to be not viewed in isolation as they are related with each other. It assumes that
all investors are rational and hence risk averse (Arnold, 2015). Therefore, any investor would
like to invest in an asset which tends to provide high returns while keeping the risk low.
However, this rarely happens as higher returns are provided as an incentive to the investor so
as to invest in the risky asset and thereby assume the incremental risk (Berk et. al., 2013).
According to MPT, the objective of an investor should not be to minimise risk in isolation or
maximise return in isolation but instead maximise the return per unit risk assumed. For this,
MPT suggests that efficient portfolios should be formed based on the underlying risk appetite
of the concerned investor. It is possible for the investor to find a portfolio which would
maximise the returns for a given value of risk that the investor has appetite for. As a result,
the best investment is one which is denoted by efficient frontier and refers to the precise
weightage of the assets in the portfolio which would result in highlighted return for the
investor (Damodaran, 2015).
Also, MPT highlights the concept of portfolio formation and hints at the reduction of risk
through diversification. In this regards, it offers the formula for computation of associated
risk and returns for a given portfolio. In order to obtain the efficient frontier, various
combinations of the two given assets are plotted on a graph with risk of portfolio denoted on
the X axis and returns of portfolio being denoted on the Y axis, Considering the scatter of
these two variables, the optimum portfolio may be identified. As a result, it may be stated that
MPT has played a crucial role with regards to laying the foundation for modern day portfolio
formation (Petty et. al., 2015).
1
Section B
The techniques of portfolio management can be reliably applied only when there is accurate
estimation of the systematic risk that tends to be linked with a given security. In this regards ,
a key role is played by the Capital Asset Pricing Model (CAPM) which essentially derives
from the modern portfolio theory and was suggested in the 1960’s. The basic premise of the
CAPM model is that with regards to the returns that investors would expect on their
investment, there would be two components. One would be the opportunity cost as the money
invested in a given security could have been invested in the risk free asset and returns could
have been earned (Christensen et. al., 2013). As a result, the CAPM approach first
compensates the investor by providing the risk free rate. The second component provides risk
adjusted returns based on the underlying risk of the underlying investment. The yardstick in
this process is the market index which tends to have a beta of 1. The beta of the underlying
investment would act as a measure of risk which would highlight the risk of the stock in
comparison to the market. Hence, in line with the modern portfolio theory, investors are
compensated for assuming higher risk (Brealey, Myers and Allen, 2014).
The CAPM model can be captured using the following linear equation (Kane & Marcus,
2013).
The various key elements in the above equation are defined below.
E(R) – Expected returns on the given stock
Rf – Rare on the risk free asset
Β – Beta or measure of systematic risk for the given stock
Rm – Highlights the expected market index returns based on empirical performance
The linear equation indicated above can be captured graphically and tends to known as the
Security Market Line as highlighted below (Damodaran, 2015).
2
⊘ This is a preview!⊘
Do you want full access?
Subscribe today to unlock all pages.
Trusted by 1+ million students worldwide
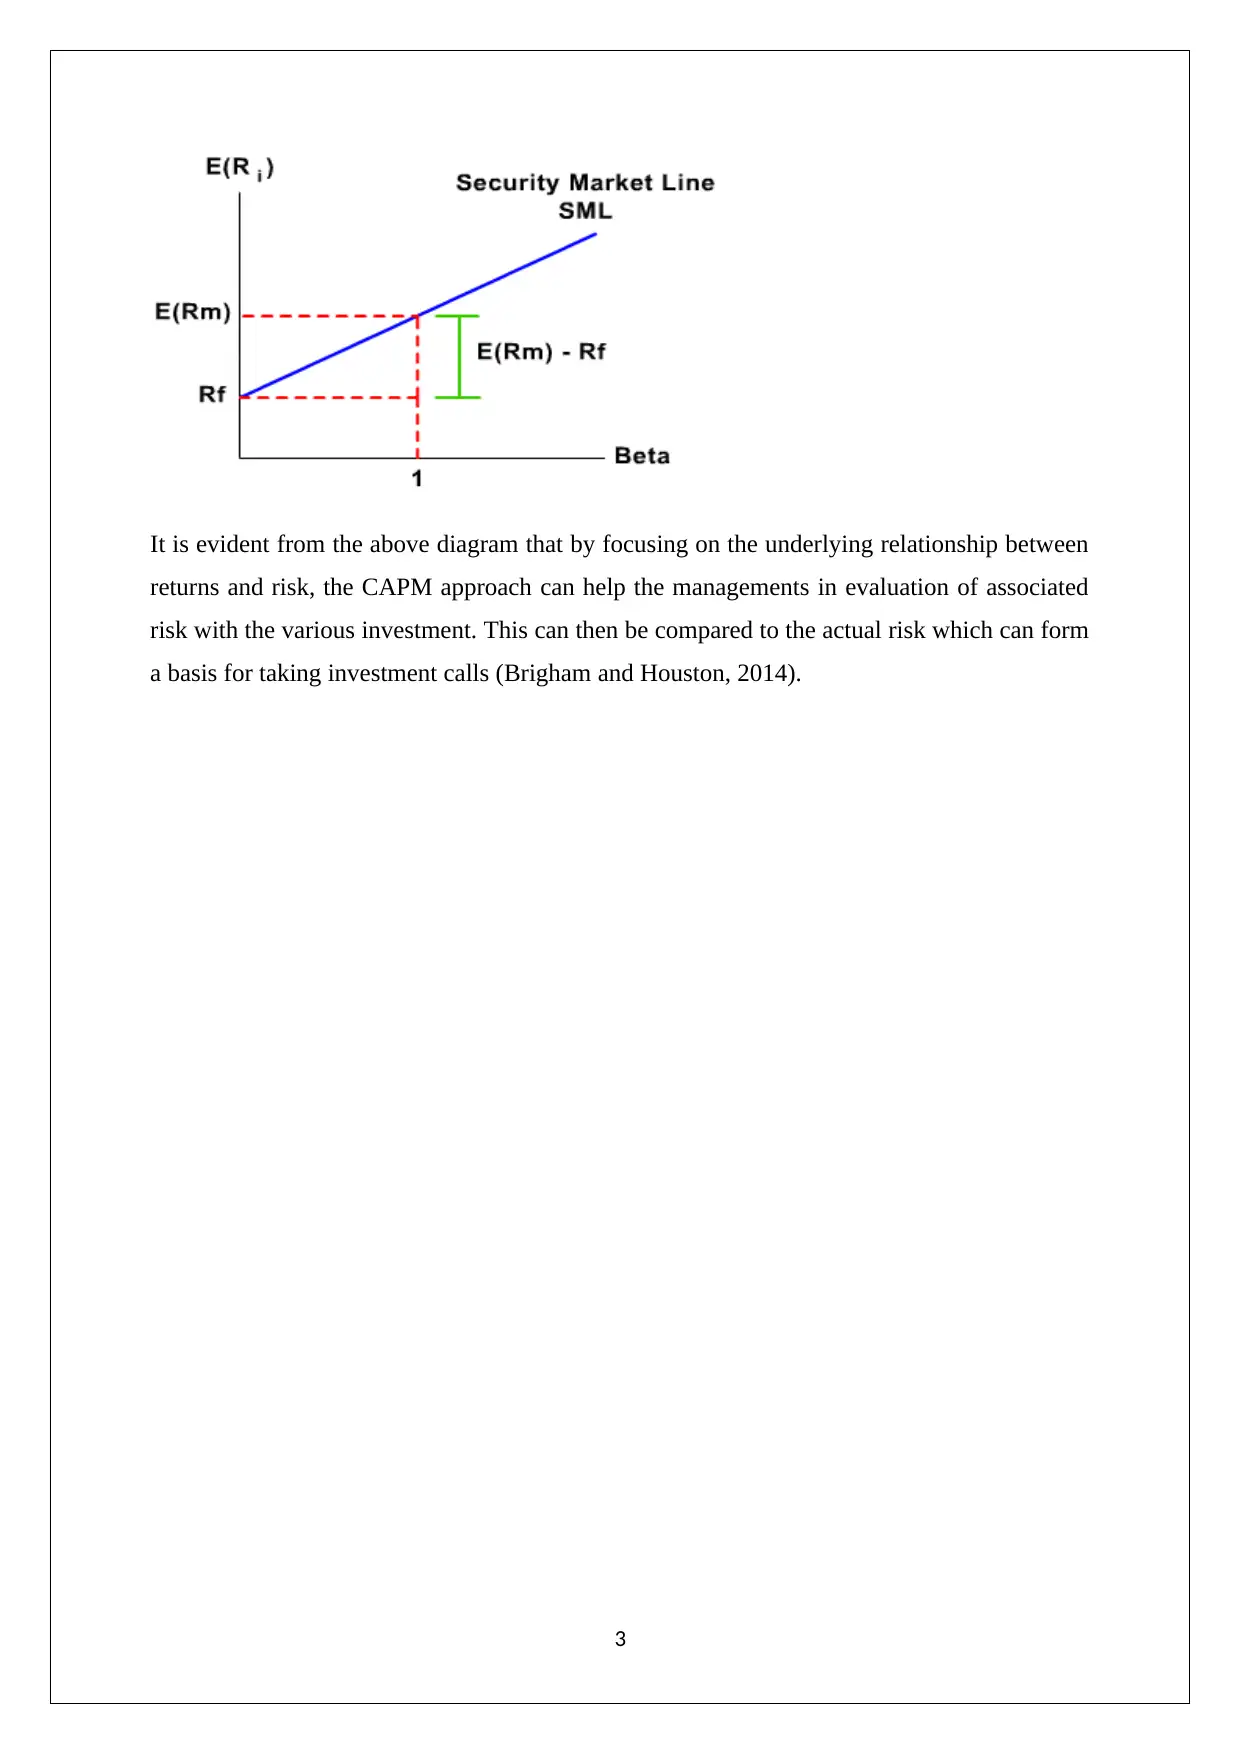
It is evident from the above diagram that by focusing on the underlying relationship between
returns and risk, the CAPM approach can help the managements in evaluation of associated
risk with the various investment. This can then be compared to the actual risk which can form
a basis for taking investment calls (Brigham and Houston, 2014).
3
returns and risk, the CAPM approach can help the managements in evaluation of associated
risk with the various investment. This can then be compared to the actual risk which can form
a basis for taking investment calls (Brigham and Houston, 2014).
3
Paraphrase This Document
Need a fresh take? Get an instant paraphrase of this document with our AI Paraphraser

Section C
The CAPM model is based on a host of assumptions that have been outlined as follows
(Ehrhardt and Brigham, 2016).
a) The investors are risk averse along with being rational in investment decision making.
The net result is that there is a preference amongst investors for assets which tend to
provide same returns but with lesser risk. Also, when choosing the optimum
investment, rational behaviour would be exhibited by investors.
b) A diversified portfolio is used by the investors for investing so that the diversifiable
risk can be eliminated.
c) The market participants can borrow and also lend any amount of funds at the risk free
interest rate.
d) The investors tend to be price takers which imply that they cannot influence the
market prices.
e) The assets tend to highly liquid and it is possible to divide these into sub-parts which
are smaller.
f) With regards to the various trades that are made by the investors, there is absence of
taxes and transaction costs.
g) Owing to rationality on part of investors, they have homogeneous expectations and
hence tend to reach in a similar manner to various developments in the market.
h) Also, perfect information symmetry is assumed to exist in the market and hence all
the investors have access to the relevant information which can impact stock prices.
It is noteworthy that in real life most of the above assumptions do not stand true owing to
which challenges are raised on the validity of the CAPM model.
4
Section D
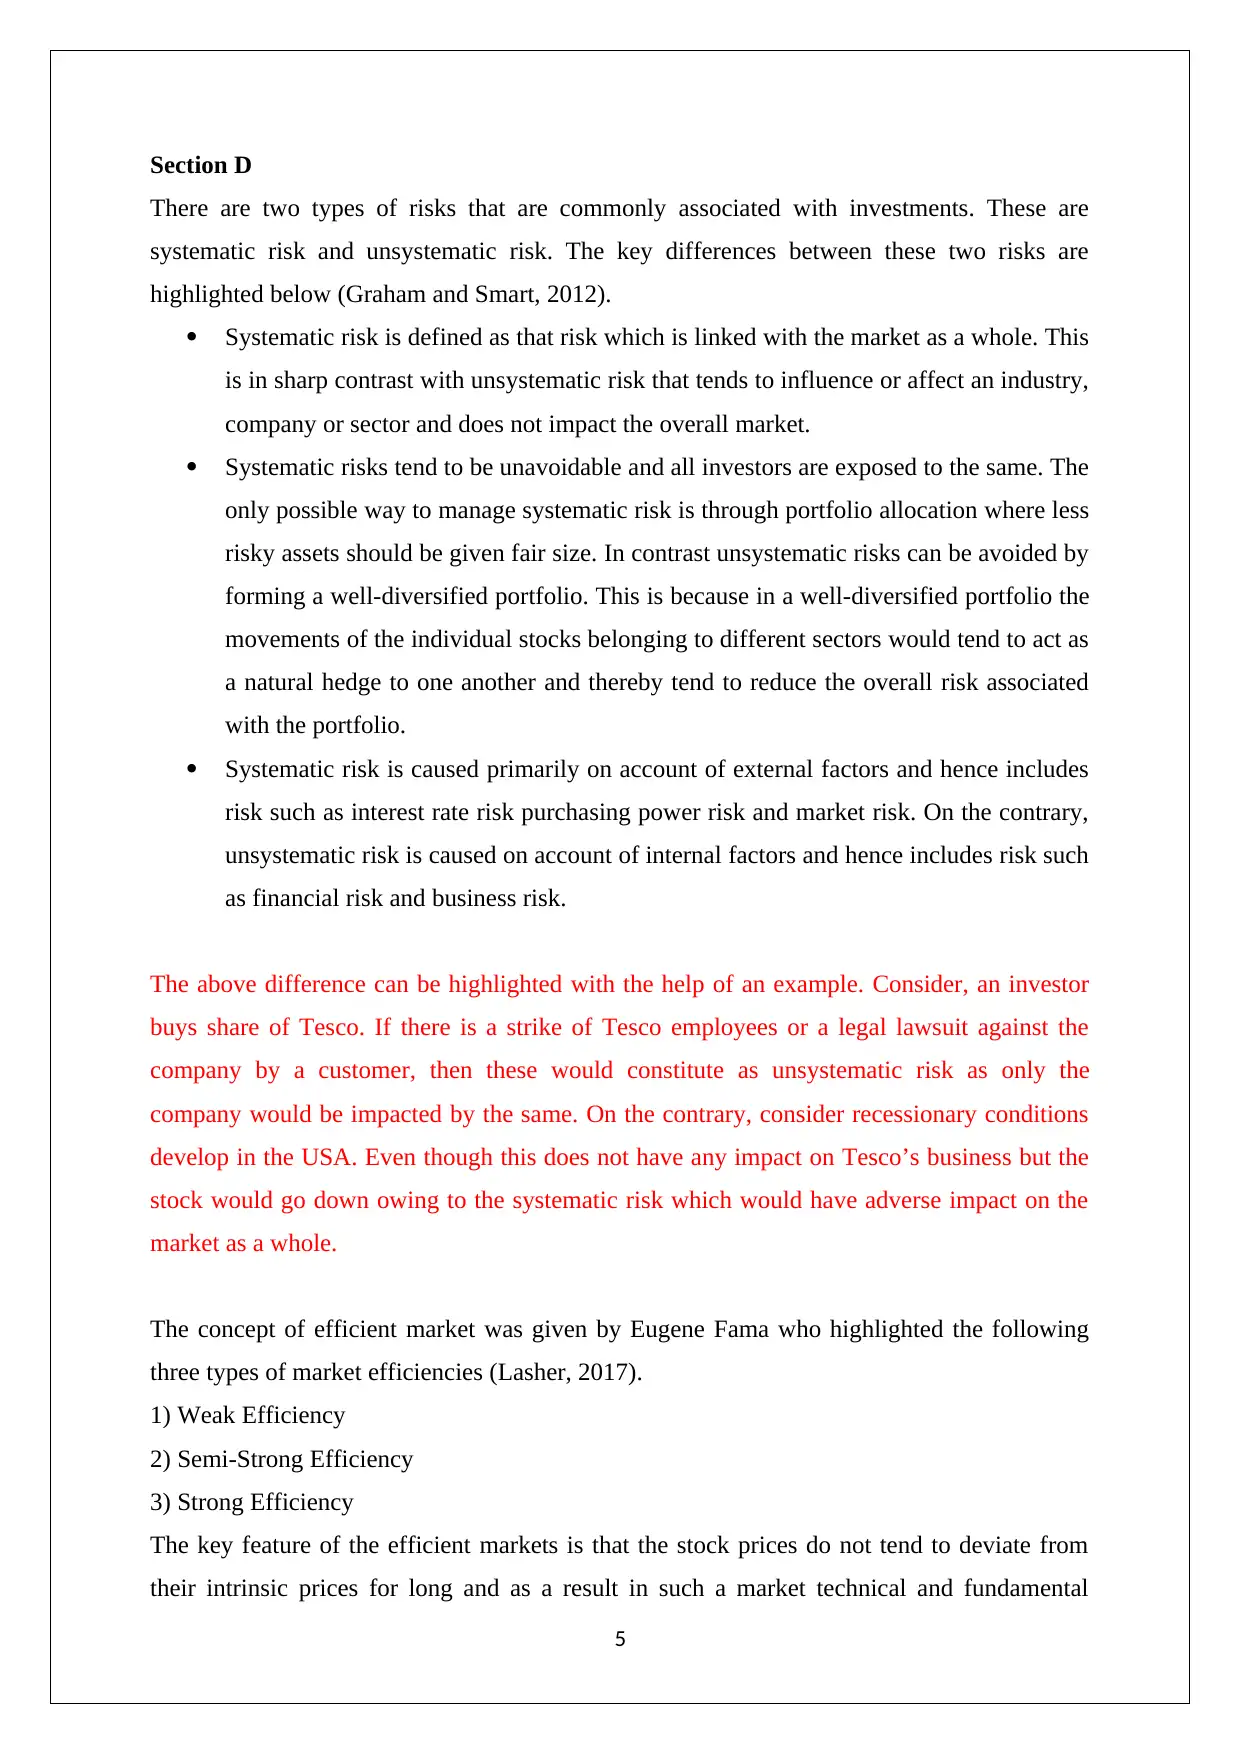
There are two types of risks that are commonly associated with investments. These are
systematic risk and unsystematic risk. The key differences between these two risks are
highlighted below (Graham and Smart, 2012).
Systematic risk is defined as that risk which is linked with the market as a whole. This
is in sharp contrast with unsystematic risk that tends to influence or affect an industry,
company or sector and does not impact the overall market.
Systematic risks tend to be unavoidable and all investors are exposed to the same. The
only possible way to manage systematic risk is through portfolio allocation where less
risky assets should be given fair size. In contrast unsystematic risks can be avoided by
forming a well-diversified portfolio. This is because in a well-diversified portfolio the
movements of the individual stocks belonging to different sectors would tend to act as
a natural hedge to one another and thereby tend to reduce the overall risk associated
with the portfolio.
Systematic risk is caused primarily on account of external factors and hence includes
risk such as interest rate risk purchasing power risk and market risk. On the contrary,
unsystematic risk is caused on account of internal factors and hence includes risk such
as financial risk and business risk.
The above difference can be highlighted with the help of an example. Consider, an investor
buys share of Tesco. If there is a strike of Tesco employees or a legal lawsuit against the
company by a customer, then these would constitute as unsystematic risk as only the
company would be impacted by the same. On the contrary, consider recessionary conditions
develop in the USA. Even though this does not have any impact on Tesco’s business but the
stock would go down owing to the systematic risk which would have adverse impact on the
market as a whole.
The concept of efficient market was given by Eugene Fama who highlighted the following
three types of market efficiencies (Lasher, 2017).
1) Weak Efficiency
2) Semi-Strong Efficiency
3) Strong Efficiency
The key feature of the efficient markets is that the stock prices do not tend to deviate from
their intrinsic prices for long and as a result in such a market technical and fundamental
5
⊘ This is a preview!⊘
Do you want full access?
Subscribe today to unlock all pages.
Trusted by 1+ million students worldwide
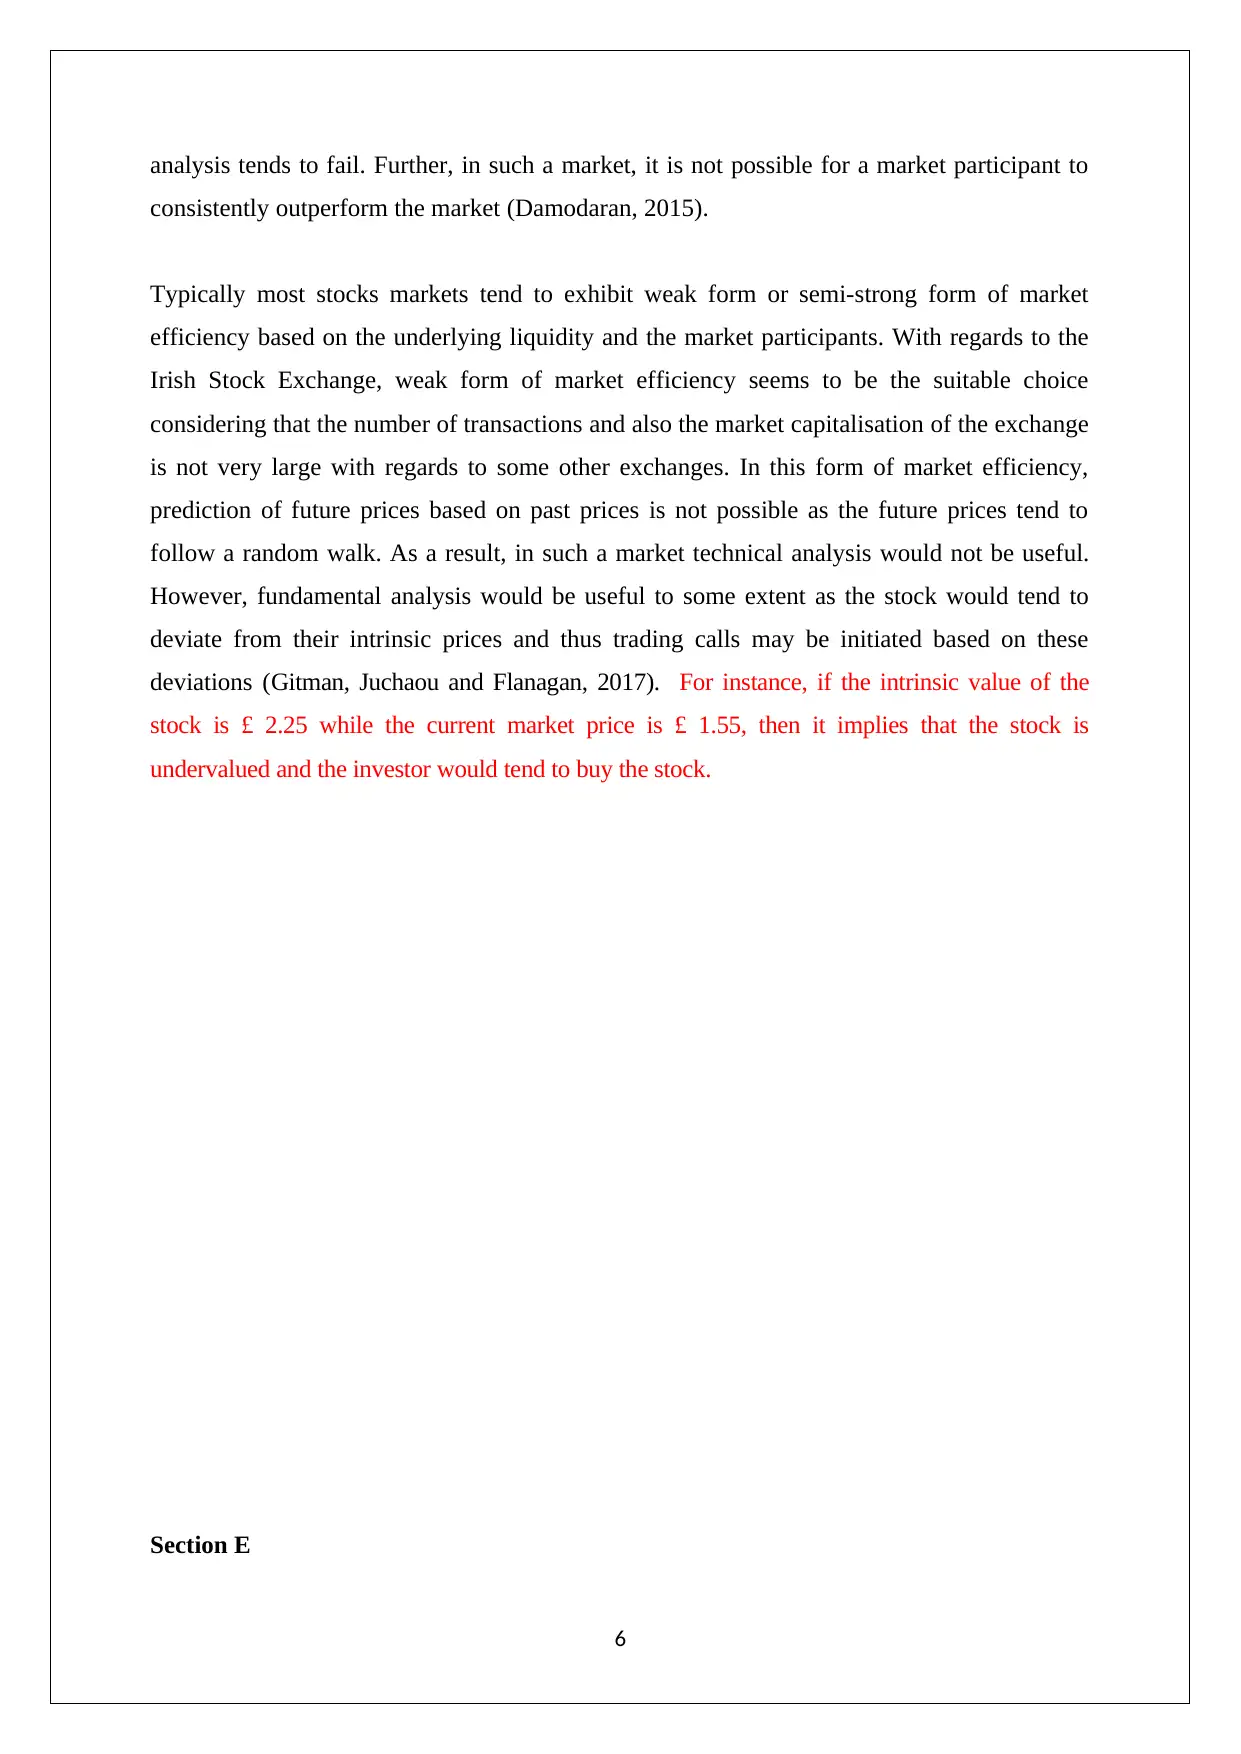
analysis tends to fail. Further, in such a market, it is not possible for a market participant to
consistently outperform the market (Damodaran, 2015).
Typically most stocks markets tend to exhibit weak form or semi-strong form of market
efficiency based on the underlying liquidity and the market participants. With regards to the
Irish Stock Exchange, weak form of market efficiency seems to be the suitable choice
considering that the number of transactions and also the market capitalisation of the exchange
is not very large with regards to some other exchanges. In this form of market efficiency,
prediction of future prices based on past prices is not possible as the future prices tend to
follow a random walk. As a result, in such a market technical analysis would not be useful.
However, fundamental analysis would be useful to some extent as the stock would tend to
deviate from their intrinsic prices and thus trading calls may be initiated based on these
deviations (Gitman, Juchaou and Flanagan, 2017). For instance, if the intrinsic value of the
stock is £ 2.25 while the current market price is £ 1.55, then it implies that the stock is
undervalued and the investor would tend to buy the stock.
Section E
6
Paraphrase This Document
Need a fresh take? Get an instant paraphrase of this document with our AI Paraphraser
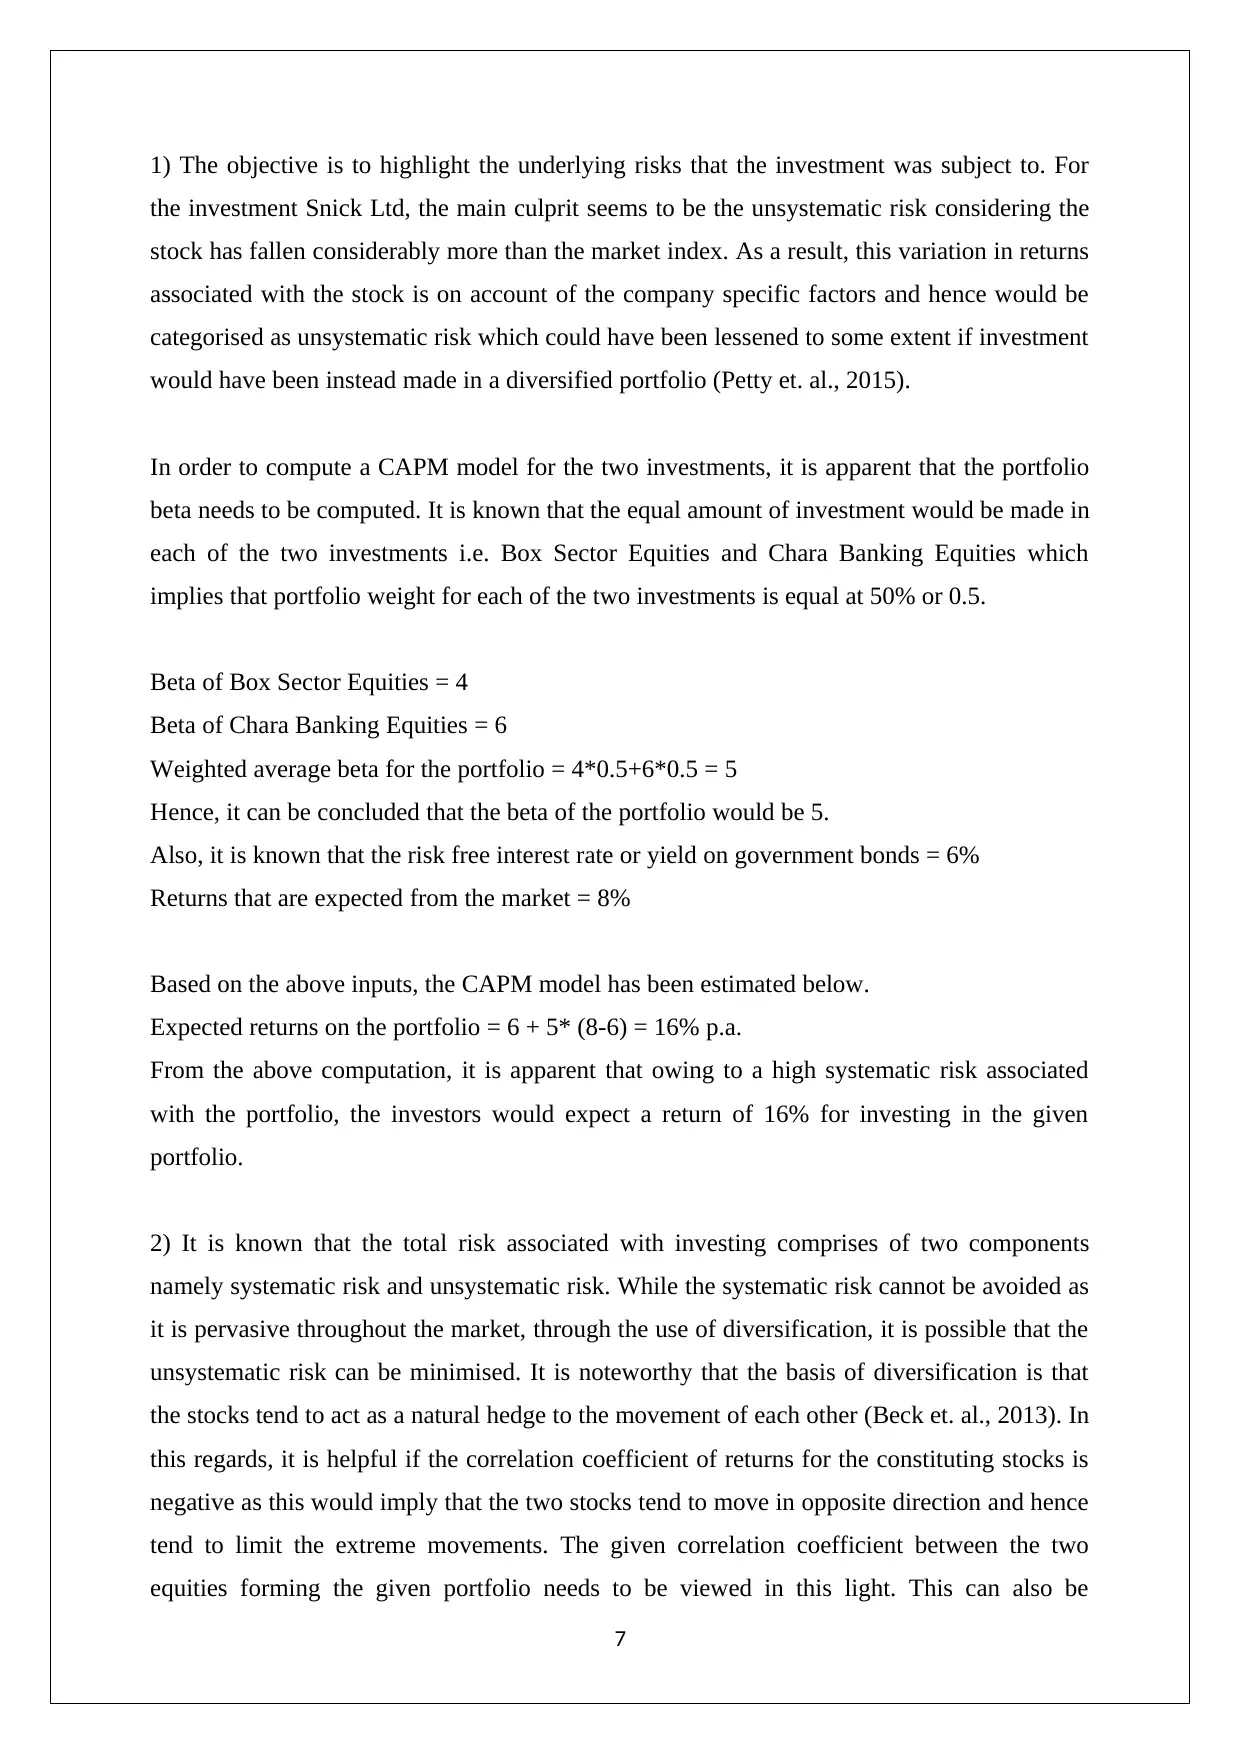
1) The objective is to highlight the underlying risks that the investment was subject to. For
the investment Snick Ltd, the main culprit seems to be the unsystematic risk considering the
stock has fallen considerably more than the market index. As a result, this variation in returns
associated with the stock is on account of the company specific factors and hence would be
categorised as unsystematic risk which could have been lessened to some extent if investment
would have been instead made in a diversified portfolio (Petty et. al., 2015).
In order to compute a CAPM model for the two investments, it is apparent that the portfolio
beta needs to be computed. It is known that the equal amount of investment would be made in
each of the two investments i.e. Box Sector Equities and Chara Banking Equities which
implies that portfolio weight for each of the two investments is equal at 50% or 0.5.
Beta of Box Sector Equities = 4
Beta of Chara Banking Equities = 6
Weighted average beta for the portfolio = 4*0.5+6*0.5 = 5
Hence, it can be concluded that the beta of the portfolio would be 5.
Also, it is known that the risk free interest rate or yield on government bonds = 6%
Returns that are expected from the market = 8%
Based on the above inputs, the CAPM model has been estimated below.
Expected returns on the portfolio = 6 + 5* (8-6) = 16% p.a.
From the above computation, it is apparent that owing to a high systematic risk associated
with the portfolio, the investors would expect a return of 16% for investing in the given
portfolio.
2) It is known that the total risk associated with investing comprises of two components
namely systematic risk and unsystematic risk. While the systematic risk cannot be avoided as
it is pervasive throughout the market, through the use of diversification, it is possible that the
unsystematic risk can be minimised. It is noteworthy that the basis of diversification is that
the stocks tend to act as a natural hedge to the movement of each other (Beck et. al., 2013). In
this regards, it is helpful if the correlation coefficient of returns for the constituting stocks is
negative as this would imply that the two stocks tend to move in opposite direction and hence
tend to limit the extreme movements. The given correlation coefficient between the two
equities forming the given portfolio needs to be viewed in this light. This can also be
7
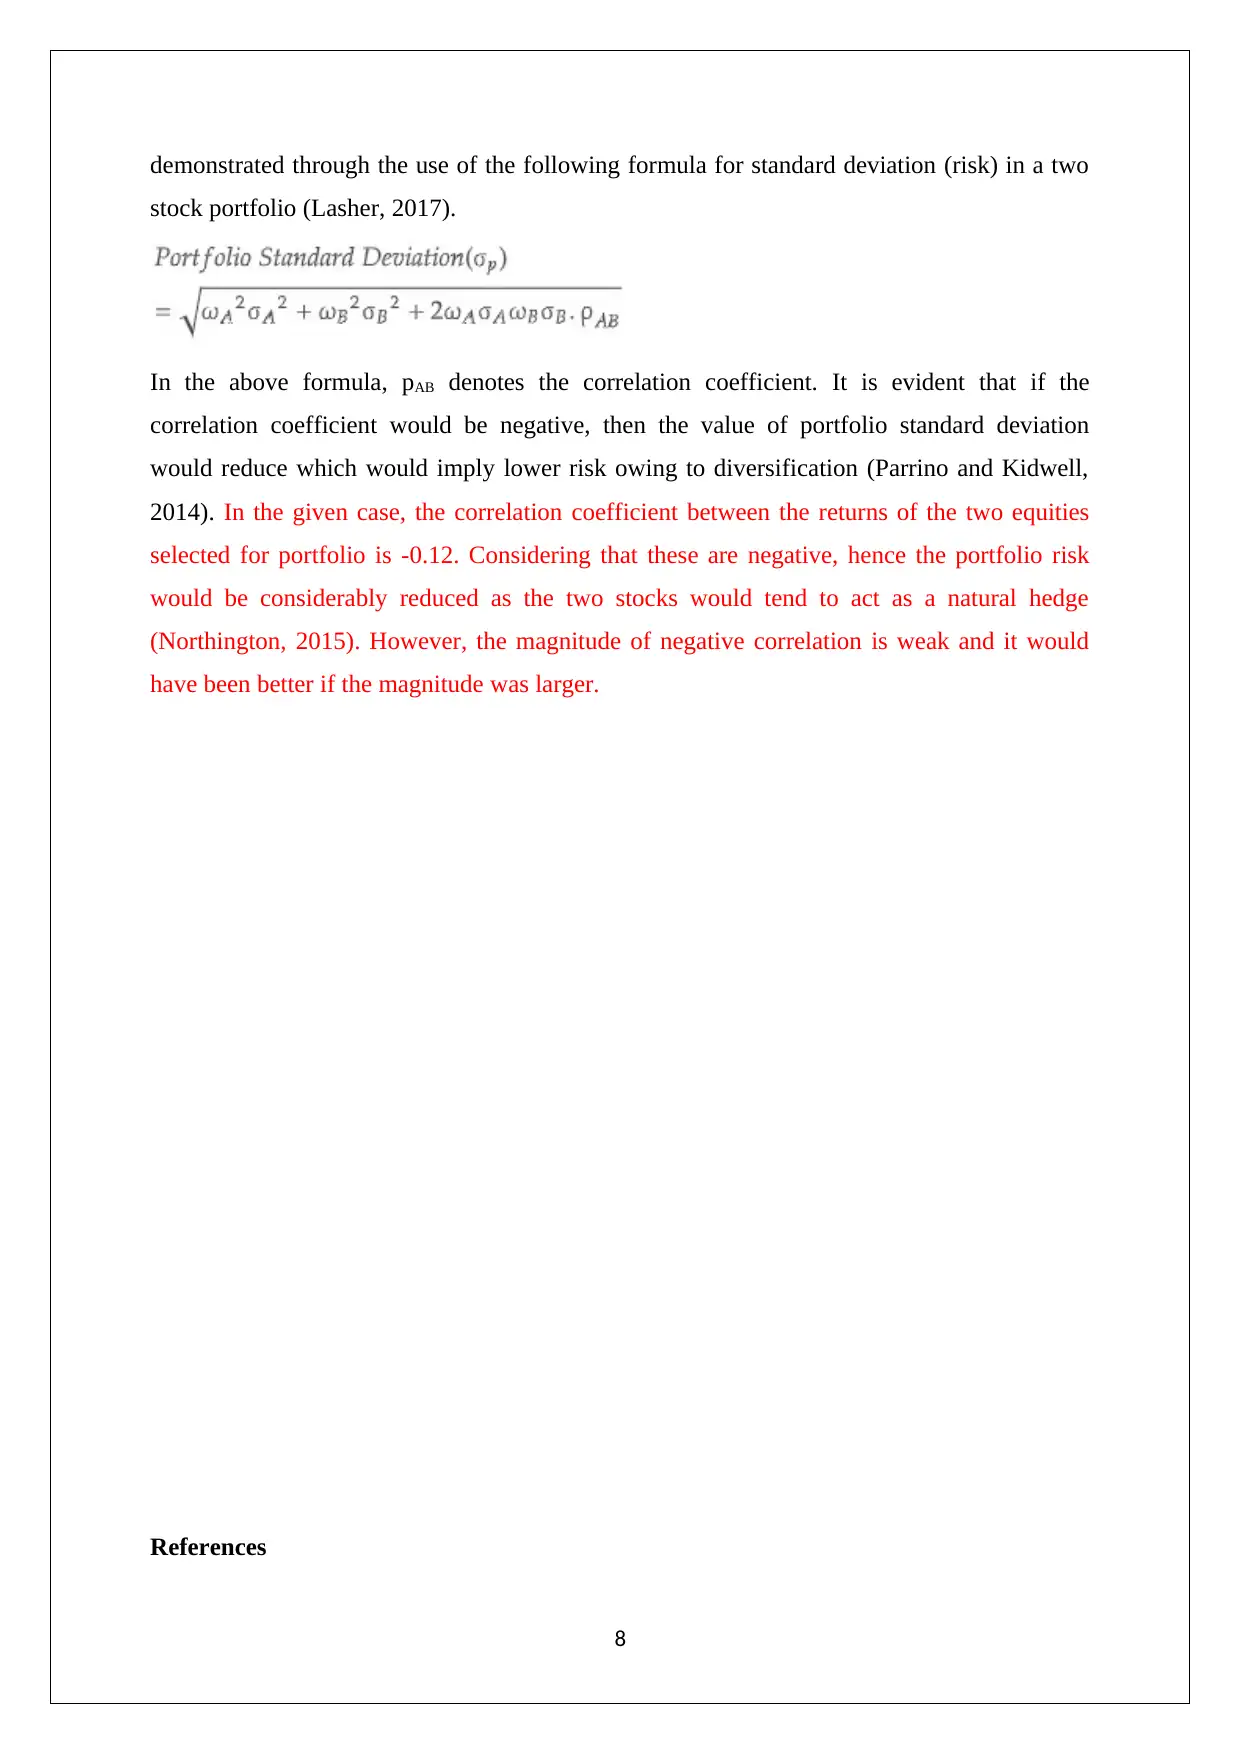
demonstrated through the use of the following formula for standard deviation (risk) in a two
stock portfolio (Lasher, 2017).
In the above formula, pAB denotes the correlation coefficient. It is evident that if the
correlation coefficient would be negative, then the value of portfolio standard deviation
would reduce which would imply lower risk owing to diversification (Parrino and Kidwell,
2014). In the given case, the correlation coefficient between the returns of the two equities
selected for portfolio is -0.12. Considering that these are negative, hence the portfolio risk
would be considerably reduced as the two stocks would tend to act as a natural hedge
(Northington, 2015). However, the magnitude of negative correlation is weak and it would
have been better if the magnitude was larger.
References
8
⊘ This is a preview!⊘
Do you want full access?
Subscribe today to unlock all pages.
Trusted by 1+ million students worldwide
Arnold, G. (2015) Corporate Financial Management. 3rd ed. Sydney: Financial Times
Management.
Berk, J., DeMarzo, P., Harford, J., Ford, G., Mollica, V. and Finch, N. (2013) Fundamentals
of corporate finance, London: Pearson Higher Education
Brealey, R. A., Myers, S. C. and Allen, F. (2014) Principles of corporate finance, 2nd ed.
New York: McGraw-Hill Inc.
Brigham, E. F. and Houston, J. F., (2014). .Fundamentals of Financial Management, 4th ed.
Boston: Cengage Learning.
Christensen, M, Drew, M, Blanchi, R . and Ross, S. (2013), Fundamentals of Corporate
Finance, 6th ed., New York: McGraw Hill
Damodaran, A. (2015). Applied corporate finance: A user’s manual 3rd ed. New York:
Wiley, John & Sons.
Ehrhardt, M. C. and Brigham, E. F. (2016) Corporate Finance: A Focused Approach. 6th ed.
London: South- Western College Publisher
Gitman, L.J., Juchaou, R., and Flanagan, J. (2017).Principles of Managerial Finance, 3rd ed.
NSW: Pearson Australia
Graham, J. and Smart, S. (2012), Introduction to corporate finance, 5th ed., Sydney: South-
Western Cengage Learning
Kane, B.Z. and Marcus, A.J. (2013) Essentials of Investment, 9th ed, Singapore: McGraw-Hill
International
Lasher, W. R., (2017) Practical Financial Management 5th ed. London: South- Western
College Publisher.
Northington, S. (2015) Finance, 4th ed. New York: Ferguson
Parrino, R. and Kidwell, D. (2014) Fundamentals of Corporate Finance, 3rd ed. London:
Wiley Publications
9
Paraphrase This Document
Need a fresh take? Get an instant paraphrase of this document with our AI Paraphraser

Petty, J.W., Titman, S., Keown, A., Martin, J.D., Martin, P., Burrow, M. and Nguyen, H. (2015).
Financial Management, Principles and Applications, 6th ed.. NSW: Pearson Education, French
Forest Australia
10
Financial Management, Principles and Applications, 6th ed.. NSW: Pearson Education, French
Forest Australia
10
1 out of 11
Related Documents


Your All-in-One AI-Powered Toolkit for Academic Success.
+13062052269
info@desklib.com
Available 24*7 on WhatsApp / Email
![[object Object]](/_next/static/media/star-bottom.7253800d.svg)
Unlock your academic potential
Copyright © 2020–2026 A2Z Services. All Rights Reserved. Developed and managed by ZUCOL.