Portfolio Analysis and Expected Returns: Finance for Managers
VerifiedAdded on 2023/06/18
|9
|1568
|266
Report
AI Summary
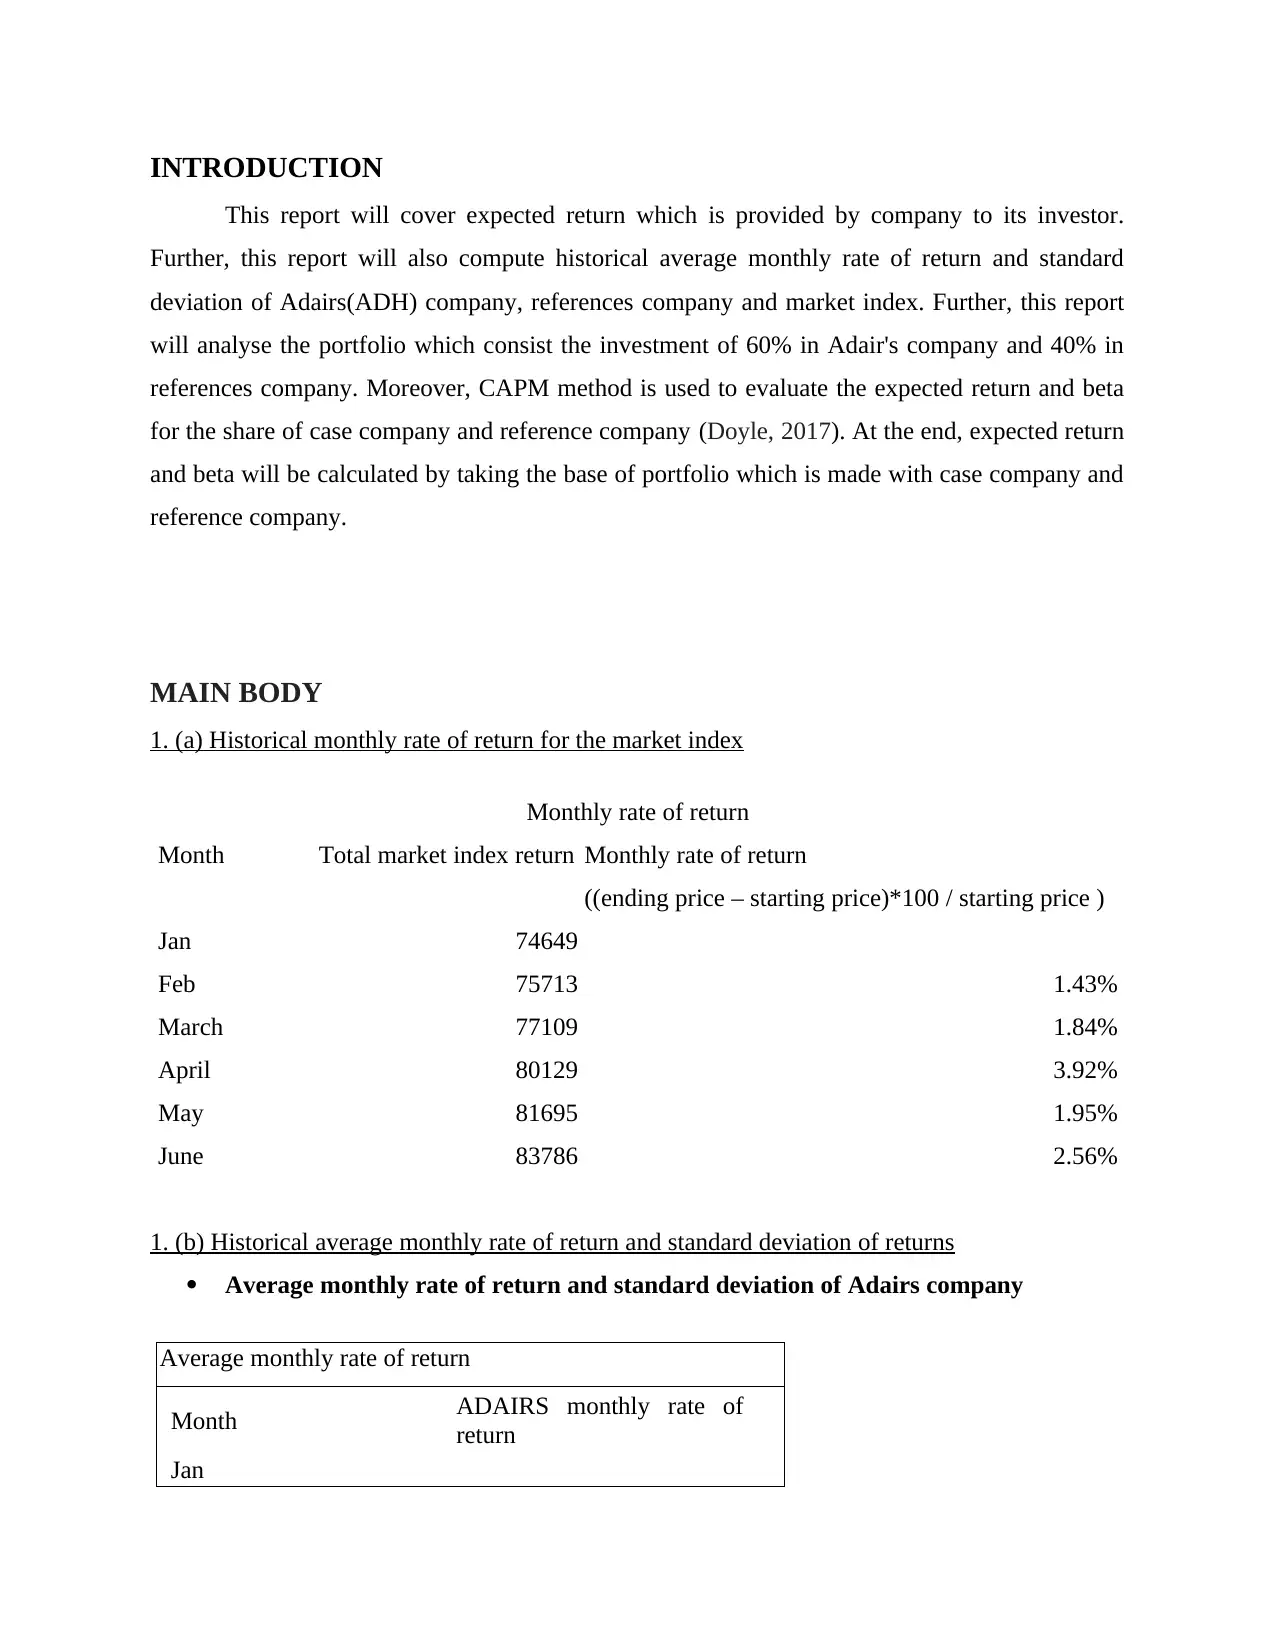
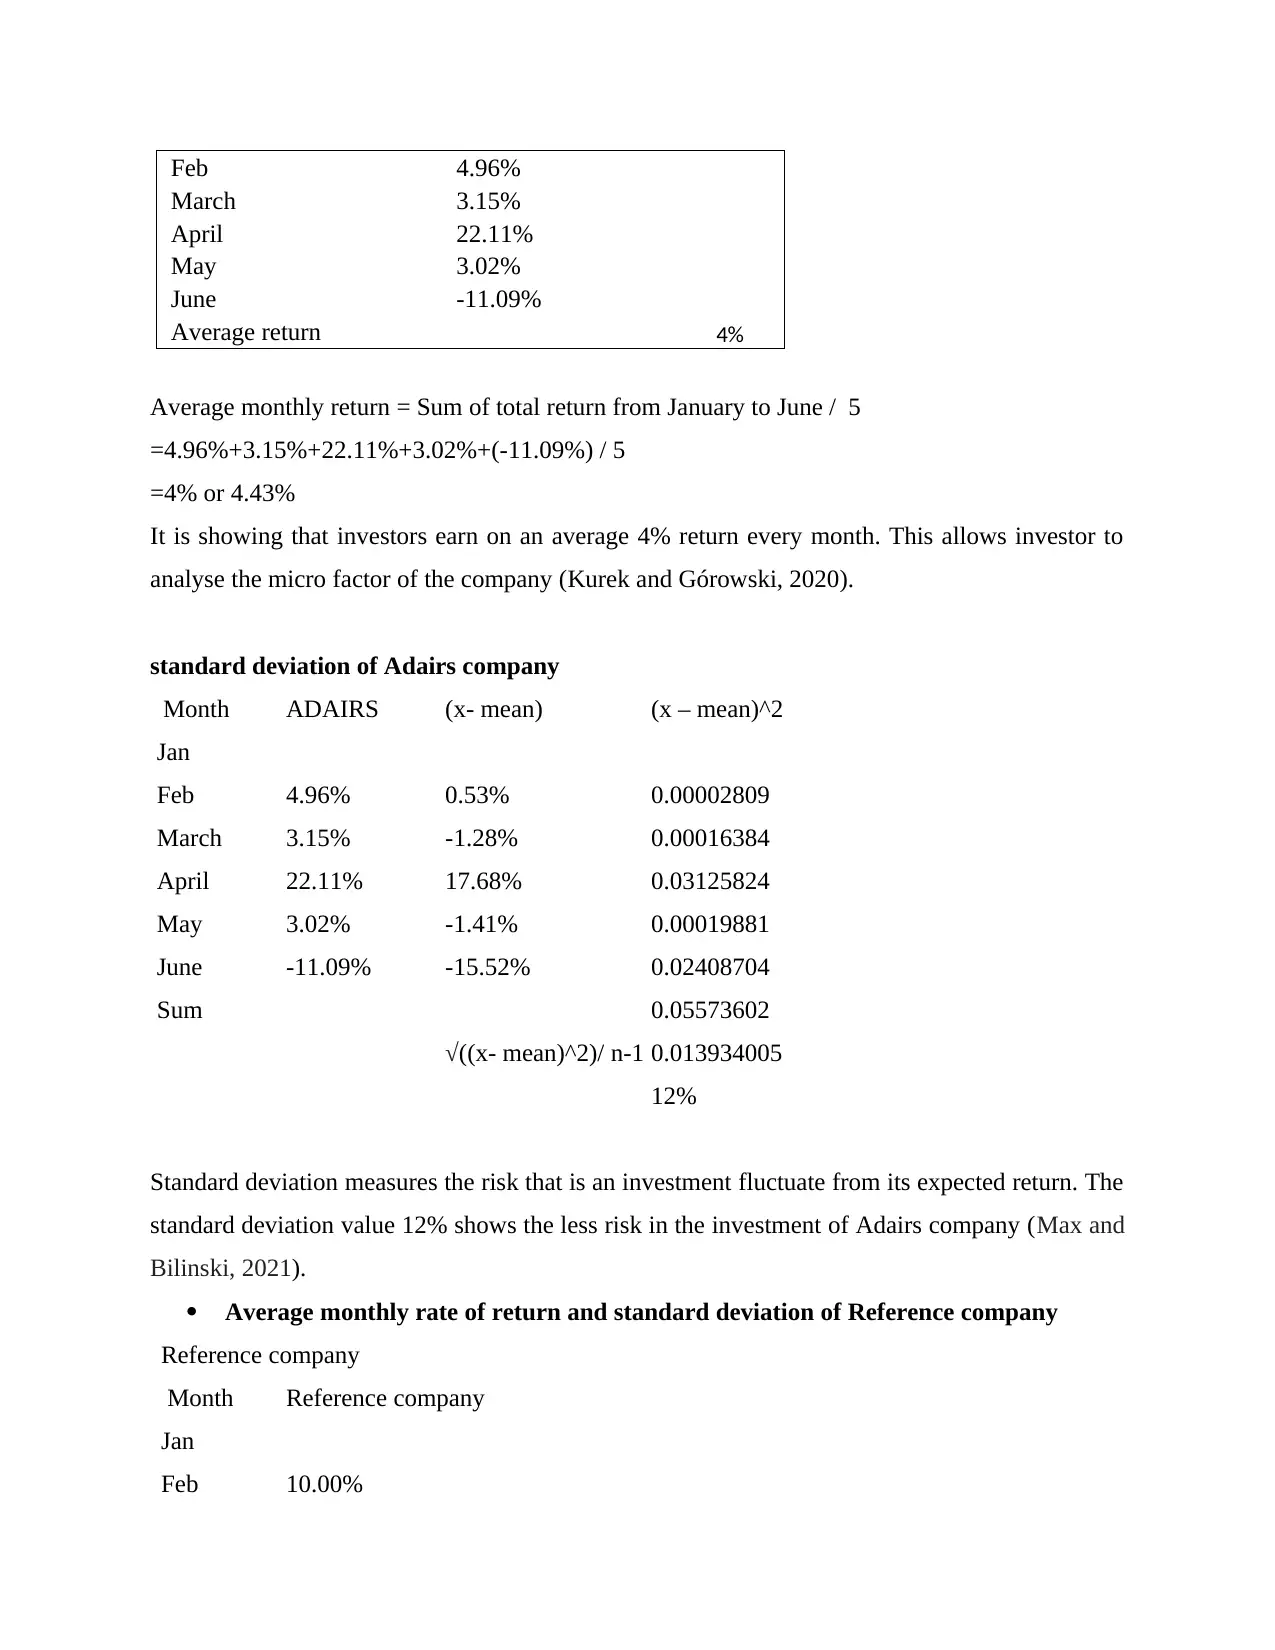
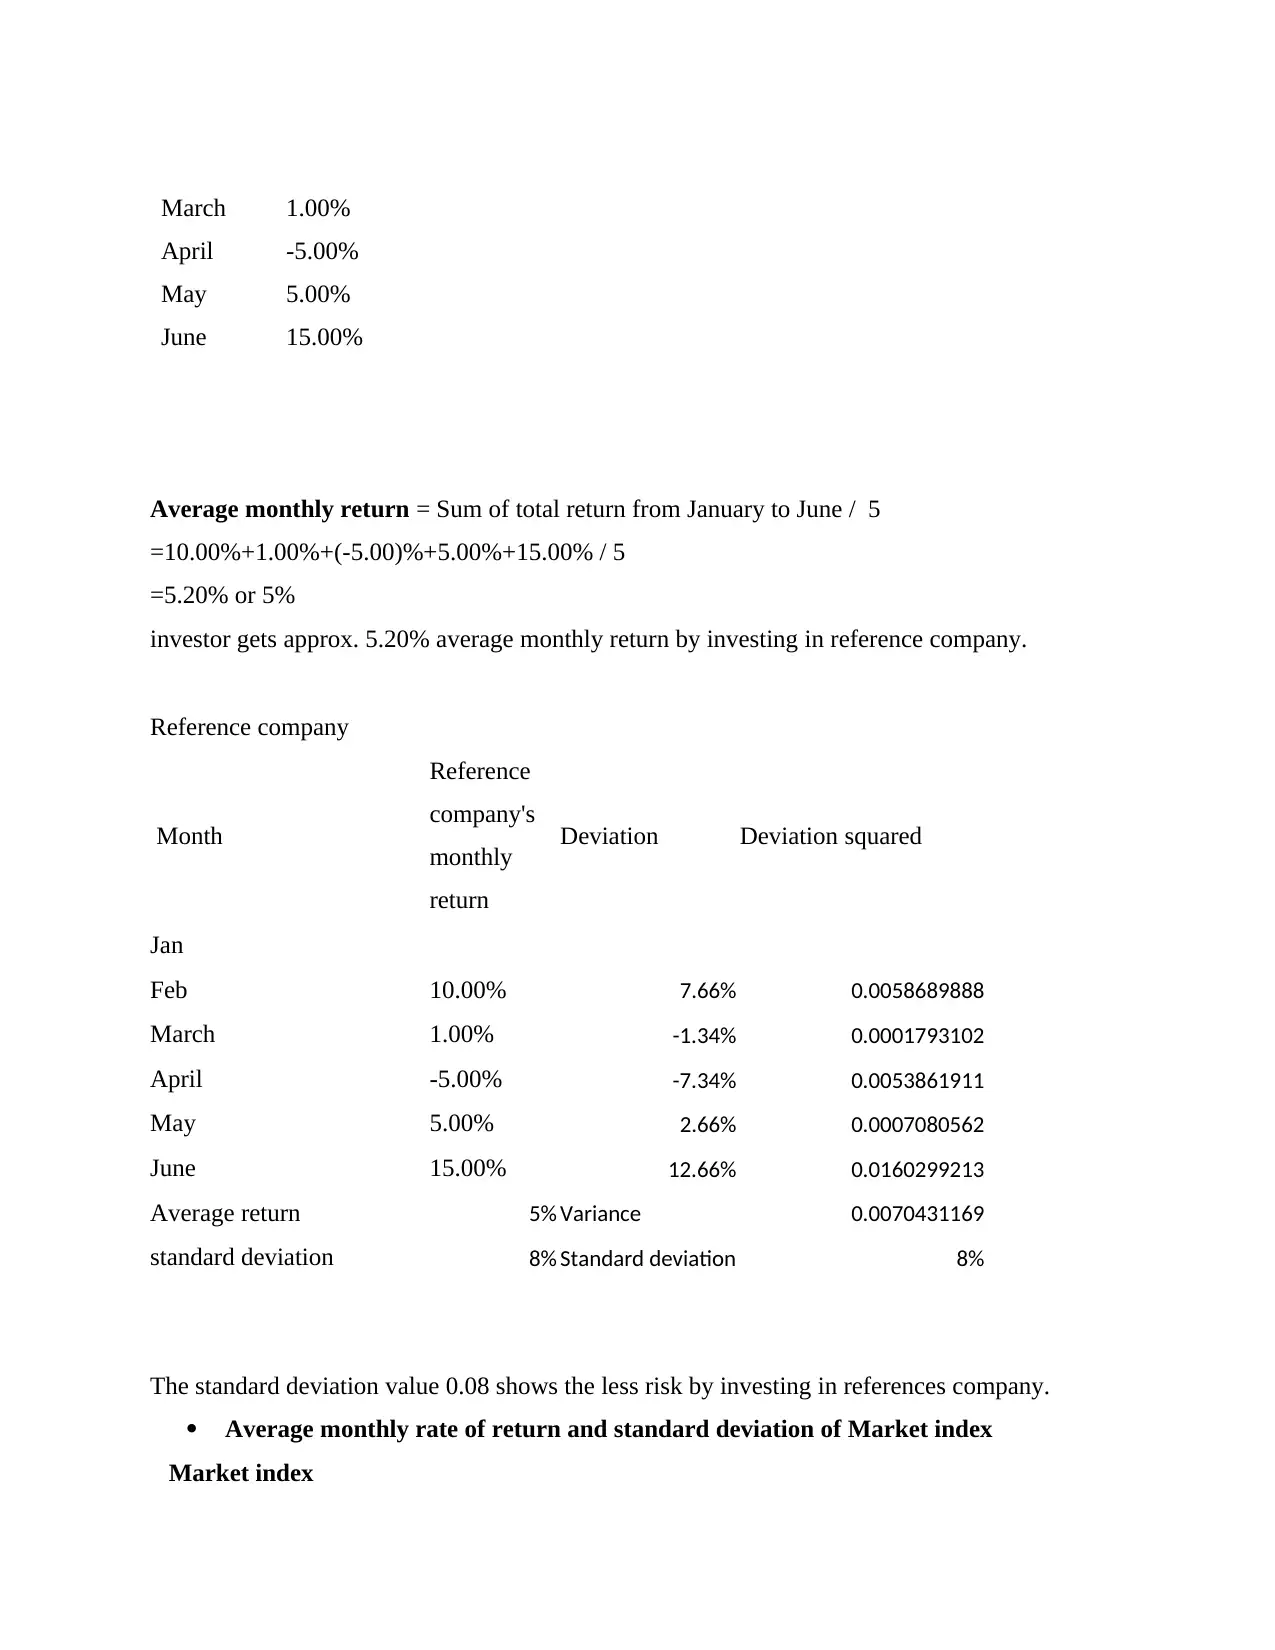
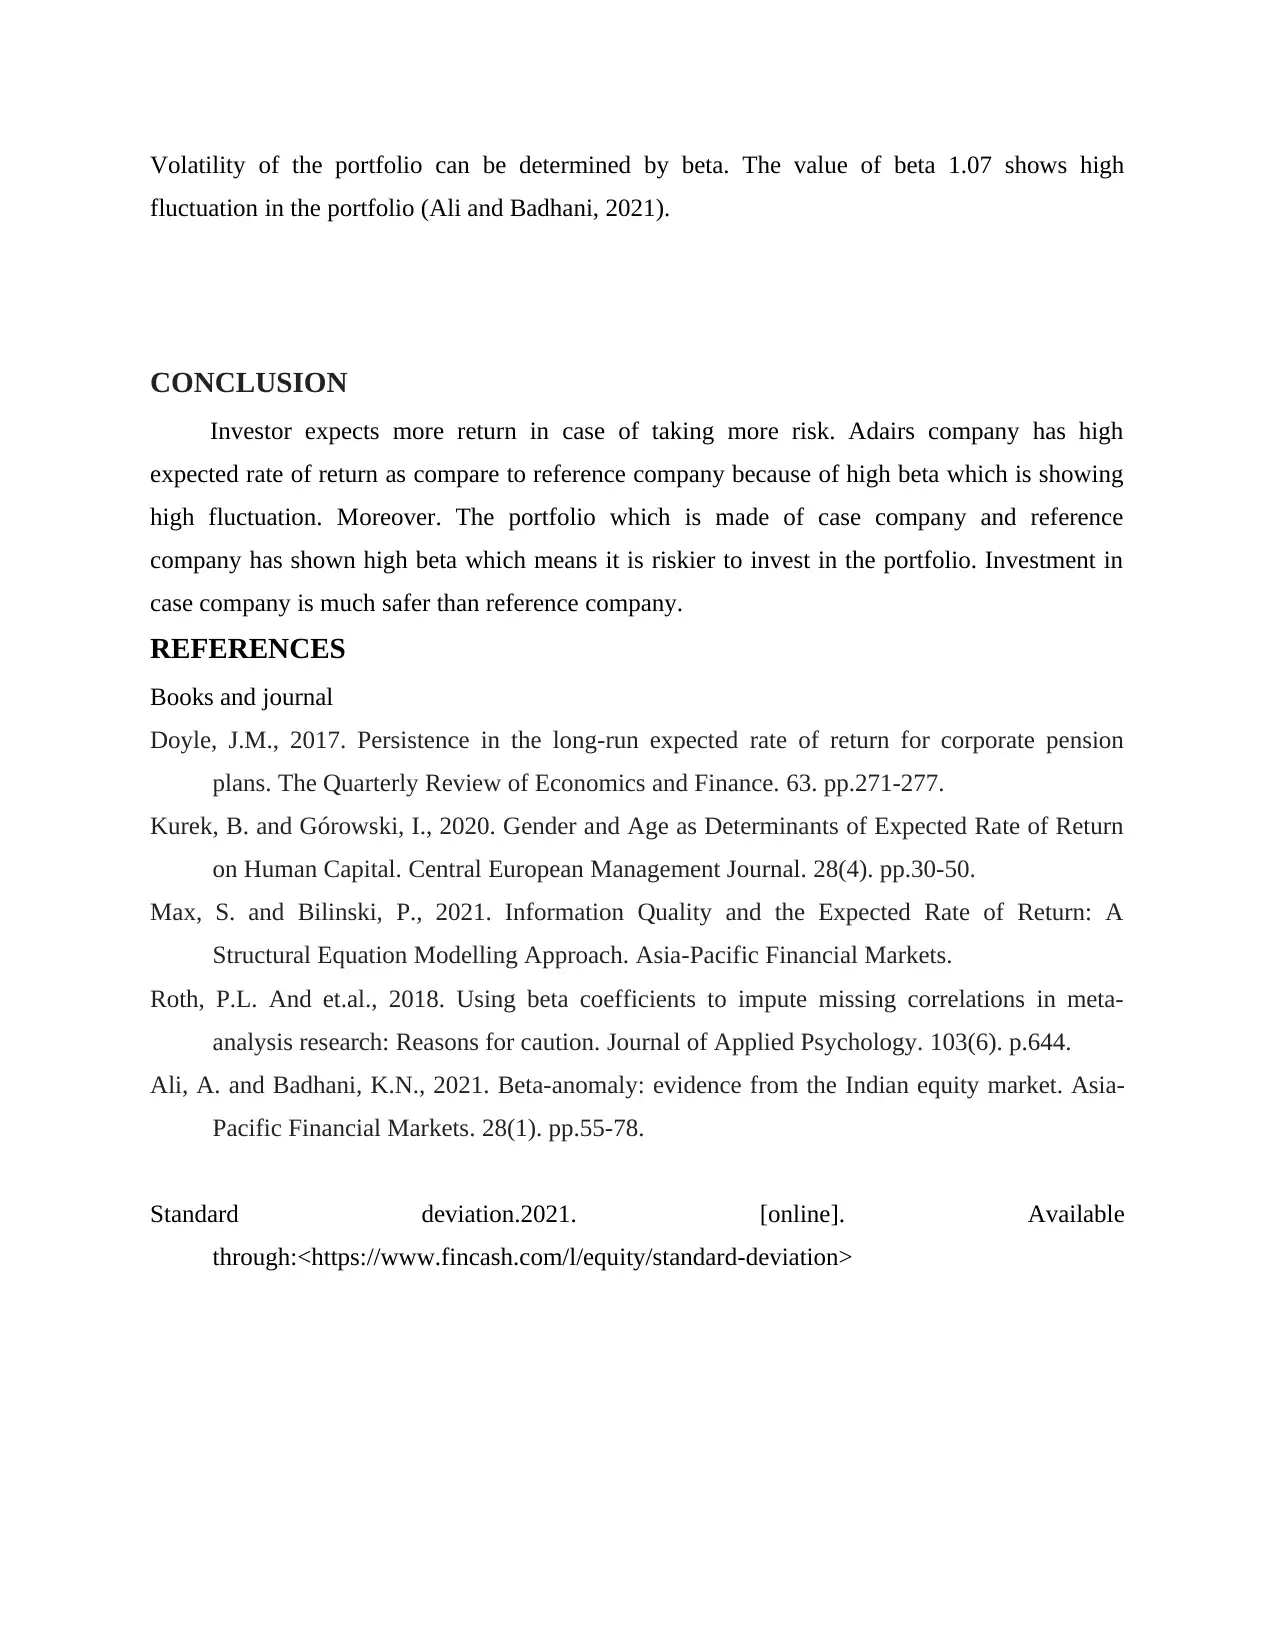
This report provides a comprehensive analysis of expected returns, standard deviation, and portfolio beta for Adairs company, a reference company, and a market index. Using historical monthly rate of return data, the report calculates average monthly returns and standard deviations for each entity. It further explores the construction of a portfolio with 60% investment in Adairs and 40% in the reference company, determining the portfolio's expected return and beta. The Capital Asset Pricing Model (CAPM) is employed to evaluate the expected return and beta for both companies' shares. The analysis concludes that higher expected returns are associated with higher risk, with Adairs demonstrating a higher expected return due to its higher beta, indicating greater volatility. Desklib provides access to this report and other solved assignments for students.

1 out of 9
Related Documents


Your All-in-One AI-Powered Toolkit for Academic Success.
+13062052269
info@desklib.com
Available 24*7 on WhatsApp / Email
![[object Object]](/_next/static/media/star-bottom.7253800d.svg)
Copyright © 2020–2026 A2Z Services. All Rights Reserved. Developed and managed by ZUCOL.